2. Hyde et al. • Musical Brain Development
3020 • J. Neurosci., March 11, 2009 • 29(10):3019 –3025
Table 1. Subject characteristics
Characteristics
Instrumentals (n ϭ 15)
Controls (n ϭ 16)
Age at start of study (SD)
Time from MRI scan 1 to scan 2 (SD)
Socioeconomic standard*
Gender
6.32 (0.82) years
15.60 (3.30) months
5.10 (0.60)
9 females; 6 males
5.90 (0.54) years
14.80 (3.80) months
4.60 (0.80)
7 females; 9 males
*Socioeconomic standard was defined on a six-point scale, with a score of 1, reflecting that the children’s parents
had some high school education, to a score of 6, reflecting that parents had a doctoral degree (Norton et al., 2005).
brain deformation changes after 15 months with performance
changes on behavioral tests.
Materials and Methods
Participants. We tested two groups of children that were recruited from
Boston area public schools and who had no prior formal musical training
(see Table 1). The “instrumental” group consisted of 15 children (mean
age at start of study 6.32 years old, SD 0.82 years) beginning weekly
half-hour private keyboard lessons (outside of the school system), and
who continued lessons for a mean interval of 15 months. The “control”
group consisted of 16 children (mean age at start of study 5.90 years old,
SD 0.54 years) who did not receive any instrumental music training
during this 15 month period, but did participate in a weekly 40 min
group music class in school consisting of singing and playing with drums
and bells. The instrumental and control children were all right handed
and matched as closely as possible in gender, age at the start of the study,
and socioeconomic status (SES). SES was defined by parental education
on a six-point scale, with a score of 1, for children whose parents had
some high school education, to a score of 6, for those whose parents had
a doctoral degree (see Norton et al., 2005).
At time 1, all children were tested on a series of behavioral tests (described below), and underwent a magnetic resonance imaging (MRI)
scan (scan 1). At time 2 (15 months later), all children were retested on
the behavioral tests and underwent a second MRI scan (scan 2). The
children whose results are reported here are drawn from a slightly larger
group of instrumental and control children (see Norton et al., 2005).
Here we only report the results from the children who completed both
the behavioral tests and MRI scanning at times 1 and 2. We tested the
hypothesis that brain and behavioral changes after 15 months should be
greater in instrumental than in control children; this time period allows
us to compare our results with those of other studies using a similar
observation period.
Behavioral tests and MRI scanning. Children were tested individually at
times 1 and 2 on measures of handedness and SES, and on two neartransfer measures: a four-finger motor sequencing test for the left and
right hands assessing fine finger motor skills, and a custom-made “melodic and rhythmic discrimination test battery” assessing music listening
and discrimination skills. Five far-transfer measures were also administered: the object assembly, block design, and vocabulary subtests of the
WISC-III (Wechsler, 1991), the Raven’s progressive matrices (colored
progressive matrices and standard progressive matrices) (Raven,
1976a,b), and the auditory analysis test (Rosner and Simon, 1971), assessing phonemic awareness. The vocabulary subtest of the WISC was
used as a proxy for verbal IQ. For a detailed description of these tests and
their administration to this group of children, see Norton et al. (2005)
and Forgeard et al. (2008).
The two musically relevant (near transfer) behavioral tests are described in more detail below, since these were the only tests that showed
significant between group differences after 15 months (see below, Results). Both of these tests are related to musical activity, but can also be
performed by children who do not have any instrumental music training.
In the four-finger motor sequencing test, children pressed a particular
number sequence (e.g., 5-2-4-3-5) corresponding to fingers 2–5 of their
left or right hand on the number keys of a computer keyboard as often,
accurately, and fast as possible over a 30 s period. In the “melodic and
rhythmic discrimination test battery,” children heard pairs of five-tone
musical phrases differing only in melody and pairs of phrases differing
only in rhythm. The task was to indicate whether the two musical phrases
were the same or different. These musical phrases were designed for this
study and have been described in more detail previously (Overy et al.,
2004; Norton et al., 2005; Forgeard et al., 2008). The melodic and rhythmic subtest scores were combined to form one single behavioral measure
of auditory–musical discrimination. Behavioral “difference scores” measuring the difference in performance on the behavioral tests from time 1
to time 2 were calculated and then correlated with the brain deformation
measures.
Anatomical MRI scans were obtained for all children on a 3T General
Electric MRI scanner using a T1-weighted, magnetization-prepared
gradient-echo volume acquisition with a voxel resolution of 0.93 ϫ
0.93 ϫ 1.5 mm. This research was approved by the ethics committees of
the Beth Israel Deaconess Medical Center. Written informed consent was
obtained from the parents of all the children, and the children themselves
gave assent to participate in this study.
Brain deformation-based morphometry analyses. Automated deformation brain analyses were performed on the T1 MRI data for each child
(see supplemental Fig. 1, available at www.jneurosci.org as supplemental
material). All MRI scans were first nonuniformity corrected (Sled et al.,
1998), and registered to MNI space with a nine-parameter linear transform using mni_autoreg tools (Collins et al., 1994; Robbins et al., 2004).
Next, brain deformation measures in terms of the Jacobian determinants
(yielding a measure of relative voxel expansion or contraction) were
calculated so that we could perform three different statistical analyses.
First, to test for any brain deformation differences at baseline (before
musical training), for each group, all time 1 MRI scans (0 months) iteratively underwent nonlinear registration toward the previous group average (starting with the linear group average). The Jacobian determinants
of the final nonlinear registration were computed and blurred with a 10
mm Gaussian kernel. Statistical analyses were then performed comparing the Jacobian determinant data between groups at baseline, at each
voxel. Second, to test for brain deformation differences between groups
over time, each child’s time 1 scan (at 0 months) was nonlinearly aligned
to his or her time 2 scan (15 months later). The resulting displacement
field was blurred with a 10 mm Gaussian kernel and the Jacobian determinant of the blurred displacement field was computed. Statistical analyses were then performed comparing the longitudinal Jacobian determinant data between groups, at each voxel. Third, to test for a brain–
behavioral relationship, brain deformation differences (Jacobian
determinants of scan 2 Ϫ scan 1 as above) were regressed on the behavioral difference scores (difference in test performance time 1 to time 2),
for each subject, at each voxel. Last we checked for T1-weighted intensity
differences between groups. All scans were intensity normalized, each
subject’s time 1 scan was subtracted from their time 2 scan, and the
resulting intensity differences were compared between groups in a linear
model.
The general linear model was used in the group statistical analyses with
age at time 1, gender, and SES entered as covariates. The results from the
group comparison were thresholded using random field theory cluster
thresholding (Friston et al., 1994; Worsley et al., 2004), with a p Ͻ 0.05
cluster corresponding to at least 904 connected voxels with an uncorrected p Ͻ 0.001, or at an a priori cluster threshold of p Ͻ 0.1 (at least 240
connected voxels at an uncorrected p Ͻ 0.001) for strongly predicted
regions that were not significant at the whole-brain threshold. The significant brain deformation differences from the group comparison were
then used to define a volume of interest in which to test for brain–
behavior correlations with the scores on the motor and auditory–musical
tests. The results from this volume of interest were thresholded using the
false discovery rate theory (Genovese et al., 2002) at q ϭ 0.05.
Results
Behavioral changes
An initial 2 analysis showed no significant difference between
the instrumental and control groups in gender distribution ( p Ͼ
0.1). Initial ANOVAs showed no significant difference between
the groups in vocabulary scores at baseline ( p Ͼ 0.1), replicating
the results initially reported in Norton et al. (2005). There was a
significant difference between groups in SES, with the instrumen-
3. Hyde et al. • Musical Brain Development
tal group (mean 5.1 points, SD 0.63) having a higher average SES
than the control group (mean 4.47 points, SD 0.87). The two
groups also differed slightly in age at baseline (time 1), with the
instrumental group (mean 6.32 years, SD 0.82) ϳ5 months older
than the control group (mean 5.90 years, SD 0.54). Although this
age difference only approached significance ( p ϭ 0.1), we chose
to be conservative and covaried age along with SES in our subsequent analyses.
A multiple analysis of covariance (MANCOVA), covarying
age and SES, was conducted to determine that there were no
preexisting group differences at time 1 on either near- or fartransfer outcomes. Missing values were replaced by the series’
mean (2.42% of all values). The MANCOVA revealed no significant overall difference between groups (Wilks’ ϭ 0.85, F(8,20)
ϭ 0.44, p ϭ 0.88). Follow-up univariate tests also indicated that
the two groups did not differ significantly on any of the outcomes
(all p Ͼ 0.1). Furthermore, the groups did not differ significantly
in interval length (in months) between baseline (time 1) and time
2 testing ( p Ͼ 0.1)
To determine whether the instrumental group progressed
more than the control group on any of the outcomes between
times 1 and 2, another MANCOVA was performed using the
behavioral difference scores (performance difference from time 1
to 2) as our dependent variable, and age at baseline and SES as our
covariates. Missing values were replaced by the series’ mean (for
6.85% of all values). As predicted, there was a significant overall
difference in the behavioral difference scores between the two
groups (Wilks’ ϭ 0.50, F(8,20) ϭ 2.55, p ϭ 0.04, partial 2 ϭ
0.51). Univariate tests revealed differences in the two neartransfer outcomes (motor and melody/rhythm tests) but not in
any far-transfer outcomes.
On the finger motor sequencing test, the instrumental group
significantly outperformed the control group in terms of the
right-hand motor performance improvement over time (F(1,27)
ϭ 7.25, p ϭ 0.01, partial 2 ϭ 0.21), and the difference between
groups approached significance for the left hand (F(1,27) ϭ 3.81,
p ϭ 0.06, partial 2 ϭ 0.12). The instrumental group also significantly outperformed the control group in improvement on the
custom-made melodic/rhythmic discrimination test battery
(F(1,27) ϭ 13.20, p Ͻ 0.01, partial 2 ϭ 0.33). No between-group
differences in improvement over time (time 1 to 2) were found
for the far-transfer measures of block design, vocabulary, object
assembly, Raven’s progressive matrices, and auditory analysis (all
p Ͼ 0.1).
Brain deformation changes
With regard to between-group brain differences, we did not see
any differences between groups at time 1. In terms of brain deformation changes in typical development that occurred in our
controls (n ϭ 15) over the 15 month period, brain deformations
were found in frontal, temporal, and parieto-occipital brain areas
(supplemental Fig. 2, available at www.jneurosci.org as supplemental material). In terms of between-group differences between
the two time points, instrumental children showed significantly
different brain deformation changes over the 15 months (time 2
scan at 15 months minus time 1 scan at 0 months) compared with
controls (see Table 2 for all significant results). Instrumental children showed areas of greater relative voxel size than those of
controls in motor areas, such as the right precentral gyrus (motor
hand area) (Fig. 1a), and the corpus callosum (fourth and fifth
segment/midbody) (Fig. 2a), that were significant at a wholebrain cluster threshold at p Ͻ 0.05, as well as in a right primary
auditory region (lateral aspect of Heschl’s gyrus) (Fig. 3a) that
J. Neurosci., March 11, 2009 • 29(10):3019 –3025 • 3021
Table 2. Significant between-group longitudinal brain deformation differences
Brain area
Relative voxel size increases
Corpus callosum
Left middle frontal gyrus
Left superior frontal gyrus
Right middle frontal gyrus
Left pericingulate
Right superior frontal gyrus
Left superior frontal gyrus
Right primary motor (precentral
gyrus)
Bilateral medial frontal gyrus
Right middle frontal gyrus
Right primary auditory (Heschl’s
gyrus)
Relative voxel size decreases
Left middle occipital gyrus
Number of
voxels in cluster
RFT cluster
p value
Brodmann
area
4744
3145
2177
2152
2094
1575
1394
1250
0.0000
0.0001
0.0011
0.0012
0.0014
0.0057
0.0097
0.0152, *0.0014
6
8
10
31
10
9
6
1217
940
293
0.0170
0.0434
0.5458, *0.0717
10
11
41
1095
0.0024
37
All results are significant with whole-brain random field theory (RFT) cluster thresholding at p Ͻ 0.05, with the
exception of results with *, which are significant at an a priori cluster threshold of p Ͻ 0.1 for strongly predicted
regions.
was significant at an a priori cluster threshold at p Ͻ 0.1. Some
significant brain deformation differences were also found outside
auditory and motor brain areas. Instrumental children showed
areas of greater relative voxel size than those of controls in bilateral frontolateral and frontomesial regions and a left posterior
pericingulate region. In comparison, instrumental children
showed only one area of lesser relative voxel size than that of
controls in the left middle occipital gyrus. Last, no differences in
normalized MR intensities were found between the two groups.
Correlations between brain and behavioral changes
Brain deformation changes in motor-related brain areas, including the right precentral gyrus and the corpus callosum, were predicted by left-hand motor test improvement scores. To illustrate
the relationship between brain morphometry and behavior, we
plotted the longitudinal brain deformation change over 15
months (in terms of relative voxel size) for each child as a function of his or her behavioral difference score on the left-hand
motor sequencing test at the most significant (peak) voxel in the
right precentral gyrus and the corpus callosum. The relative voxel
size significantly increased with increasing left-hand motor improvement score at peak voxels in the right precentral gyrus (Fig.
1b) and the corpus callosum (Fig. 2b), but not in the right primary auditory region. Brain deformation changes in the right
auditory area (Fig. 3b) were predicted by improvements on the
melodic/rhythmic discrimination test. However, brain deformation changes in the right primary motor region were not predicted by improvements on the melodic/rhythmic discrimination test battery, and brain deformation changes in the right
primary auditory region were not predicted by motor improvement scores. No other significant correlations were found between brain deformations and either near or far-transfer behavioral measures.
Discussion
In the present study, we demonstrate regional structural brain
plasticity in the developing brain that occurred with only 15
months of instrumental musical training in early childhood.
Structural brain changes in motor and auditory areas (of critical
importance for instrumental music training) were correlated
with behavioral improvements on motor and auditory–musical
4. 3022 • J. Neurosci., March 11, 2009 • 29(10):3019 –3025
Hyde et al. • Musical Brain Development
tests. This study is the first longitudinal investigation to directly correlate brain
structure and behavioral changes over
time in the developing brain.
The lack of brain and behavioral differences between the instrumental and control children at baseline (before any music
training) is consistent with previous findings from a larger sample that included the
present subset of children tested here
(Norton et al., 2005). It is not possible
from these findings to completely rule out
that musicians may be born with preexisting biological predictors of musicality or
that some children may have a certain genetically determined trajectory of cerebral
development that may lead them to more
likely continue to practice music relative to
other children without this same predisposition. However, our findings do support the view that brain differences seen in
adult musicians relative to nonmusicians
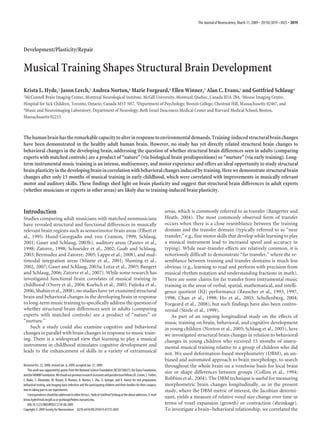
are more likely to be the product of intensive music training (Norton et al., 2005; Figure 1. Longitudinal group brain deformation differences and brain– behavioral correlations in primary motor area. The
Schlaug et al., 2005). Children who played brain image (a horizontal slice) shows areas of significant difference in relative voxel size over 15 months in instrumental (n ϭ 15)
and practiced a musical instrument versus control (n ϭ 16) children in terms of a t-statistical color map of the significant clusters superimposed on an average MR
showed greater improvements in motor image of all children (n ϭ 31). The yellow arrow points to the primary motor area (right precentral gyrus). To illustrate the group
ability (as measured by finger dexterity in differences, the relative voxel size (expressed as the mean by the horizontal dark black line, 25% and 75% quartiles by the top and
both left and right hands) and in auditory bottom lines of the box, SDs by the errors bars, and outliers by circles) is plotted for each group at the most significant (peak) voxel
melodic and rhythmic discrimination in the right precentral gyrus (x ϭ 40, y ϭ Ϫ7, z ϭ 57; t ϭ 4.2, p Ͻ 0.05 at whole-brain cluster threshold) (a). A voxel with a
skills. Contrary to previous findings, how- relative voxel size of 1 indicates no brain deformation change from time 1, values Ͼ1 indicate voxel expansion, and values Ͻ1
ever (Chan et al., 1998; Vaughn, 2000; Ho indicate voxel contraction. For example, a value of 1.1 at voxel X indicates a 10% expansion from time 1, whereas 0.9 indicates a
et al., 2003; Schellenberg, 2004; Rauscher 10% contraction (this also applies to Figs. 2, 3). The significant positive correlation of relative voxel size with behavioral difference
scores (from time 1 to time 2) of each child on the left-hand motor test that was found at the peak voxel in the right precentral
et al., 1997, 2000), children who studied an gyrus is shown in b.
instrument for 15 months did not show
superior progress in visual–spatial and
Wilke, 2002; Lee et al., 2003). Although the right auditory cluster
verbal transfer domain outcomes than children who did not rewas not significant at a whole-brain level, this result was strongly
ceive instrumental training. We propose three reasons why 15
predicted on the basis of findings of previous structural brain
months of instrumental music training may not have been suffidifferences in right auditory cortex in adult musicians (Schneider
cient to result in far transfer: (1) 15 months of instrumental leset al., 2002; Gaser and Schlaug, 2003b; Bermudez and Zatorre,
sons may be too short a period of time (duration explanation);
2005). Thus, we report this right primary auditory region at an a
(2) children in our instrumental group may have practiced too
priori threshold.
little (intensity explanation); or (3) a larger sample may be reThe brain– behavioral correlations found here in motor and
quired to demonstrate far transfer (power explanation).
auditory brain regions for performance on motor and auditory
The brain deformations found over 15 months in our controls
(melodic/rhythmic) tests show that different motor and auditory
(see supplemental Fig. 2, available at www.jneurosci.org as supbehavioral functions (both musically relevant) appear to be drivplemental material) are consistent with previous findings in noring the group differences in separate predicted brain regions.
mal development that have included similar age ranges (from 5 to
These results are important from a functional perspective since
7 years old) (e.g., Sowell et al., 2004). The consistency of the brain
these brain regions are known to be of critical importance in
deformation found here in our controls with other studies of
instrumental music performance and auditory processing. For
typical brain development in frontal, temporal, and parietoexample, the primary motor area plays a critical role in motor
occipital brain areas strengthens our conclusions that the brain
planning, execution, and control of bimanual sequential finger
deformations observed here between instrumental and control
movements as well as motor learning (Karni et al., 1995; Grodd et
children are due to musical training. The present findings of
al., 2001). The correlation found between the brain deformation
structural brain changes in response to 15 months of instrumenmeasures and the motor test at the corpus callosum is consistent
tal music training are consistent with previous findings of
with the fact that the peak voxel lies in the fourth and fifth segtraining-induced structural brain differences in adults in various
ments of the corpus callosum (Witelson, 1989) (also called midcontexts (Draganski et al., 2004; Draganski and May, 2008). More
body), which contains fibers connecting primary sensorimotor
specifically, the brain deformation differences found in primary
cortex (Wahl et al., 2007). Moreover, it has been suggested that
motor brain regions are consistent with structural brain differintense bimanual motor training of musicians could play an imences found between adult musicians and nonmusicians in the
portant role in the determination of callosal fiber composition
precentral gyri (Gaser and Schlaug, 2003b) and the corpus calloand size (Schlaug et al., 1995). Last, the correlation found besum (Schlaug et al., 1995; Ozturk et al., 2002; Schmithorst and
¨
5. Hyde et al. • Musical Brain Development
Figure 2. Longitudinal group brain deformation differences and brain– behavioral correlations in the corpus callosum. The
brain image (a sagittal slice) shows areas of significant difference in relative voxel size over 15 months in instrumental (n ϭ 15)
versus control (n ϭ 16) children in terms of a t-statistical color map of the significant clusters superimposed on an average MR
image of all children (n ϭ 31). The yellow arrow points to the corpus callosum. To illustrate the group differences, the relative
voxel size is plotted for each group at the most significant (peak) voxel in the corpus callosum (x ϭ 14, y ϭ Ϫ24, z ϭ 30; t ϭ 5.2,
p Ͻ 0.05 at whole-brain cluster threshold) (a). The significant positive correlation of relative voxel size with behavioral difference
scores (from time 1 to time 2) of each child is shown for the left-hand motor test at the peak voxel in the corpus callosum (b).
Figure 3. Longitudinal group brain deformation differences and brain– behavioral correlations in right primary auditory area.
The brain image (a horizontal slice) shows areas of significant difference in relative voxel size over 15 months in instrumental (n ϭ
15) versus control (n ϭ 16) children in terms of a t-statistical color map of the significant clusters superimposed on an average MR
image of all children (n ϭ 31). The yellow arrow points to the right primary auditory region (lateral aspect of Heschl’s gyrus). To
illustrate the group differences, the relative voxel size is plotted for each group at the most significant (peak) voxel in the right
primary auditory region (x ϭ 55, y ϭ Ϫ8, z ϭ 10; t ϭ 4.9, p Ͻ 0.1 at a priori cluster threshold) (a). The significant positive
correlations of relative voxel size with behavioral difference scores (from time 1 to time 2) of each child is shown for the melody/
rhythm test at the peak voxel in the right primary auditory area (b).
J. Neurosci., March 11, 2009 • 29(10):3019 –3025 • 3023
tween the brain deformation measures
and the melody/rhythmic test battery in
the right primary auditory region is consistent with functional brain mapping
studies that have found activity changes
using auditory–musical tests in similar auditory regions (Zatorre et al., 2002).
While structural brain differences were
expected in motor and auditory brain areas, unexpected significant brain deformation differences were also found in various
frontal areas, the left posterior pericingulate, and a left middle occipital region.
However, none of these unexpected deformation changes were correlated with motor or auditory test performance changes.
While we do not currently have an interpretation for some of these unexpected
brain findings since they did not correlate
with the auditory and motor behaviors,
the left posterior pericingulate region warrants additional discussion since it showed
a highly significant deformation difference. This region lies in the vicinity of
Brodmann area 31 in the transition between posterior cingulate and occipital
cortex and is involved in the integration of
sensory (mostly visual) information and
the limbic system. Such integration is involved in learning to read musical notation and relating music to its emotional
content. The relative voxel size increases in
frontomesial regions also stand out, although no obvious relationship with
changes in motor and auditory performance was seen in these regions. Overall,
these findings indicate that plasticity can
occur in brain regions that control primary functions important for playing a
musical instrument, and also in brain regions that might be responsible for the
kind of multimodal sensorimotor integration likely to underlie the instrumental
learning. None of the unexpected brain
deformation differences mentioned above
were correlated with behavioral performance changes in any of the far-transfer
domains. This may indicate that brain
structural changes in association areas and
multimodal integration regions may develop before the emergence of significant
behavioral/cognitive changes in fartransfer domains.
While we have discussed the functional
significance of the brain– behavioral structural changes, the underlying structural
properties of the results are not trivial to
explain. The brain deformation techniques used here are key to localize brain
size/shape changes over time, but are not
able to inform us on the microstructural
nature of these changes. Overall, instrumental children showed greater relative
6. 3024 • J. Neurosci., March 11, 2009 • 29(10):3019 –3025
voxel size expansion than controls over the 15 months, and only
one area of voxel size contraction. A voxel expansion or contraction may reflect increased or decreased gray or white matter due
to neural reorganization/pruning or increased/decreased brain
connectivity. Evidence from animal models investigating the effects of long-term learning and practice of complex motor skills
(Anderson et al., 2002) on brain structure may shed light on the
structural neural basis of the brain structural changes seen here.
Several groups have demonstrated microstructural brain changes
as a function of long-term motor learning, including an increased
number of synapses and glial cells, increased density of capillaries
in primary motor cortex and cerebellum, and new brain cells in
the hippocampus after long-term motor training in adult rats
(Black et al., 1990; Isaacs et al., 1992; Anderson et al., 1994; Kleim
et al., 1996; Kempermann et al., 1997; Anderson et al., 2002). The
sum of these microstructural changes could amount to structural
differences that are detectable on a macrostructural level, such as
those observed in the present study (Anderson et al., 2002;
Bangert and Schlaug, 2006). It is possible that the specific and
continuous engagement of a unimodal and multimodal sensorimotor network, and the induced changes in this network across a
musician’s career, may provide the neural basis for some of the
sensorimotor and cognitive enhancements attributed to musical
training. Future, even higher-resolution morphometric investigations with more direct measures of gray and white matter will
be key to developing a better understanding of the underlying
nature of the brain deformation differences found here. We also
did not find any differences in MR intensities between groups,
though using T1-weighted sequences is clearly a limitation in this
regard. Future studies should examine quantitative sequences,
such as diffusion tensor imaging, magnetization transfer, etc., in
more detail to see whether microstructural changes can be captured separately from the volumetric differences described
herein. Last, we wish to point out that one of the potential confounds of deformation-based morphometry is that the deformation procedure can sometimes result in changes being propagated to regions distant from their actual origin. Given that the
present results were predicted based on the functional literature,
we feel it is unlikely that such propagation accounts for the results
presented in this manuscript. In the future, converging results
from additional structural and functional analyses metrics will
serve to strengthen our conclusions.
In summary, our findings show for the first time that musical
training over only 15 months in early childhood leads to structural brain changes that diverge from typical brain development.
Regional training-induced structural brain changes were found
in musically relevant regions that were driven by musically relevant behavioral tests. The fact there were no structural brain
differences found between groups before the onset of musical
training indicates that the differential development of these brain
regions is induced by instrumental practice rather by than preexisting biological predictors of musicality. These results provide
new evidence for training-induced structural brain plasticity in
early childhood. These findings of structural plasticity in the
young brain suggest that long-term intervention programs can
facilitate neuroplasticity in children. Such an intervention could
be of particular relevance to children with developmental disorders and to adults with neurological diseases.
References
Anderson BJ, Li X, Alcantara AA, Isaacs KR, Black JE, Greenough WT (1994)
Glial hypertrophy is associated with synaptogenesis following motor-skill
learning, but not with angiogenesis following exercise. Glia 11:73– 80.
Hyde et al. • Musical Brain Development
Anderson BJ, Eckburg PB, Relucio KI (2002) Alterations in the thickness of
motor cortical subregions after motor-skill learning and exercise. Learn
Mem 9:1–9.
Bangert M, Schlaug G (2006) Specialization of the specialized in features of
external human brain morphology. Eur J Neurosci 24:1832–1834.
Bangerter A, Heath C (2004) The Mozart effect: tracking the evolution of a
scientific legend. Br J Soc Psychol 43:605– 623.
Bermudez P, Zatorre RJ (2005) Differences in gray matter between musicians and nonmusicians. Ann N Y Acad Sci 1060:395–399.
Black JE, Isaacs KR, Anderson BJ, Alcantara AA, Greenough WT (1990)
Learning causes synaptogenesis, whereas motor activity causes angiogenesis, in cerebellar cortex of adult rats. Proc Natl Acad Sci U S A
87:5568 –5572.
Chan AS, Ho YC, Cheung MC (1998) Music training improves verbal memory. Nature 396:128.
Collins DL, Neelin P, Peters TM, Evans AC (1994) Automatic 3D intersubject registration of MR volumetric data in standardized Talairach space.
J Comput Assist Tomogr 18:192–205.
Draganski B, May A (2008) Training-induced structural changes in the
adult human brain. Behav Brain Res 192:137–142.
Draganski B, Gaser C, Busch V, Schuierer G, Bogdahn U, May A (2004)
Neuroplasticity: changes in grey matter induced by training. Nature
427:311–312.
Elbert T, Pantev C, Wienbruch C, Rockstroh B, Taub E (1995) Increased
cortical representation of the fingers of the left hand in string players.
Science 270:305–307.
Forgeard M, Winner E, Norton A, Schlaug G (2008) Practicing a musical
instrument in childhood is associated with enhanced verbal ability and
nonverbal reasoning. PLoS One 3:e3566.
Friston KJ, Worsley KJ, Frackowiak RSJ, Mazziotta JC, Evans AC (1994)
Assessing the significance of focal activations using their spatial extent.
Hum Brain Mapp 1:210 –220.
Fujioka T, Ross B, Kakigi R, Pantev C, Trainor LJ (2006) One year of musical
training affects development of auditory cortical-evoked fields in young
children. Brain 129:2593–2608.
Gaab N, Schlaug G (2003) Musicians differ from nonmusicians in brain
activation despite performance matching. Ann N Y Acad Sci
999:385–388.
Gaser C, Schlaug G (2003a) Brain structures differ between musicians and
non-musicians. J Neurosci 23:9240 –9245.
Gaser C, Schlaug G (2003b) Gray matter differences between musicians and
nonmusicians. Ann N Y Acad Sci 999:514 –517.
Genovese CR, Lazar NA, Nichols T (2002) Thresholding of statistical maps
in functional neuroimaging using the false discovery rate. Neuroimage
15:870 – 878.
Grodd W, Hulsmann E, Lotze M, Wildgruber D, Erb M (2001) Sensorimo¨
tor mapping of the human cerebellum: FMRI evidence of somatotopic
organization. Hum Brain Mapp 13:55–73.
Ho YC, Cheung MC, Chan AS (2003) Music training improves verbal but
not visual memory: cross-sectional and longitudinal explorations in children. Neuropsychology 17:439 – 450.
Hund-Georgiadis M, von Cramon DY (1999) Motor-learning-related
changes in piano players and non-musicians revealed by functional
magnetic-resonance signals. Exp Brain Res 125:417– 425.
Isaacs KR, Anderson BJ, Alcantara AA, Black JE, Greenough WT (1992)
Exercise and the brain: angiogenesis in the adult rat cerebellum after
vigorous physical activity and motor skill learning. J Cereb Blood Flow
Metab 12:110 –119.
Karni A, Meyer G, Jezzard P, Adams MM, Turner R, Ungerleider LG (1995)
Functional MRI evidence for adult motor cortex plasticity during motor
skill learning. Nature 377:155–158.
Kempermann G, Kuhn HG, Gage FH (1997) More hippocampal neurons in
adult mice living in an enriched environment. Nature 386:493– 495.
Kleim JA, Lussnig E, Schwarz ER, Comery TA, Greenough WT (1996) Synaptogenesis and Fos expression in the motor cortex of the adult rat after
motor skill learning. J Neurosci 16:4529 – 4535.
Koelsch S, Fritz T, Schulze K, Alsop D, Schlaug G (2005) Adults and children processing music: an fMRI study. Neuroimage 25:1068 –1076.
Lappe C, Herholz SC, Trainor LJ, Pantev C (2008) Cortical plasticity induced by short-term unimodal and multimodal musical training. J Neurosci 28:9632–9639.
7. Hyde et al. • Musical Brain Development
Lee DJ, Chen Y, Schlaug G (2003) Corpus callosum: musician and gender
effects. Neuroreport 14:205–209.
Lotze M, Scheler G, Tan HR, Braun C, Birbaumer N (2003) The musician’s
brain: functional imaging of amateurs and professionals during performance and imagery. Neuroimage 20:1817–1829.
Munte TF, Kohlmetz C, Nager W, Altenmuller E (2001) Neuroperception.
¨
¨
Superior auditory spatial tuning in conductors. Nature 409:580.
Norton A, Winner E, Cronin K, Overy K, Lee DJ, Schlaug G (2005) Are there
pre-existing neural, cognitive, or motoric markers for musical ability?
Brain Cogn 59:124 –134.
Overy K, Norton AC, Cronin KT, Gaab N, Alsop DC, Winner E, Schlaug G
(2004) Imaging melody and rhythm processing in young children. Neuroreport 15:1723–1726.
Ozturk AH, Tascioglu B, Aktekin M, Kurtoglu Z, Erden I (2002) Morpho¨
¸
metric comparison of the human corpus callosum in professional musicians and non-musicians by using in vivo magnetic resonance imaging.
J Neuroradiol 29:29 –34.
Pantev C, Oostenveld R, Engelien A, Ross B, Roberts LE, Hoke M (1998)
Increased auditory cortical representation in musicians. Nature
392:811– 814.
Rauscher FH, Shaw GL, Ky KN (1993) Music and spatial task performance.
Nature 365:611.
Rauscher FH, Shaw GL, Levine LJ, Wright EL, Dennis WR, Newcomb RL
(1997) Music training causes long-term enhancement of preschool children’s spatial-temporal reasoning. Neurol Res 19:2– 8.
Rauscher FH, Robinson KD, Jens JJ (1998) Improved maze learning
through early music exposure in rats. Neurol Res 20:427– 432.
Raven JC (1976a) Coloured progressive matrices. Oxford: Oxford
Psychologists.
Raven JC (1976b) Standard progressive matrices. Oxford: Oxford
Psychologists.
Robbins S, Evans AC, Collins DL, Whitesides S (2004) Tuning and comparing spatial normalization methods. Med Image Anal 8:311–323.
Rosner J, Simon D (1971) Test of auditory analysis skill, TAAS. J Learn
Disabil 4:40 – 48.
Schellenberg EG (2004) Music lessons enhance IQ. Psychol Sci 15:511–514.
Schlaug G (2001) The brain of musicians. A model for functional and structural adaptation. Ann N Y Acad Sci 930:281–299.
Schlaug G, Jancke L, Huang Y, Staiger JF, Steinmetz H (1995) Increased
¨
corpus callosum size in musicians. Neuropsychologia 33:1047–1055.
Schlaug G, Norton A, Overy K, Winner E (2005) Effects of music training on
the child’s brain and cognitive development. Ann N Y Acad Sci
1060:219 –230.
Schmithorst VJ, Wilke M (2002) Differences in white matter architecture
J. Neurosci., March 11, 2009 • 29(10):3019 –3025 • 3025
between musicians and non-musicians: a diffusion tensor imaging study.
Neurosci Lett 321:57– 60.
Schneider P, Scherg M, Dosch HG, Specht HJ, Gutschalk A, Rupp A (2002)
Morphology of Heschl’s gyrus reflects enhanced activation in the auditory
cortex of musicians. Nat Neurosci 5:688 – 694.
Shahin AJ, Roberts LE, Chau W, Trainor LJ, Miller LM (2008) Music training leads to the development of timbre-specific gamma band activity.
Neuroimage 41:113–122.
Sled JG, Zijdenbos AP, Evans AC (1998) A nonparametric method for automatic correction of intensity nonuniformity in MRI data. IEEE Trans
Med Imaging 17:87–97.
Sluming V, Barrick T, Howard M, Cezayirli E, Mayes A, Roberts N (2002)
Voxel-based morphometry reveals increased gray matter density in Broca’s area in male symphony orchestra musicians. Neuroimage
17:1613–1622.
Sluming V, Brooks J, Howard M, Downes JJ, Roberts N (2007) Broca’s area
supports enhanced visuospatial cognition in orchestral musicians. J Neurosci 27:3799 –3806.
Sowell ER, Thompson PM, Leonard CM, Welcome SE, Kan E, Toga AW
(2004) Longitudinal mapping of cortical thickness and brain growth in
normal children. J Neurosci 24:8223– 8231.
Steele KM, Brown JD, Stoecker JA (1999) Failure to confirm the Rauscher
and Shaw description of recovery of the Mozart effect. Percept Mot Skills
88:843– 848.
Vaughn K (2000) Music and mathematics: modest support for the oftclaimed relationship. J Aesthet Educ 34:149 –166.
Wahl M, Lauterbach-Soon B, Hattingen E, Jung P, Singer O, Volz S, Klein JC,
Steinmetz H, Ziemann U (2007) Human motor corpus callosum: topography, somatotopy, and link between microstructure and function.
J Neurosci 27:12132–12138.
Wechsler D (1991) WISC-III Wechsler Intelligence Scale for Children—
third edition: manual. San Antonio, TX: The Psychological Corporation.
Witelson SF (1989) Hand and sex differences in the isthmus and genu of the
human corpus callosum. A postmortem morphological study. Brain
112:799 – 835.
Worsley KJ, Taylor JE, Tomaiuolo F, Lerch J (2004) Unified univariate and
multivariate random field theory. Neuroimage 23[Suppl 1]:S189 –S195.
Zatorre RJ (1998) Functional specialization of human auditory cortex for
musical processing. Brain 121:1817–1818.
Zatorre RJ, Belin P, Penhune VB (2002) Structure and function of auditory
cortex: music and speech. Trends Cogn Sci 6:37– 46.
Zatorre RJ, Chen JL, Penhune VB (2007) When the brain plays music:
auditory-motor interactions in music perception and production. Nat
Rev Neurosci 8:547–558.