Vapor Deposition of Semiconducting P Allotropes into TiO2 Nanotube Arrays for Photo-Electrocatalytic Water Splitting

Recent evidence of exponential environmental degradation will demand a drastic shift in research and development toward exploiting alternative energy resources such as solar energy. Here, we report the successful low-cost and easily accessible synthesis of hybrid semiconductor@TiO2 nanotube photocatalysts. In order to realize its maximum potential in harvesting photons in the visible-light range, TiO2 nanotubes have been loaded with earth-abundant, low-band-gap fibrous red and black phosphorus (P). Scanning electron microscopy– and scanning transmission electron microscopy–energy-dispersive X-ray spectroscopy, X-ray diffraction, Raman spectroscopy, X-ray photoelectron microscopy, and UV–vis measurements have been performed, substantiating the deposition of fibrous red and black P on top and inside the cavities of 100-μm-long electrochemically fabricated nanotubes. The nanotubular morphology of titania and a vapor-transport technique are utilized to form heterojunctions of P and TiO2. Compared to pristine anatase 3.2 eV TiO2 nanotubes, the creation of heterojunctions in the hybrid material resulted in 1.5–2.1 eV photoelectrocatalysts. An enhanced photoelectrochemical water-splitting performance under visible light compared with the individual components resulted for the P@TiO2 hybrids. This feature is due to synergistically improved charge separation in the heterojunction and more effective visible-light absorption. The electronic band structure and charge-carrier dynamics are investigated in detail using ultraviolet photoelectron spectroscopy and Kelvin probe force microscopy to elucidate the charge-separation mechanism. A Fermi-level alignment in P@TiO2 heterojunctions leads to a more reductive flat-band potential and a deeper valence band compared to pristine P and thus facilitates a better water-splitting performance. Our results demonstrate effective conversion efficiencies for the nanostructured hybrids, which may enable future applications in optoelectronic applications such as photodetectors, photovoltaics, photoelectrochemical catalysts, and sensors.

Recommended
Recommended
More Related Content
What's hot
What's hot (20)
Similar to Vapor Deposition of Semiconducting P Allotropes into TiO2 Nanotube Arrays for Photo-Electrocatalytic Water Splitting
Similar to Vapor Deposition of Semiconducting P Allotropes into TiO2 Nanotube Arrays for Photo-Electrocatalytic Water Splitting (20)
More from Pawan Kumar
More from Pawan Kumar (20)
Recently uploaded
Recently uploaded (20)
Vapor Deposition of Semiconducting P Allotropes into TiO2 Nanotube Arrays for Photo-Electrocatalytic Water Splitting
- 1. Vapor Deposition of Semiconducting Phosphorus Allotropes into TiO2 Nanotube Arrays for Photoelectrocatalytic Water Splitting Ebru Üzer,a Pawan Kumar,b† Ryan Kisslinger,b† Piyush Kar,b Ujwal Kumar Thakur,b Sheng Zeng,b Karthik Shankar, b,* and Tom Nilges a,* Published in: ACS Appl. Nano Mater.2019 https://doi.org/10.1021/acsanm.9b00221
- 2. Figure 1. (a) Fibrous P (purple pellet) reacted onto and into TiO2nanotube membranes (pink). Representative SEM pictures of the electrochemically prepared TiO2 nanotube membranes used in a mineralizer-driven short-way transport reaction along the (b) bottom, (c) top, and (d) normal side views.
- 3. Figure 2. (a) Crystal structure of fibrous red P. (b) TiO2 nanotube membrane covered with fibrous red P after reaction via gas phase. (c and d) SEM images of the cross section and surface of fibrous P@TiO2 nanotube membranes. Fibrous P covers the surface of the membrane. EDS of the cross section shows P all along the nanotubes (Table S1).
- 4. Figure 3. (a) STEM bright-field image of TiO2 nanotubes separated from a membrane by an ultrasonication procedure. (b) Elemental mapping of the overlaid elements Ti, O, and P. (c and d) Ti and O of the TiO2 nanotubes, (e) with P distributed along the full length of the tubes.
- 5. Figure 4. Raman spectroscopy on fibrous red P@TiO2membranes. From the top down: reference Raman spectrum of fibrous red P and spectra of a fibrous red P@TiO2 membrane cross section measured at approximately 5, 15, and 20 μm in distance to the surface (membrane top side) and at approximately 5, 10, and 15 μm in distance to the surface (membrane bottom side) and a blank TiO2 membrane (anatase, brown).
- 6. Figure 5. (a) Crystal structure of black P. (b) TiO2 nanotube membranes with black P needles on the front and back sides after reaction via the gas phase. (c and d) SEM images of the cross section and covered surface of black P@TiO2 nanotube membranes. There is visible horizontal growth along the vertical tube axis between white arrows. EDS of the cross section shows P all along the nanotubes.
- 7. Figure 6. (a) STEM bright-field image of TiO2 nanotubes separated from a membrane by an ultrasonication procedure. (b) Elemental mapping of overlaid elements Ti (representing TiO2), P, Sn, and I. (c) Ti and (d) P substantiating P distributed along the full length of a TiO2 nanotube, with (e) Sn and (f) I coming from the mineralizer only present in small amounts.
- 8. Figure 7. Raman spectroscopy on black P@TiO2 membranes. From the top down: reference Raman spectrum of black P, spectra of a black P@TiO2 membrane cross section measured at the surface and approximately 3, 5, and 7 μm in distance to the surface (membrane top side), and a fresh TiO2 membrane (anatase, brown).
- 9. Figure 8. (a and b) Linear-sweep voltammograms of TiO2, fibrous red P, fibrous red P@TiO2, black P, and black P@TiO2, under dark conditions and 1 solar simulated AM1.5 G light irradiation (100 mW cm–2) showing the photoresponse during on–off and (c) standard mode cycling. (d) ABPE % versus RHE plot under AM1.5 G light irradiation (100 mW cm–2). Color code: TiO2 under dark conditions, black; TiO2 under AM1.5 G light irradiation, grey; fibrous red P, red; fibrous red P@TiO2, brown; black P, blue; black P@TiO2, light blue.
- 10. Figure 9. UPS WF spectra of (a) TiO2 and fibrous red P@TiO2 and (c) TiO2 and black P@TiO2. Inset: Ecutoff. The value of the WF was determined from the UPS WF spectra by using the equation WF(Φ) = 21.21 – Ecutoff, where 21.21 eV is the energy of the incident He I line of a He discharge lamp used for UPS. UPS VB spectra of (b) fibrous red P and fibrous red P@TiO2 and (d) black P and black P@TiO2 Color code: TiO2, black; fibrous red P, red; fibrous red P@TiO2, purple; black P, blue; black P@TiO2, light blue.
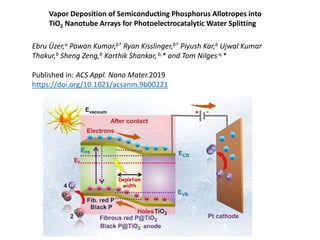
- 11. Figure 10. Energy-level diagrams illustrating a plausible charge-separation mechanism in P allotrope@TiO2 heterojunctions.
- 12. Scheme S1. Left: Raman microscope focus on a cross section of a membrane used for Raman spectroscopic investigations. Right: Consecutive Raman spectra were recorded along the cross section.
- 13. Figure S1. Powder X-ray diffraction substantiates the formation of crystalline fibrous red phosphorus onto the membrane. A calculated diffractogram based on the structure data of fibrous red phosphorus2 is drawn with negative intensities. Slight variations in intensity are due to texture effects.
- 14. Figure S2. Raman spectroscopy on fibrous red P@TiO2 membranes a) Raman spectra of a fresh TiO2 membrane (anatase, grey), fibrous red P@TiO2 membrane cross section measured approx. 5 mm in distance to the surface (black), fibrous red P(red), recorded at the surface and reference spectrum of fibrous red P (dark red). Raman-microscope picture of the fibrous red P@TiO2 membrane where the Raman spectrum was recorded at the top. b) Raman spectra of a fresh TiO2 membrane (anatase, grey), fibrous red P@TiO2 membrane cross section measured approx. 15 m in distance to the surface (black), fibrous red P (red), recorded at the surface and reference spectrum of fibrous red P (dark red). Raman-microscope images of fibrous red P@TiO2 membranes, recorded during the measurement show the laser path along the cross section.
- 15. Figure S3. Powder X-ray diffraction confirms formation of crystalline black phosphorus onto the membrane. A calculated diffractogram based on the structure data of black phosphorus3 is drawn with negative intensities. Slight variations in intensity are due to texture effects.
- 16. Figure S5. Core level HR-XPS spectra of TiO2 and black P@TiO2 a) in Ti2p region, b) in Ti2p region, c) O1s region and HR-XPS spectra of TiO2 fibrous red P and fibrous red P@TiO2 d) in O1s region, e) in P 2p region, f) in P 2p region.
- 17. Figure S6. XPS elemental survey scan of a) black P, TiO2, black P@TiO2, b) fibrous red P, TiO2, fibrous red P@TiO2, and HR-XPS spectra of black P and black P@TiO2 c) in Sn3d region and d) in I3d region showing presence of Sn and I as mass transporting agents. Color: black P (black), TiO2 (red), black P@TiO2 (blue), fibrous red P (olive), fibrous red P@TiO2 (magenta).
- 18. Figure S7 Photocurrent density vs applied voltage plot for a) TiO2, b) black P@TiO2, b) fibrous red P@TiO2 under dark (black), 420 (blue), 505 (green), 580 (yellow), 620 (red) nm wavelength LEDs (21.00 mW cm-2) and d) IPCE and APCE% TiO2 (black), black P@TiO2 (blue), fibrous red P@TiO2 (red).
- 19. Figure S8. GC chromatogram of photoelectrochemically evolved H2 collected at the Pt counter electrode
- 20. Figure S9. Graph of amount of H2 evolved during PEC measurements (AM1.5 G) and corresponding Faradaic efficiencies.
- 21. Figure S10. GC chromatogram of gaseous sample collected at black P@TiO2 photoanode (a) before photoreaction after purging N2 for 30 min and (b) after 1 h photoreaction under AM1.5 G irradiation
- 22. Figure S11. Photocurrent density vs applied voltage plot at 425 nm wavelength for a) black P b) fibrous red P
- 23. Figure S12. a) Experimental and fitted EIS Nyquist plots of blank TiO2, fibrous red P, fibrous red P@TiO2, black P and black P@TiO2 under AM1.5 G irradiation b) Mott Schottky plots of fibrous red P, fibrous red P@TiO2, black P, black P@TiO2 and blank TiO2. VFB and ND are mentioned within the plot. c) Equivalent circuit of EIS data. Color: TiO2 (black), fibrous red P (red), fibrous red P@TiO2 (brown), black P (blue) and black P@TiO2 (light green).
- 24. Figure S13. Nyquist plots of fibrous red P, fibrous red P@TiO2, black P, black P@TiO2 and blank TiO2 under dark conditions.
- 25. Figure S14. Topographical AFM images and surface potential map of a) TiO2 nanotubes, b) black P, c) fibrous red P, d) black P@TiO2, e) fibrous red P@TiO2 under dark, 450 and 635 nm illumination conditions and e) surface potential distribution of bare TiO2 nanotubes, black P, fibrous red P, black P@TiO2, fibrous red P@TiO2, samples deposited on FTO under dark (black), 450 nm (red) and 635 nm (green) illumination condition.
- 26. Figure S15. XPS valence band spectra of TiO2. The point of intersection display position of valence band maxima (VBmax) below Fermi level.
- 27. Figure S16. Photograph of photoelectrochemical water splitting cell irradiated under 505 nm LED.