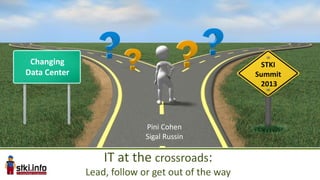
Changing Data Center Summit 2013: IT at the crossroads: Lead, follow or get out of the way
•
0 j'aime•10,593 vues

This presentations gives high level overview of : networking, security, storage, end point devices (PC), Servers, Enterprise System Management and Development and SOA\integration domains. It includes staffing ratios, vendor and integrator positioning in Israel.

Recommandé
Contenu connexe
En vedette
En vedette (18)
Plus de Pini Cohen
Plus de Pini Cohen (20)
Dernier
Dernier (20)
Changing Data Center Summit 2013: IT at the crossroads: Lead, follow or get out of the way
- 1. Changing STKI Data Center Summit 2013 Pini Cohen Sigal Russin IT at the crossroads: Lead, follow or get out of the way
- 2. Agenda Technology Mega Trends Domain Trends Pini Cohen and Sigal Russin's work Copyright@2013 Do not remove source or 2 attribution from any slide, graph or portion of graph 2
- 3. We will present data on products and vendors 1. Israeli vendors rating – state of the current market focused on the enterprise market (not SMB) X – Market penetration (sales + installed base+ clients perspective) Y – is X plus localization, support, development center, number and kind of integrators, etc. Worldwide leaders marked, based on global positioning Vendors to watch: Are only just entering Israeli market or making a big change so can’t be positioned but should be watched Represents the current Israeli market and not necessarily what we recommend to our clients 2. Products and selected resellers / implementers The location within the list is random Pini Cohen and Sigal Russin's work Copyright@2013 Do not remove source or attribution from any slide, graph or portion of graph 3
- 4. We will present data on products and vendors (cont.) 3. Selected installations of products – projects in different stages , production,implementation, after decision… 4. Service providers that are used by users . I asked users – “which SI do you use in this category” and counted the result. 5. Analysis by international and Israeli analysts This complete information (1 to 5) should be used together, combined with the specific circumstances of each case when making a decision This subjective chart is the result of our objective research Pini Cohen and Sigal Russin's work Copyright@2013 Do not remove source or attribution from any slide, graph or portion of graph 4
- 5. STKI InfraOps annual survey Pini Cohen and Sigal Russin's work Copyright@2013 Do not remove source or 5 attribution from any slide, graph or portion of graph 5
- 6. Ratio Analysis: Sorted Metric Metric • 25% percentile 36 43 57 36 50 117 • 50% percentile = median 50 57 438 60 60 175 • 75% percentile 68.6 25% percentile 60 71 150 143 100 120 100 50 109 250 117 125 117 280 120 60 120.0 50% percentile = Median 120 200 125 117 125 100 143 164 150 125 164 600 175 192 178.1 75% percentile 188 71 192 120 200 50 250 188 280 43 438 109 600 100 Pini Cohen and Sigal Russin's work Copyright@2013 Do not remove source or attribution from any slide, graph or portion of graph 6
- 7. PC Support Ratios • Support Per PC for FTE Per FTE Service Second Level Third – Image Total Support Desk per PC 25 percentile 188 250 1500 100 Median 315 450 3200 126 75 percentile 589 567 4000 247 • Support per Employee for FTE Source: STKI Per FTE Service Second Level Third – Image Total Support Desk per Empl. 25 percentile 225 300 1500 124 Median 300 438 3000 152 75 percentile 475 567 4000 193 Pini Cohen and Sigal Russin's work Copyright@2013 Do not remove source or attribution from any slide, graph or portion of graph 7
- 8. Agenda for technology domains Security Networking and Printing Storage Servers Desktops PC etc. (skipped) DBMS Enterprise system management Development and SOA Pini Cohen and Sigal Russin's work Copyright@2013 Do not remove source or attribution from any slide, graph or portion of graph 8
- 9. Customers Main Issues in 2012 • Cyber security -Smarter & Complexity attacks, APT, DDOS • BYOD - Security on Mobile –MDM • Network monitoring -SIEM • NAC –network access control • WI-FI as a service • Control & Monitoring of Administrative • Unauthorized Device Detection • DLP- Data loss prevention • Cloud security • Regulation – ISO Pini Cohen and Sigal Russin’s work/ Copyright@2013 Do not remove source or attribution from any slide, graph or portion of graph 9
- 10. Security • Security 2013 • Social engineering • Identity management • Cloud storage services Pini Cohen and Sigal Russin’s work/ Copyright@2013 Do not remove source or attribution from any slide, graph or portion of graph 10
- 11. Security Pini Cohen and Sigal Russin's work Copyright@2013 Do not remove source or attribution from any slide, graph or portion of graph 11
- 12. Industry groups represented by percent of breaches Security Source: Verison , 2012 DATA BREACH INVESTIGATIONS REPORT Pini Cohen and Sigal Russin’s work/ Copyright@2013 Do not remove source or attribution from any slide, graph or portion of graph 12
- 13. Social tactics by percent of breaches within Social Security Source: Verison , 2012 DATA BREACH INVESTIGATIONS REPORT Pini Cohen and Sigal Russin’s work/ Copyright@2013 Do not remove source or attribution from any slide, graph or portion of graph 13
- 14. Security Source: Ponemon Institute Pini Cohen and Sigal Russin’s work/ Copyright@2013 Do not remove source or attribution from any slide, graph or portion of graph 14
- 15. 3 1 2 Pini Cohen and Sigal Russin's work Copyright@2013 Do not remove source or attribution from any slide, graph or portion of graph 15
- 16. Security Pini Cohen and Sigal Russin’s work/ Copyright@2013 Do not remove source or attribution from any slide, graph or portion of graph 16
- 17. Identity & Access Management Pini Cohen and Sigal Russin's work Copyright@2013 Do not remove source or attribution from any slide, graph or portion of graph 17
- 18. Security Pini Cohen and Sigal Russin’s work/ Copyright@2013 Do not remove source or attribution from any slide, graph or portion of graph 18
- 19. Pini Cohen and Sigal Russin’s work/ Copyright@2013 Do not remove source or attribution from any slide, graph or portion of graph Source: veracode 19
- 20. Forrester: “Most data breaches caused by employees" 30% - 'simple loss or theft‘ Security 27% - 'inadvertant misuse by an employee‘ 25% - 'external attack‘ 12% - 'malicious insiders‘ Source: information week 2012 Pini Cohen and Sigal Russin's work Copyright@2013 Do not remove source or attribution from any slide, graph or portion of graph 20
- 21. Turn Insiders Into Assets - Security Awareness Program Focus on changing user behavior- training your employee (videos) Test and retest - testing employee reaction to an actual test like: phishing e-mails. Teach the individual- tailored training to the company and the individuals who work there (USB devices). Even a failure can be a success- employee reports, susceptible to social engineering. Source: information week 2012 Pini Cohen and Sigal Russin’s work/ Copyright@2013 Do not remove source or attribution from any slide, graph or portion of graph 21
- 22. Most Intellectual Property Theft Involves Company Insiders • Perimeter defenses do not absolutely protect a network, vetting suppliers is not a sure way to protect against compromised hardware. You should monitor for anomalies in your network. • Keep Policy Up To Date! Security Source: information week 2012, Verison Pini Cohen and Sigal Russin’s work/ Copyright@2013 Do not remove source or attribution from any slide, graph or portion of graph 22
- 23. Best Practices for Defending Yourself Out of office replies- do not give a stranger personally identifiable information. Email Links and Attachments-never open a link or an attachment from someone you don’t know. Phone Calls-requiring that employees use verbal code words to verify their identity. On-Premise Badge and Security- use cameras, guards and mantraps before a secure doorway. Unlocked Computers and Laptops- always be vigilant! Source: http://blog.neustar.biz/dont/social-engineering-5-tips-and-best-practices-for-defending-against-it/ Pini Cohen and Sigal Russin’s work/ Copyright@2013 Do not remove source or attribution from any slide, graph or portion of graph 23
- 24. Security Pini Cohen and Sigal Russin’s work/ Copyright@2013 Do not remove source or attribution from any slide, graph or portion of graph 24
- 25. Security Pini Cohen and Sigal Russin’s work/ Copyright@2013 Do not remove source or attribution from any slide, graph or portion of graph 25
- 26. Don’t risk your Data! Source: Ponemon Institute Pini Cohen and Sigal Russin’s work/ Copyright@2013 Do not remove source or attribution from any slide, graph or portion of graph 26
- 27. Cloud Storage Services Definition • A network of distributed data centers which typically uses cloud computing technologies like virtualization, and offers some kind of interface for storing data. • To increase the availability of the data, it may be redundantly stored at different locations. • Many cloud storage providers are active on the market, offering various kinds of services to their customers. Security Source: https://www.sit.fraunhofer.de/fileadmin/dokumente/studien_und_technical_reports/Cloud-Storage-Security_a4.pdf Pini Cohen and Sigal Russin’s work/ Copyright@2013 Do not remove source or attribution from any slide, graph or portion of graph 27
- 28. Cloud Storage Features Security Source: https://www.sit.fraunhofer.de/fileadmin/dokumente/studien_und_technical_reports/Cloud-Storage-Security_a4.pdf Pini Cohen and Sigal Russin’s work/ Copyright@2013 Do not remove source or attribution from any slide, graph or portion of graph 28
- 29. Case Study : DROPBOX Security Browser API Dropbox uses Amazon Web Services (AWS) for storage and transfer. Dropbox does not verify the email address at registration, hence it is open for incrimination attacks. Client-side encryption is not supported. It is unclear which flavor of sharing is used if non-subscribers are included (closed user group vs. publication). In 2011 accounts could be accessed without a password, and in 2012 spam emails were sent to Dropbox users. SouIe: https://www.sit.fraunhofer.de/fileadmin/dokumente/studien_und_technical_reports/Cloud-Storage-Security_a4.pdf Pini Cohen and Sigal Russin’s work/ Copyright@2013 Do not remove source or attribution from any slide, graph or portion of graph 29
- 30. Security Source: The FixYa Cloud Storage Report. Novmber 2012 Pini Cohen and Sigal Russin’s work/ Copyright@2013 Do not remove source or attribution from any slide, graph or portion of graph 30
- 31. Security Concerns • SkyDrive uses SSL to encrypt files during transport, but files are unencrypted once at rest on Microsoft’s servers. • Data Leak Source: Ponemon Institute Pini Cohen and Sigal Russin’s work/ Copyright@2013 Do not remove source or attribution from any slide, graph or portion of graph 31
- 32. Secured Alternative Solutions • Use Local encryption for protecting your data • IBM Collaboration Cloud • Box.net 67% viewed third-party • SpiderOak applications as a significant • Sharefile –Citrix risk – second to mobile • WatchDox security risk. • Acronis • Application Rapping • Symantec Security • F5 Pini Cohen and Sigal Russin’s work/ Copyright@2013 Do not remove source or attribution from any slide, graph or portion of graph 32
- 33. WatchDox Security ACCESS documents on any device SHARE documents across organizations CONTROL documents at all times Pini Cohen and Sigal Russin’s work/ Copyright@2013 Do not remove source or attribution from any slide, graph or portion of graph 33
- 34. WatchDox Makes Document Security Easy Email Sharing WatchDox Exchange Group Collaboration WatchDox Workspaces Cross-Device Sync WatchDox Sync • Security is added seamlessly, automatically Pini Cohen and Sigal Russin's work Copyright@2013 Do not remove source or attribution • Documents encrypted at all times: rest, transit, use from any slide, graph or portion of graph
- 37. Recommendations • Review your security policy related to social engineering • DO NOT allow using free cloud storage OR • Allow employee BYOA but secure it with encryption tools • Use a collaboration tool for better productivity & security • Start Identity & access management project • Education ,awareness Training! Pini Cohen and Sigal Russin's work Copyright@2013 Do not remove source or attribution from any slide, graph or portion of graph 37
- 38. Data Leakage Prevention -Israeli Market Positioning 1Q13 Websense Local Support Player Symantec Verdasys Fidelis Worldwide Leader GTB McAfee CA Safend Checkpoint EMC Market Presence/Perception Pini Cohen and Sigal Russin's work Copyright@2013 Do not remove source or attribution from any slide, graph or portion of graph 38
- 39. Security Consultants -Israeli Market View 1Q13 (Partial List) Source: STKI *DataSec, **Oasis-Tech Pini Cohen and Sigal Russin's work Copyright@2013 Do not remove source or attribution from any slide, graph or portion of graph 39
- 40. Security System Integrators -Israeli Market View 1Q13 (Partial List) *Netcom **Spider ^Oasis-Tech ^^Decimus Source: STKI Pini Cohen and Sigal Russin's work Copyright@2013 Do not remove source or attribution from any slide, graph or portion of graph 40
- 41. Security personal ratio • Number of Security personal in IT as percentage of total IT employees: Per FTE Security % IT personal 25 percentile 2.2% Median 3.6% 75 percentile 5% Source: STKI Pini Cohen and Sigal Russin's work Copyright@2013 Do not remove source or attribution from any slide, graph or portion of graph 41
- 42. Agenda for technology domains Security Networking and Printing Storage Servers Desktops PC etc. DBMS Enterprise system management Development and SOA Pini Cohen and Sigal Russin's work Copyright@2013 Do not remove source or attribution from any slide, graph or portion of graph 42
- 43. Networking General trends-2013 Software- Wireless local Network defined area network visibility in networking will (WLAN) for virtualized replace current guests and environments NAC BYOD (VoWLAN) Pini Cohen and Sigal Russin's work Copyright@2013 Do not remove source or attribution from any slide, graph or portion of graph 43
- 44. Network Visibility Benefits Improve the performance of your network with cloud computing, video streaming, mobility etc. Utilize security issues and application performance management. Good view of your network traffic down to the packet level. You don’t need to go through an emergency change control at the start of the incident just to get these taps! Networking Pini Cohen and Sigal Russin's work Copyright@2013 Do not remove source or attribution from any slide, graph or portion of graph 44
- 45. Port Mirroring • Requires an engineer to configure the switch or switches. • Eliminate corrupt packets or packets which below a minimum size. • Switches may drop layer 1 and select layer 2 errors depending on high priority. • Need to troubleshoot common physical layer problems such as faulty NIC. • A network devices can support a restricted number of port mirrors. It is very important for security and analysis the same data with many devices. Pini Cohen and Sigal Russin's work Copyright@2013 Do not remove source or attribution from any slide, graph or portion of graph 45
- 46. Cyber Security Challenges – No Visibility NETWORK INFRASTRUCTURE Traffic Growth Number of links, Size of links, amount of traffic Traffic New Applications New Protocols, Encrypted Traffic Data Center BYOD Mixture of devices, Policies & Compliance Device Cloud / Virtualization Applications go virtual, Inter-VM traffic Cloud / Virtualization
- 47. Solution - Visibility with NPB NETWORK MONITORING INFRASTRUCTURE TOOLS Network Packet Broker Traffic Data Center Device Cloud / Virtualization
- 48. Traffic Market Maker, Market Leader Gigamon - Visibility Fabric
- 49. Networking active ports ratio • Number of active ports divided to total ports: Per FTE Active ports ratio 25 percentile 62% Median 67% 75 percentile 79% Networking Source: STKI Pini Cohen and Sigal Russin's work Copyright@2013 Do not remove source or attribution from any slide, graph or portion of graph 49
- 50. Networking personal ratio • Number of active ports divided to network staff members (voice + data): Per FTE # of active ports 25 percentile 500 Median 1000 75 percentile 1800 Networking Source: STKI Pini Cohen and Sigal Russin's work Copyright@2013 Do not remove source or attribution from any slide, graph or portion of graph 50
- 51. Output Management-Israeli Market Positioning 1Q13 Vendors to watch : Consist HP Local Support Autofont Player Adobe Worldwide Leader ISIS-Papyrus Aman/Beeri Market Presence/Perception Pini Cohen and Sigal Russin's work Copyright@2013 Do not remove source or attribution from any slide, graph or portion of graph 51
- 52. HP Exstream Pini Cohen and Sigal Russin's work Copyright@2013 Do not remove source or attribution from any slide, graph or portion of graph 52
- 53. Agenda for technology domains Security Networking and Printing Storage Servers Desktops PC etc. DBMS Enterprise system management Development and SOA Pini Cohen and Sigal Russin's work Copyright@2013 Do not remove source or attribution from any slide, graph or portion of graph 53
- 54. Storage essentials: more more more… Storage Source: http://www.kajashi.com/?q=article/storage-market-and-opportunity Pini Cohen and Sigal Russin's work Copyright@2013 Do not remove source or attribution from any slide, graph or portion of graph 54
- 55. Storage Size and Growth in Selected Industries Industry 2012 1Q Size 2013 1Q Size Planned Growth per RAW RAW year Defense 500T-6P 1P-8P 50%- 75% Finance 600T-1.3P 600-2.5P 25% - 75% Health 140T-550T 300T-1500P 30%-50% Manufacturing – 100T-250T 200T-800T 20%-50% Retail Telco 2P-3P 2P-5P 30%-50% Governmental Public 100T-300T 100T-400T 25%-100% Storage Actual storage growth is based on procurement cycles Pini Cohen and Sigal Russin’s work/ Copyright@2013 Do not remove source or attribution from any slide, graph or portion of graph 55
- 56. Storage growth forecast • Storage will continue to grow at even faster rates • What might harm the traditional storage vendors is: Big Data (Hadoop, NoSQL DBMS) which basically comes as “simple servers with internal disks” Software Defined Datacenter that might change storage architecture Pini Cohen and Sigal Russin's work Copyright@2013 Do not remove source or attribution from any slide, graph or portion of graph 56
- 57. Storage essentials: 25% price decline per TB Storage Source: http://www.kajashi.com/?q=article/storage-market-and-opportunity Pini Cohen and Sigal Russin's work Copyright@2013 Do not remove source or attribution from any slide, graph or portion of graph 57
- 58. Storage cost saving initiatives • Thin provisioning • Storage virtualization • Deduplication • Compression • ISCSI has matured Source: http://lssacademy.com/2010/06/01/3-practical-ways-to-immediately-reduce-costs/ • Reconsider backup policy • Potentially switch storage vendors = negotiation Storage Pini Cohen and Sigal Russin's work Copyright@2013 Do not remove source or attribution from any slide, graph or portion of graph 58
- 59. IBM Real Time Compression (SAN +NAS) Within one click: - Create Compressed Volume - Save up to 80% of the existing capacity and future growth - No Performance compromising Storage - Complex Tasks become so simple in the V7000 Pini Cohen and Sigal Russin's work Copyright@2013 Do not remove source or attribution from any slide, graph or portion of graph 59
- 60. Compression Without Compromise Expected Compression Ratios • SAN Volume Controller Real-time Compression uses same proven Random- Access Compression Engine (RACE) as IBM RTC Appliances • Delivers similar levels of compression DB2 and Oracle databases Up to 80% Linux virtual OSes Up to 70% Virtual Servers (VMware) Windows virtual OSes Up to 50% 2003 Up to 60% Office 2007 or later Up to 20% CAD/CAM Up to 70% . Source: IBM Field experience and internal tests • IBM Compresstimator tool can be used to evaluate expected compression benefits for specific environments Pini Cohen and Sigal Russin's work Copyright@2013 Do not remove source or attribution from any slide, graph or portion of graph 60
- 61. Storage technology used: Israel vs. the world Pini Cohen and Sigal Russin's work Copyright@2013 Do not remove source or attribution from any slide, graph or portion of graph 61
- 62. Planned Projects Pini Cohen and Sigal Russin's work Copyright@2013 Do not remove source or attribution from any slide, graph or portion of graph 62
- 63. Isilon Scale Out NAS Simple to Scale – Manage 15+ PBs like 1TB drive Predictable Performance – Grows linearly with nodes Efficient to Operate – Maximize utilization to 80%+ – Automated tiering Scale Out Single File System > 15PB! Available Always – Survives multiple failures Native Hadoop HDFS – For Scale Out Big Data Storage • 60 Seconds to add a node – Connect and forget Pini Cohen and Sigal Russin's work Copyright@2013 Do not remove source or attribution from any slide, graph or portion of graph 63
- 64. NETAPP ONTAP 8.1.1 Cluster-Mode Key Attributes Simpler data management via a single • Single-Vserver cluster data store mount for multi-PB data store Built on Cluster-Mode NAS Interface [NFS] Uses FlexVols as constituents Native storage efficiency Dedupe, compression, thin provisioning Automatically balanced across nodes at NetApp Infinite Volume creation/ingest • FAS 6280, NFS v3 Cluster-wide Namespace • Scales to 20PB and 2 billion files • Container-wide snapshots and SnapMirror … … replication Data ONTAP 8 Cluster-Mode Pini Cohen and Sigal Russin's work Copyright@2013 Do not remove source or attribution from any slide, graph or portion of graph 64
- 65. New HW technologies • RAM vs. Flash • Access method: PCI-E Internal (SAS interface) External SAN (HBA) External via Ethernet card – NAS • Mode: Source: NASA Monolithic (only one type of HW) Hybrid (combination of HW type) Automatic tiered Storage Manual tiered Pini Cohen and Sigal Russin's work Copyright@2013 Do not remove source or attribution from any slide, graph or portion of graph 65
- 66. New HW alternatives and combinations : Flash RAM Source: http://itbrandpulse.com/Documents/Flash%20Memory%20Summit%20-%20IT%20Brand%20Pulse%20-%20SSD%20Buying%20Behavior.pdf Storage Pini Cohen and Sigal Russin's work Copyright@2013 Do not remove source or attribution from any slide, graph or portion of graph 66
- 67. SSD usage perception Source: http://itbrandpulse.com/Documents/Flash%20Memory%20Summit%20-%20IT%20Brand%20Pulse%20-%20SSD%20Buying%20Behavior.pdf Published – August 2012 Storage Pini Cohen and Sigal Russin's work Copyright@2013 Do not remove source or attribution from any slide, graph or portion of graph 67
- 68. SSD typical usage Source: http://itbrandpulse.com/Documents/Flash%20Memory%20Summit%20-%20IT%20Brand%20Pulse%20-%20SSD%20Buying%20Behavior.pdf Storage Pini Cohen and Sigal Russin's work Copyright@2013 Do not remove source or attribution from any slide, graph or portion of graph 68
- 69. Many Categories many players Source: http://itbrandpulse.com/Documents/Flash%20Memory%20Summit%20-%20IT%20Brand%20Pulse%20-%20SSD%20Buying%20Behavior.pdf Storage Pini Cohen and Sigal Russin's work Copyright@2013 Do not remove source or attribution from any slide, graph or portion of graph 69
- 70. E-Discovery and storage • Discovery in civil litigation which deals with the exchange of information in electronic format. • Storage related tools are part of archiving market Storage Source: https://www.google.co.il/search?q=e-discovery&hl=iw&safe=off&source=lnms&tbm=isch&sa=X&ei=PMNFUfPmGOb07AbeyoHQAg&ved=0CAoQ_AUoAQ&biw=1920&bih=981#imgrc=BZREjMnP_Jt1TM%3A%3B0hfSQKdkIwWFNM%3Bhttp%253A%252F%252Fediscoverytimes.com%252Fwp-content%252Fuploads%252Fblogger%252F-NhWz12eZ2Gw%252FTl0l0cV_KJI%252FAAAAAAAAARQ%252FDqMlP1rrv28%252Fs1600%252FeDiscoveryMagic.jpg%3Bhttp%253A%252F%252Fediscoverytimes.com%252Fediscovery-from-magic-to-mainstream-technology%252F%3B425%3B426 Pini Cohen and Sigal Russin's work Copyright@2013 Do not remove source or attribution from any slide, graph or portion of graph 70
- 71. Storage virtualization- the next big thing?! • The logical step after server virtualization • We have been expecting it many years • Looks like it is progressing • PS – this slide is from last year… Pini Cohen and Sigal Russin's work Copyright@2013 Do not remove source or attribution from any slide, graph or portion of graph 71
- 72. Storage virtualization Is also thee basics of sophisticated Active-Active solutions? RAC ESX/HA HACMP MSCS Veritas VCS Have the exact SAME information… In two separate locations… Storage Accessible at the SAME time Pini Cohen and Sigal Russin's work Copyright@2013 Do not remove source or attribution from any slide, graph or portion of graph 72
- 73. Use of storage virtualization • Not sure if: • Single vendor • Heterogeneous vendors • Storage virtualization via file system (example – Symantec storage foundation) Pini Cohen and Sigal Russin's work Copyright@2013 Do not remove source or attribution from any slide, graph or portion of graph 73
- 74. Enhanced Storage Virtualization BACKUP SNAPSHOT Virtual Servers Servers BC/DR Fc-sw TEST/DEV Actifio ARCHIVING 2500$ High End 500$/TB /TB 4000$/TB Pini Cohen and Sigal Russin's work Copyright@2013 Do not remove source or attribution from any slide, graph or portion of graph 74
- 75. Assessing storage essentials • Performance: • For ReadWrite ratio and block size what is the: IO per second (more important for small block size) Latency Throughput (more important for large block size) • Functionality (and its influence on performance): Copy’s and Snaps Replication Application Virtualization aware functionality Deduplication Thin provisionning Etc. Pini Cohen and Sigal Russin's work Copyright@2013 Do not remove source or attribution from any slide, graph or portion of graph 75
- 76. Storage procurement trend • Instead of buying chassis, drives, cache, software, etc • Buy capacity with SLA (measured from the FC switch or storage box perspective) • SLA can be “worse case” or “average” (preferably the first choice) Storage Source: http://www.lablynx.com/AboutUs/DataCenter/ServiceLevelAgreement/tabid/342/Default.aspx Pini Cohen and Sigal Russin's work Copyright@2013 Do not remove source or attribution from any slide, graph or portion of graph 76
- 77. Inputs from STKI Round Table • Automatic tiring solutions (SSD to SAS to SATA) are not mature • Measuring the actual storage performance is tricky - from the “storage” or from the “application”. • Backup on DiskVTL with deduplication is standard but for long term retention physical tapes are still in use • All DR drills are not testing “real life” situation where some of the data is replicated synchronically, a-synchronicly and with DBMS replication technologies. This will cause business inconsistency in due date. Storage Pini Cohen and Sigal Russin's work Copyright@2013 Do not remove source or attribution from any slide, graph or portion of graph 77
- 78. Inputs from STKI round table • Mid-range storage array are used increasingly for critical loads. • The debate about SAN vs. NAS for VMWARE environments is not decided yet. • Enhanced shared file system (example: Symantec storage foundation) can help with storage virtualization but price is not trivial • Thin provisionning has matured but requires tight processes since with over provisionning– all applications will halt! • “Over commit” was suggested as 125% to 130% Storage Pini Cohen and Sigal Russin's work Copyright@2013 Do not remove source or attribution from any slide, graph or portion of graph 78
- 79. Usable/Raw storage ratio • Net Storage in this research – usable for applications: After Raids After replication to DRP Without VTL’s The term “Usable storage” is tricky since with snapshots application can see more storage then “Raw storage” • Slowly (but surely) the net/raw percentage is growing NETRAW Ratio 25 percentile 25% Median 50% 75 percentile 70% Source: STKI Pini Cohen and Sigal Russin's work Copyright@2013 Do not remove source or attribution from any slide, graph or portion of graph 79
- 80. Storage Ratios • Number of Raw TB and Usable TB per Storage Staff Member FTE (including backup and DRP of storage): Per FTE RAW Storage Usable Storage 25 percentile 148T 75T Median 350T 128T 75 percentile 575T 301T Source: STKI • The ratios have increased dramatically. This means that storage staff is understaffed! Pini Cohen and Sigal Russin's work Copyright@2013 Do not remove source or attribution from any slide, graph or portion of graph 80
- 81. Market Status and Recommendations • Users are using these integrators (support, maintenance, projects, etc.) in Storage •EMC • Ankor , Netapp, IBM • HDS, MALAM-TEAM • Bynet, One1-Harel, EMET, HP Pini Cohen and Sigal Russin's work Copyright@2013 Do not remove source or attribution from any slide, graph or portion of graph 81
- 82. Market Status and Recommendations • Users are using these integrators (support, maintenance, projects, etc.) in Backup •Taldor Glasshouse • Emet • IBM, Ankor, Terasky, Malam-Team • TrustIT, Bynet, HDS Pini Cohen and Sigal Russin's work Copyright@2013 Do not remove source or attribution from any slide, graph or portion of graph 82
- 83. Highend storage (including MF) Israeli Market Positioning 1Q13 Vendors to watch: Specific vendors that can deliver mush more IOPS than traditional Highend EMC systems – like Kaminario HDS Local Support IBM HP (XP) Market Presence/Perception Pini Cohen and Sigal Russin's work Copyright@2013 Do not remove source or attribution from any slide, graph or portion of graph 83
- 84. Unified (midrange) storage - Israeli Market Positioning 1Q13 Vendors to watch NETAPP HDS EMC Local Support IBM HP Midrange storage share is rising on the expenses of highend storage Market Presence Perception Pini Cohen and Sigal Russin's 84 work Copyright@2013 Do not remove source or attribution from any slide, graph or portion of graph 84
- 85. Enterprise Backup SW - Israeli Market Positioning 1Q13 Symantec EMC Local Support IBM Commvault HP Actifio * Not really apples to apples Market Presence Perception Pini Cohen and Sigal Russin's work Copyright@2013 Do not remove source or attribution from any slide, graph or portion of graph 85
- 86. DEDUPVTL appliances or software*- Israeli Market Positioning 1Q13 Vendors to watch EMC HP Symantec Local Support IBM Commvault Actifio * Not really apples to apples Market Presence Perception Pini Cohen and Sigal Russin's work Copyright@2013 Do not remove source or attribution from any slide, graph or portion of graph 86
- 87. More emerging categories Scale Out NAS – EMCIsilon, NETAPP clustered mode, Panasas, IBM’s GPFS, etc. Storage virtualization- IBM’s SVC, EMC’s VPLEX Extended Storage virtualization – Actifio Local Support Market Presence Perception Pini Cohen and Sigal Russin's work Copyright@2013 Do not remove source or attribution from any slide, graph or portion of graph 87
- 88. Agenda for technology domains Security Networking and Printing Storage Servers Desktops PC etc. DBMS Enterprise system management Development and SOA Pini Cohen and Sigal Russin's work Copyright@2013 Do not remove source or attribution from any slide, graph or portion of graph 88
- 89. Server essentials: plans Servers Pini Cohen and Sigal Russin's work Copyright@2013 Do not remove source or attribution from any slide, graph or portion of graph 89
- 90. Low power servers Servers Pini Cohen and Sigal Russin's work Copyright@2013 Do not remove source or attribution from any slide, graph or portion of graph 90
- 91. Why not considering low power servers? Servers Pini Cohen and Sigal Russin's work Copyright@2013 Do not remove source or attribution from any slide, graph or portion of graph 91
- 92. Intel vs. AMD servers Servers Pini Cohen and Sigal Russin's work Copyright@2013 Do not remove source or attribution from any slide, graph or portion of graph 92
- 93. Memory in X86 servers Servers Pini Cohen and Sigal Russin's work Copyright@2013 Do not remove source or attribution from any slide, graph or portion of graph 93
- 94. Importance of power and cooling efficiency Servers Pini Cohen and Sigal Russin's work Copyright@2013 Do not remove source or attribution from any slide, graph or portion of graph 94
- 95. Server density Servers Pini Cohen and Sigal Russin's work Copyright@2013 Do not remove source or attribution from any slide, graph or portion of graph 95
- 96. WW blade server market share Source: http://wikibon.org/wiki/v/Server_Growth_in_Blades_and_Scalable_Solutions Servers Pini Cohen and Sigal Russin's work Copyright@2013 Do not remove source or attribution from any slide, graph or portion of graph 96
- 97. Microservers • A microserver is: Single socket; Lightweight, low power and low cost; and Part of a shared infrastructure environment whereby many small servers are packaged into a larger ecosystem. Servers Source: http://www.apm.com/global/x-gene/docs/2012_03_OPP%20Cloudy%20with%20a%20Chance%20of%20ARM.pdf Pini Cohen and Sigal Russin's work Copyright@2013 Do not remove source or attribution from any slide, graph or portion of graph 97
- 98. ARM servers: Calxeda Servers Source: http://www.cs.sandia.gov/Conferences/SOS16/talks/Freund.pdf Pini Cohen and Sigal Russin's work Copyright@2013 Do not remove source or attribution from any slide, graph or portion of graph 98
- 99. Servers Pini Cohen and Sigal Russin's work Copyright@2013 Do not remove source or attribution from any slide, graph or portion of graph 99
- 100. Servers Pini Cohen and Sigal Russin's work Copyright@2013 Do not remove source or attribution from any slide, graph or portion of graph 100
- 101. The HP BladeSystem c7000 Platinum Enclosure •Enhanced fabric capabilities for demanding workloads • 40% increase in mid-plane bandwidth • Support for the HP BLc 4x FDR IB Switch and Managed Switch up to 56Gb • 2x storage bandwidth with 16Gb Fibre Channel support • Intelligent Infrastructure • Standard 2400W Platinum Hot Plug Power Supply (80Plus Platinum certified) • Single Phase - Intelligent Power Module(IPDU) • Location Discovery Services Pini Cohen and Sigal Russin's work Copyright@2013 Do not remove source or attribution from any slide, graph or portion of graph 101
- 102. Inputs from STKI Round Table • Users are looking for technology that will enable then use different typesclassifications of networks in the same chassis (external, dmz, internal, “secret” x dev test prod…) • Virtual appliances issues (example – Nexus v1000) – how can I know if an error is in the virtual appliance or at the physical layer? • Who is responsible on the internal switch at the blade chassis? • Users are starting to deploy DBMS on virtual infrastructure. • VMWARE’s SRM is popular. Implementation requires “mini DR plan” • FCOE is not mature enough Pini Cohen and Sigal Russin's work Copyright@2013 Do not remove source or attribution from any slide, graph or portion of graph 102
- 103. Inputs from STKI RT: What is important in server selection? • Price, reliability, availability, ILO , partners, energy consumption – of course! • Single point of management • Enable functionality that is related to several domains. Example of domains: vmwarebladenetwork cardchassisnetwork switch • How many virtual NIC adaptors can be supported by physical NIC • Manage complete server profile from one location (bios, wwn, mac addresses, etc.) • Can I use the strongest Intel CPU’s? • How many chassis can you connect (storage, Ethernet) and manage together ? • Longevity of chassis technology Source: http://carastidbits.blogspot.co.il/2009_11_01_archive.html Pini Cohen and Sigal Russin's work Copyright@2013 Do not remove source or attribution from any slide, graph or portion of graph 103
- 104. Whitebox servers are rising? • Maybe because big data?! Servers Source: http://www.zdnet.com/asian-tech-companies-are-eating-hp-dell-and-ibms-cloud-lunch-7000008091/ Pini Cohen and Sigal Russin's work Copyright@2013 Do not remove source or attribution from any slide, graph or portion of graph 104
- 105. Super Micro Computers Servers Source: http://www.4-traders.com/SUPER-MICRO-COMPUTER-INC-47220/financials/ Pini Cohen and Sigal Russin's work Copyright@2013 Do not remove source or attribution from any slide, graph or portion of graph 105
- 106. Market Status and Recommendations • Users are using these integrators (support, maintenance, virtualization projects, etc.) in Servers-Platform Open area: •HP • EMET One1Harel • Malam-Team IBM • EMC Ubitech • Bynet Oracle Taldor Matrix Integrity-Software(SBC) Pini Cohen and Sigal Russin's work Copyright@2013 Do not remove source or attribution from any slide, graph or portion of graph 106
- 107. Server Ratios - Windows • Number of Windows Servers (logical ) per System member Per FTE All Win Servers Prod Win Servers 25 percentile 96 servers 55servers Median 117 Servers 73 Servers 75 percentile 145 Servers 92servers Result is similar to last’s year Server is either physical or virtual This includes SBCVDI (CitrixWTSJetro) support • For development environment’s ratios can grow up to 600 servers per FTE • Organizations with 100% identical servers in branches can get ratios up to 1500 servers per FTE Source: STKI Pini Cohen and Sigal Russin's work Copyright@2013 Do not remove source or attribution from any slide, graph or portion of graph 107
- 108. Percent of Production Windows server from all Windows servers Per FTE Percent of prod servers 25 percentile 50% Median 64% 75 percentile 73% Server is either physical or virtual Source: STKI Pini Cohen and Sigal Russin's work Copyright@2013 Do not remove source or attribution from any slide, graph or portion of graph 108
- 109. Percent of SBC FTE vs. total FTE (system) Per FTE Percent of SBC FTE from total System FTE Source: http://www.willowbrookcentral.org/new-years-day-willowbrook-dont-miss-it.html 25 percentile 17% Median 27% 75 percentile 38% Organization with significant SBC (Terminal ServerVDI) Source: STKI Pini Cohen and Sigal Russin's work Copyright@2013 Do not remove source or attribution from any slide, graph or portion of graph 109
- 110. How many users are supported by SBC (Terminal ServerVDI) FTE Per FTE Users per SBC FTE 25 percentile 333 Median 1271 75 percentile 3000 Source: http://www.willowbrookcentral.org/new-years-day-willowbrook-dont-miss-it.html Users and not concurrent users Users might work completely on SBC or partly (just deliver several applications) The heavy SBC users (above 7500 users) will have “mini team” of 3-4 FTE The rest of the users will have 0.5 to 1 FTE as part of the general system team Source: STKI Pini Cohen and Sigal Russin's work Copyright@2013 Do not remove source or attribution from any slide, graph or portion of graph 110
- 111. NOC, Operators Ratio* • Number of production servers per NOC person: Per FTE Servers (win, linux, unix) 25 percentile 73 servers Median 108 Servers 75 percentile 196 Servers • Organizations will have generally 1 person in the day and 2 people at eveningnight (if organization is used to have changes during the night) • Huge variety of NOC responsibility: Look only at monitoring screens Batch operations (both production Control-M, FTP, and infra such as backup) Change management Service desk during night Physical room – electricity, cooling • Mostly 7*24 withwithout Saturday • In organizations with no NOC the Service Desk will have to look at the monitoring screens • MF AS/400 not included in count • Last’s year data Source: STKI Pini Cohen and Sigal Russin's work Copyright@2013 Do not remove source or attribution from any slide, graph or portion of graph 111
- 112. Datacenter spare space- production • Net size of Datacenter vs. gross size of Datacenter Per FTE Percent of DC used 25 percentile 50% Median 73% 75 percentile 81% • When considering that at least 20% of DC room is needed to “move and breath” the conclusion that 75% of organization has used all space in their DC! Source: STKI Pini Cohen and Sigal Russin's work Copyright@2013 Do not remove source or attribution from any slide, graph or portion of graph 112
- 113. DRP Datacenter space vs. Prod Datacenter space • Net size of Datacenter vs. gross size of Datacenter Per FTE Percent of DC used 25 percentile 28% Median 41% 75 percentile 71% Source: STKI Pini Cohen and Sigal Russin's work Copyright@2013 Do not remove source or attribution from any slide, graph or portion of graph 113