1. Psychological Bulletin Copyright 1988 by the American Psychological Association, Inc.
1988, Vol. 103, No. 3, 411-423 0033-2909/88/$00.75
Structural Equation Modeling in Practice: A Review
and Recommended Two-Step Approach
J a m e s C. A n d e r s o n D a v i d W. G e r b i n g
J. L. Kellogg Graduate School of Management Department of Management
Northwestern University Portland State University
In this article, we provide guidance for substantive researchers on the use of structural equation
modeling in practice for theory testing and development. We present a comprehensive, two-step
modeling approach that employs a series of nested models and sequential chi-square difference tests.
We discuss the comparative advantages of this approach over a one-step approach. Considerations
in specification, assessment of fit, and respecification of measurement models using confirmatory
factor analysis are reviewed. As background to the two-step approach, the distinction between ex-
ploratory and confirmatory analysis, the distinction between complementary approaches for theory
testing versus predictive application, and some developments in estimation methods also are dis-
cussed.
Substantive use of structural equation modeling has been proach, however, does not necessarily mean that it is the pre-
growing in psychology and the social sciences. One reason for ferred way to accomplish the model-building task.
this is that these confirmatory methods (e.g., Bentler, 1983; In this article, we contend that there is much to gain in theory
Browne, 1984; Joreskog, 1978) provide researchers with a com- testing and the assessment of construct validity from separate
prehensive means for assessing and modifying theoretical estimation (and respecification) of the measurement model
models. As such, they offer great potential for furthering theory prior to the simultaneous estimation of the measurement and
development. Because of their relative sophistication, however, structural submodds. The measurement model in conjunction
a number of problems and pitfalls in their application can hin- with the structural model enables a comprehensive, confirma-
der this potential from being realized. The purpose of this arti- tory assessment of construct validity (Bentler, 1978). The mea-
cle is to provide some guidance for substantive researchers on surement model provides a confirmatory assessment of conver-
the use of structural equation modeling in practice for theory gent validity and discriminant validity (Campbell & Fiske,
testing and development. We present a comprehensive, two-step 1959). Given acceptable convergent and discriminant validi-
modeling approach that provides a basis for making meaningful ties, the test of the structural model then constitutes a confir-
inferences about theoretical constructs and their interrelations, matory assessment of nomological validity (Campbell, 1960;
as well as avoiding some specious inferences. Cronbach & Meehl, 1955).
The model-building task can be thought of as the analysis of The organization of the article is as follows: As background
two conceptually distinct models (Anderson & Gerbing, 1982; to the two-step approach, we begin with a section in which we
Joreskog & Sorbom, 1984). A confirmatory measurement, or discuss the distinction between exploratory and confirmatory
factor analysis, model specifies the relations of the observed analysis, the distinction between complementary modeling ap-
measures to their posited underlying constructs, with the con- proaches for theory testing versus predictive application, and
structs allowed to intercorrelate freely. A confirmatory struc- some developments in estimation methods. Following this, we
tural model then specifies the causal relations of the constructs present the confirmatory measurement model; discuss the need
to one another, as posited by some theory. With full-informa- for unidimensional measurement; and then consider the areas
tion estimation methods, such as those provided in the EQS of specification, assessment of fit, and respecification in turn.
(Bentler, 1985) or LISREL(Joreskog & Sorbom, 1984) programs, In the next section, after briefly reviewing the confirmatory
the measurement and structural submodels can be estimated structural model, we present a two-step modeling approach
and, in doing so, discuss the comparative advantages of this two-
simultaneously. The ability to do this in a one-step analysis ap-
step approach over a one-step approach.
Background
This work was supported in part by the McManus Research Profes-
sorship awarded to James C. Anderson. Exploratory VersusConfirmatoryAnalyses
We gratefully acknowledgethe comments and suggestionsof Jeanne
Brett, Claes Fornell, David Larcker, William Perreault, Jr., and James Although it is convenient to distinguish between exploratory
Steiger. and confirmatory research, in practice this distinction is not as
Correspondence concerningthis article should be addressedto James clear-cut. As Joreskog (1974) noted, "Many investigations are to
C. Anderson, Department of Marketing, J. L. KelloggGraduate School some extent both exploratory and confirmatory, since they involve
of Management, Northwestern University,Evanston, Illinois 60208. some variables of known and other variables of unknown comlx>-
411
2. 412 JAMES C. ANDERSON AND DAVID W. GERBING
sition" (p. 2). Rather than as a strict dichotomy, then, the distinc- relative strengths of full-information approaches are that they
tion in practice between exploratory and confirmatory analysis provide the most efficient parameter estimates (Joreskog &
can be thought of as that of an ordered progression. Factor analysis Wold, 1982) and an overall test of model fit. Because of the un-
can be used to illustrate this progression. derlying assumption of random error and measure specificity,
An exploratory factor analysis in which there is no prior speci- however, there is inherent indeterminacy in the estimation of
fication of the number of factors is exclusively exploratory. Using factor scores (of. Lawley & Maxwell, 197 l; McDonald & Mu-
a maximum likelihood (ML) or generalized least squares (GLS) laik, 1979; Steiger, 1979). This is not a concern in theory testing,
exploratory program represents the next step in the progression, whereas in predictive applications this will likely result in some
in that a hypothesized number of underlying factors can be speci- loss of predictive accuracy.
fied and the goodness of fit of the resulting solution can be tested. For application and prediction, a PLS approach has relative
At this point, there is a demarcation where one moves from an strength. Under this approach, one can assume that all observed
exploratory program to a confirmatory program. Now, a measure- measure variance is useful variance to be explained. That is,
ment model needs to be specified a priori, although the parameter under a principal-component model, no random error variance
values themselves are freely estimated. Although this has histori- or measure-specific variance (i.e., unique variance) is assumed.
cally been referred to as confirmatoryanalysis, a more descriptive Parameters are estimated so as to maximize the variance ex-
term might be restrictedanalysis, in that the values for many of plained in either the set of observed measures (reflective mode)
the parameters have been restricted a priori, typically to zero. or the set of latent variables (formative mode; ForneU &
Because initially specified measurement models almost invari- Bookstein, 1982). Fit is evaluated on the basis of the percentage
ably fail to provide acceptable fit, the necessary respecification and of variance explained in the specified regressions. Because a
reestimation using the same data mean that the analysis is not PLS approach estimates the latent variables as exact linear
exclusively confirmatory. After acceptable fit has been achieved combinations of the observed measures, it offers the advantage
with a series of respecifications, the next step in the progression of exact definition of component scores. This exact definition
would be to cross-validate the final model on another sample in conjunction with explaining a large percentage of the vari-
drawn from the population to which the results are to be general- ance in the observed measures is useful in accurately predicting
ized. This cross-validation would be accomplished by specifying individuals' standings on the components.
the same model with freely estimated parameters or, in what repre- Some shortcomings of the PLS approach also need to be
scnts the quintessential confirmatory analysis, the same model mentioned. Neither an assumption of nor an assessment of uni-
with the parameter estimates constrained to the previously esti- dimensional measurement (discussed in the next section) is
mated values. made under a PLS approach. Therefore, the theoretical mean-
ing imputed to the latent variables can be problematic. Further-
Complementary Approaches for Theory Testing Versus more, because it is a limited-information estimation method,
PLS parameter estimates are not as efficient as full-information
Predictive Application estimates (Fornell & Bookstein, 1982; Joreskog & Wold, 1982),
A fundamental distinction can be made between the use of and jackknife or bootstrap procedures (of. Efron & Gong, 1983)
structural equation modeling for theory testing and develop- are required to obtain estimates of the standard errors of the
ment versus predictive application (Fornell & Bookstein, 1982; parameter estimates (Dijkstra, 1983). And no overall test of
Joreskog & Wold, 1982). This distinction and its implications model fit is available. Finally, PLS estimates will be asymptoti-
concern a basic choice of estimation method and underlying caUy correct only under the joint conditions of consistency
model. For clarity, we can characterize this choice as one be- (sample size becomes large) and consistency at large (the num-
tween a full-information (ML or GLS) estimation approach ber of indicators per latent variable becomes large; Joreskog &
(e.g., Bentler, 1983; Joreskog, 1978) in conjunction with the Wold, 1982). In practice, the correlations between the latent
common factor model (Harman, 1976) and a partial least variables will tend to be underestimated, whereas the corre-
squares (PLS) estimation approach (e.g., Wold, 1982) in con- lations of the observed measures with their respective latent
junction with the principal-component model (Harman, 1976). variables will tend to be overestimated (Dijkstra, 1983).
For theory testing and development, the ML or GLS ap- These two approaches to structural equation modeling, then,
proach has several relative strengths. Under the common factor can be thought of as a complementary choice that depends on
model, observed measures are assumed to have random error the purpose of the research: ML or GLS for theory testing and
variance and measure-specific variance components (referred development and PLS for application and prediction. As Jore-
to together as uniqueness in the factor analytic literature, e.g., skog and Wold (1982) concluded, " M L is theory-oriented, and
Harman, 1976) that are not of theoretical interest. This un- emphasizes the transition from exploratory to confirmatory
wanted part of the observed measures is excluded from the analysis. PLS is primarily intended for causal-predictive analy-
definition of the latent constructs and is modeled separately. sis in situations of high complexity but low theoretical informa-
Consistent with this, the covariances among the latent con- tion" (p. 270). Drawing on this distinction, we consider, in the
structs are adjusted to reflect the attenuation in the observed remainder of this article, a confirmatory two-step approach to
covariances due to these unwanted variance components. Be- theory testing and development using ML or GLS methods.
cause of this assumption, the amount of variance explained in
the set of observed measures is not of primary concern. Re- Estimation Methods
flecting this, full-information methods provide parameter esti- Since the inception of contemporary structural equation
mates that best explain the observed covariances. Two further methodology in the middle 1960s (Bock & Bargmann, 1966;
3. STRUCTURAL EQUATION MODELING IN PRACTICE 413
Joreskog, 1966, 1967), maximum likelihood has been the pre- parameter estimates obtained at each iteration during the esti-
dominant estimation method. Under the assumption of a multi- mation process, U can be chosen so that minimizing Equation
variate normal distribution of the observed variables, maxi- 2 is asymptotically equivalent to minimizing the likelihood fit
mum likelihood estimators have the desirable asymptotic, or function of Equation 1 (Browne, 1974; Lee & Jennrich, 1979).
large-sample, properties of being unbiased, consistent, and Other choices of U result in estimation procedures that do
efficient (Kmenta, 1971). Moreover, significance testing of the not assume multivariate normality. The most general proce-
individual parameters is possible because estimates of the as- dure, provided by Browne (1984), yields asymptotically distri-
ymptotic standard errors of the parameter estimates can be ob- bution-free (ADF) "best" generalized least squares estimates,
tained. Significance testing of overall model fit also is possible with corresponding statistical tests that are "asymptotically in-
because the fit function is asymptotically distributed as chi- sensitive to the distribution of the observations" (p. 62). These
square, adjusted by a constant multiplier. estimators are provided by the EQS program and the LISREL7
Although maximum likelihood parameter estimates in at program. The EQSprogram refers to these ADF GLS estimators
least moderately sized samples appear to be robust against a as arbitrary distribution theory generalized least squares
moderate violation of multivariate normality (Browne, 1984; (AGLS; Bentler, 1985), whereas the LISREL 7 program refers
Tanaka, 1984), the problem is that the asymptotic standard er- to them as weighted least squares (WLS; Joreskog & Sorbom,
rors and overall chi-square test statistic appear not to be. Re- 1987).
lated to this, using normal theory estimation methods when the The value of U for ADF estimation is noteworthy in at least
data have an underlying leptokurtic (peaked) distribution ap- two respects. First, the elements of U involve not only the sec-
pears to lead to rejection of the null hypothesis for overall model ond-order product moments about the respective means (vari-
fit more often than would be expected. Conversely, when the ances and covariances) of the observed variables but also the
underlying distribution is platykurtic (flat), the opposite result fourth-order product moments about the respective means.
would be expected to occur (Browne, 1984). To address these Therefore, as seen from Equation 2, although covariances are
potential problems, recent developments in estimation proce- still being fitted by the estimation process, as in traditional max-
dures, particularly by Bentler (1983) and Browne ( 1982, 1984), imum likelihood estimation, U now becomes the asymptotic
have focused on relaxing the assumption of multivariate nor- covariance matrix of the sample variances and covariances.
mality. Second, in ML or GLS estimation under multivariate normal
In addition to providing more general estimation methods, theory, Equation 2 simplifies to a more computationally tracta-
these developments have led to a more unified approach to esti- ble expression, such as in Equation 1. By contrast, in ADF esti-
mation. The traditional maximum likelihood fit function (Law- mation, one must employ the full U matrix. For example, when
ley, 1940), based on the likelihood ratio, is there are only 20 observed variables, U has 22,155 unique ele-
ments (Browne, 1984). Thus, the computational requirements
F(0) = lnl m(0)l - lnlSl + tr[S~(0) -~] - p (1) of ADF estimation can quickly surpass the capability of present
computers as the number of observed variables becomes mod-
for p observed variables, with a p • p sample covariance matrix
erately large.
S, and p • p predicted covariance matrix ~(O), where 0 is the
To address this problem of computational infeasibility when
vector of specified model parameters to be estimated. The spe-
the number of variables is moderately large, both EQS and US-
cific maximum likelihood fit function in Equation 1 can be re-
REL 7 use approximations of the full ADF method. Bentler and
placed by a more general fit function, which is implemented in
Dijkstra (1985) developed what they called linearized estima-
the EQS program (Bentler, 1985) and in the LISRELprogram,
tors, which involve a single iteration beginning from appropri-
beginning with Version 7 (Joreskog & Sorbom, 1987):
ate initial estimates, such as those provided by normal theory
F(0) = [s - ~ ( 0 ) ] ' U - ~ [ s - ~(0)], (2) ML. This linearized (L) estimation procedure is referred to as
LAGLS in EQS. The approximation approach implemented in
where s is a p* • 1 vector (such that p* = p(p + 1)/2) of the LIS~EL7 (Joreskog & Sorbom, 1987) uses an option for ignoring
nonduplicated elements of the full covariance matrix S (includ- the off-diagonal elements in U, providing what are called diago-
ing the diagonal elements), a(0) is the correspondingp* • 1 vec- nally weighted least squares (DWLS) estimates.
tor of predicted covariances from ~(0), and U is a p* • p* weight Bentler (1985) also implemented in the EQS program an esti-
matrix. Fit functions that can be expressed in this quadratic mation approach that assumes a somewhat more general under-
form define a family of estimation methods called generalized lying distribution than the multivariate normal assumed for
least squares (GLS). As can be seen directly from Equation 2, ML estimation: elliptical estimation. The multivariate normal
minimizing the fit function F(0) is the minimization of a distribution assumes that each variable has zero skewness
weighted function of the residuals, defined by s - a(0). The like- (third-order moments) and zero kurtosis (fourth-order mo-
lihood ratio fit function of Equation 1 and the quadratic fit ments). The multivariate elliptical distribution is a generaliza-
function of Equation 2 are minimized through iterative algo- tion of the multivariate normal in that the variables may share
rithms (cf. Bentler, 1986b). a common, nonzero kurtosis parameter (Bentler, 1983; Beran,
The specific GLS method of estimation is specified by the 1979; Browne, 1984). As with the multivariate normal, iso-den-
value of U in Equation 2. Specifying U as I implies that mini- sity contours are ellipsoids, but they may reflect more platykur-
mizing F is the minimization of the sum of squared residuals, tic or leptokurtic distributions, depending on the magnitude
that is, ordinary, or "unweighted,' least squares estimation. Al- and direction of the kurtosis parameter. The elliptical distribu-
ternately, when it is updated as a function of the most recent tion with regard to Equation 2 is a generalization of the multi-
4. 414 JAMES C. ANDERSON AND DAVID W. GERBING
variate normal and, thus, provides more flexibility in the types the need for larger sample sizes, which we discuss later in the
of data analyzed. Another advantage of this distribution is that next section).
the fourth-order moments can be expressed as a function of the
second-order moments with only the addition of a single kurto- Confirmatory Measurement Models
sis parameter, greatly simplifying the structure of U.
Bentler (1983) and Mooijaart and Bentler (1985) have out- A confirmatory factor analysis model, or confirmatory mea-
lined an estimation procedure even more ambitious than any surement model, specifies the posited relations of the observed
of those presently implemented in EQS or LISREL7. This proce- variables to the underlying constructs, with the constructs al-
dure, called asymptotically distribution-free reweighted least lowed to intercorrelate freely. Using the LISRELprogram nota-
squares (ARLS), generalizes on Browne's (1984) ADF method. tion, this model can be given directly from Joreskog and Sor-
In an ADF method (or AGLS in EQS notation), U is defined as born (1984, pp. 1.9-10) as
a constant before the minimization of Equation 2 begins. By
contrast, in ARLS, U is updated at each iteration of the minimi- x = A~ + 3, (3)
zation algorithm. This updating is based on Bentler's (1983) where x is a vector of q observed measures, ~ is a vector of n
expression of higher order moment structures, specified as a underlying factors such that n < q, A is a q • n matrix of pattern
function of the current estimates of the model parameters, coefficients or factor loadings relating the observed measures to
thereby representing a generalization of presently estimated the underlying construct factors, and ~ is a vector of q variables
second-order moment structures. that represents random measurement error and measure speci-
In addition to the relaxation of multivariate normality, recent ficity. It is assumed for this model that E(~ 3') = 0. The variance-
developments in estimation procedures have addressed at least covariance matrix for x, defined as Z, is
two other issues. One problem is that when the data are stan-
dardized, the covariances are not rescaled by known constants = AOA' + Os, (4)
but by data-dependent values (i.e., standard deviations) that
where ,I, is the n • n covariance matrix of~ and O, is the diago-
will randomly vary across samples. Because of this, when the
nal q • q covariance matrix of 6.
observed variable covariances are expressed as correlations, the
asymptotic standard errors and overall chi-square goodness-of-
fit tests are not correct without adjustments to the estimation Need for Unidimensional Measurement
procedure (Bentler & Lee, 1983). A companion program to LIS-
Achieving unidimensional measurement (of. Anderson &
REL 7, PRELIS(Joreskog & Sorbom, 1987), can provide such
Gerbing, 1982; Hunter & Gerbing, 1982) is a crucial undertak-
adjustments. A second problem is the use of product-moment ing in theory testing and development. A necessary condition
correlations when the observed variables cannot be regarded as
for assigning meaning to estimated constructs is that the mea-
continuous (cf. Babakus, Ferguson, & Joreskog, 1987). PRELIS sures that are posited as alternate indicators of each construct
also can account for this potential shortcoming of current usage must be acceptably unidimensional. That is, each set of alter-
by calculating the correct polychoric and polyserial coefficients nate indicators has only one underlying trait or construct in
(Muthen, 1984) and then adjusting the estimation procedure common (Hattie, 1985; McDonald, 1981). Two criteria, each
accordingly. representing necessary conditions, are used in assessing unidi-
In summary, these new estimation methods represent impor- mensionality: internal consistency and external consistency.
tant theoretical advances. The degree, however, to which esti- The internal consistency criterion can be presented in the fol-
mation methods that do not assume multivariate normality will lowing fundamental equation (Hart & Spearman, 1913, p. 58;
supplant normal theory estimation methods in practice has yet Spearman, 1914, p. 107):
to be determined. Many data sets may be adequately character-
ized by the multivariate normal, much as the univariate normal
pac _ P~c, (5)
often adequately describes univariate distributions of data. Pad Pbd
And, as Bentler (1983) noted, referring to the weight matrix
U, "an estimated optimal weight matrix should be adjusted to where a, b, c, and dare measures of the same construct, ~. This
reflect the strongest assumptions about the variables that may equality should hold to within sampling error (Spearman &
be possible" (p. 504). Related to this, the limited number of Holzinger, 1924), and at least four measures of a construct are
existing Monte Carlo investigations of normal theory ML esti- needed for an assessment. A related equation is the product rule
mators applied to nonnormal data (Browne, 1984; Harlow, for internal consistency:
1985; Tanaka, 1984) has provided support for the robustness of
ML estimation for the recovery of parameter estimates, though
Pab = Pa~Pb~, (6)
their associated standard errors may be biased. Because assess- where a and b are measures of some construct, ~.
ments of the multivariate normality assumption now can be The external consistency criterion can be given by a redefini-
readily made by using the EQS and PRELIS programs, a re- tion of Equation 3, where (a) a, b and c are alternate indicators
searcher can make an informed choice on estimation methods of a given construct and dis redefined as an indicator of another
in practice, weighing the trade-offs between the reasonableness construct or (b) both c and d are redefined as alternate indica-
of an underlying normal theory assumption and the limitations tors ofanotber construct. A related equation is the product rule
of arbitrary theory methods (e.g., constraints on model size and for external consistency:
5. STRUCTURAL EQUATION MODELING IN PRACTICE 415
Pad = Pa~P~,~Pli*d, (7) Specification
where a is any indicator of construct ~ and d is any indicator of Setting the metric of thefactors. For identification of the mea-
another construct, ~*. Note that when ~ = ~*, Equation 7 re- surement model, one must set the metric (variances) of the fac-
duces to Equation 6; that is, internal consistency represents a tors. A preferred way of doing this is to fix the diagonal of the
special case of external consistency. Because it often occurs in phi matrix at 1.0, giving all factors unit variances, rather than
practice that there are less than four indicators of a construct, to arbitrarily fix the pattern coefficient for one indicator of each
external consistency then becomes the sole criterion for assess- factor at 1.0 (Gerbing & Hunter; 1982). Setting the metric in
ing unidimensionality. The product rules for internal and exter- this way allows a researcher to test the significance of each pat-
tern coctiicient, which is of interest, rather than to forgo this
nal consistency, which are used in confirmatory factor analysis,
and test whether the factor variances are significantly different
can be used to generate a predicted covariance matrix for any
from zero, which typically is not of interest.
specified model and set of parameter estimates.
Single indicators. Although having multiple indicators for
In building measurement models, multiple-indicator mea- each construct is strongly advocated, sometimes in practice
surement models (Anderson & Gerbing, 1982; Hunter & Gerb- only a single indicator of some construct is available. And, as
ing, 1982) are preferred because they allow the most unambigu- most often is the case, this indicator seems unlikely to perfectly
ous assignment of meaning to the estimated constructs. The estimate the construct (i.e., has no random measurement error
reason for this is that with multiple-indicator measurement or measure-specificity component). The question then becomes
models, each estimated construct is defined by at least two mea- "At what values should the theta-delta and lambda parameters
sures, and each measure is intended as an estimate of only one be set?" To answer this, ideally, a researcher would like to have
construct. Unidimensional measures of this type have been re- an independent estimate for the error variance of the single indi-
ferred to as congeneric measurements (Joreskog, 1971). By con- cator, perhaps drawn from prior research, but often this is not
trast, measurement models that contain correlated measure- available.
ment errors or that have indicators that load on more than one In the absence of an independent estimate, the choice of val-
estimated construct do not represent unidimensional construct ues becomes arbitrary. In the past, a conservative value for 0a,
measurement (Gerbing & Anderson, 1984). As a result, assign- such as. I s~, has been chosen, and its associated ~ has been set
ment of meaning to such estimated constructs can be problem- at .95s~ (e.g., Sorbom & Joreskog, 1982). Another conservative
atic (cf. Bagozzi, 1983; Fornell, 1983; Gerbing & Anderson, alternative to consider is to set 0a for the single indicator at the
1984). smallest value found for the other, estimated error variances
Some dissent, however, exists about the application of the (06). Although this value is still arbitrary, it has the advantage
confirmatory factor analysis model for assessing unidimension- of being based on information specific to the given research con-
ality. Cattell (1973, 1978) has argued that individual measures text. That is, this indicator shares a respondent sample and sur-
or items, like real-life behaviors, tend to be factorially complex. vey instrument with the other indicators.
"In other words, to show that a given matrix is rank one is not Sample size needed. Because full-information estimation
to prove that the items are measuring a pure unitary trait factor methods depend on large-sample properties, a natural concern
in common: it may be a mixture of unitary traits" (Cattell, is the sample size needed to obtain meaningful parameter esti-
1973, p. 382). According to Cattell (1973), although these items mates. In a recent Monte Carlo study, Anderson and Gerbing
are unidimensional with respect to each other, they simply may (1984) and Gerbing and Anderson (1985) have investigated ML
represent a "bloated specific" in the context of the true (source estimation for a number of sample sizes and a variety of con-
trait) factor space. That is, the items represent a "psychological firmatory factor models in which the normal theory assump-
concept of something that is behaviorally very narrow" (Cattell, tion was fully met. The results of this study were that although
the bias in parameter estimates is of no practical significance
1973, p. 359).
for sample sizes as low as 50, for a given sample, the deviations
We agree with Cattell (1973, 1978) that estimated first-order
of the parameter estimates from their respective population val-
factors may not correspond to the constructs of interest (cf. ues can be quite large. Whereas this does not present a problem
G-erbing & Anderson, 1984). The measurement approach that in statistical inference, because the standard errors computed
we have advocated is not, however, necessarily inconsistent with by the LISRELprogram are adjusted accordingly, a sample size
Cattell's (1973, 1978) approach. The two approaches can be- of 150 or more typically will be needed to obtain parameter
come compatible when the level of analysis shills from the indi- estimates that have standard errors small enough to be of practi-
vidual items to a corresponding set of composites defined by cal use.
these items. Further analyses of these composites could then be Related to this, two problems in the estimation of the mea-
undertaken to isolate the constructs of interest, which would be surement model that are more likely to occur with small sample
conceptualized as higher order factors (Gerbing & Anderson, sizes are nonconvergence and improper solutions. (We discuss
1984). One possibility is a second-order confirmatory factor potential causes of these problems within the Respecification
analysis as outlined by, for example, Joreskog ( 1971) or Weeks subseOJon.) Solutions are nonconvergent when an estimation
(1980). Another possibility is to interpret the resulting compos- method's computational algorithm, within a set number of iter-
ites within an existing "reference factor system;' such as the ations, is unable to arrive at values that meet prescribed, termi-
16 personality dimensions provided by Cattell (1973) for the nation criteria (cf. Joreskog, 1966, 1967). Solutions are im-
personality domain. proper when the values for one or more parameter estimates
6. 416 JAMES C. ANDERSON AND DAVID W. GERB1NG
are not feasible, such as negative variance estimates (cf. Dillon, them to 1.0 and then performing a chi-square difference test
Kumar, & Mulani, 1987; Gerbing & Anderson, 1987; van Driel, on the values obtained for the constrained and unconstrained
1978). Anderson and Gerbing (1984) found that a sample size of models (Joreskog, 1971). "A significantly lower x 2 value for the
150 will usually be sufficient to obtain a converged and proper model in which the trait correlations are not constrained to
solution for models with three or more indicators per factor. unity would indicate that the traits are not perfectly correlated
Measurement models in which factors are defined by only two and that discriminant validity is achieved" (Bagozzi & Phillips,
indicators per factor can be problematic, however, so larger 1982, p. 476). Although this is a necessary condition for demon-
samples may be needed to obtain a converged and proper solu- strating discriminant validity, the practical significance of this
tion. difference will depend on the research setting. This test should
Unfortunately, a practical limitation of estimation methods be performed for one pair of factors at a time, rather than as a
that require information from higher order moments (e.g., simultaneous test of all pairs of interest. 2 The reason for this is
ADF) is that they correspondingly require larger sample sizes. that a nonsignificant value for one pair of factors can be obfus-
The issue is not simply that larger samples are needed to pro- cated by being tested with several pairs that have significant val-
vide more stable estimates for consistent estimators. Perhaps ues. A complementary assessment of discriminant validity is
of greater concern, the statistical properties of full-information to determine whether the confidence interval (+two standard
estimators are asymptotic; that is, they have proven to be true errors) around the correlation estimate between the two factors
only for large samples. Thus, a critical task is to establish guide- includes 1.0.
lines regarding minimum sample sizes for which the asymp-
totic properties of these more general, arbitrary distribution Respecification
theory estimators can be reasonably approximated.
Presently, such guidelines on minimum sample sizes have not Because the emphasis of this article is on structural equation
been determined. Initial studies by Tanaka (1984) and Hadow modeling in practice, we recognize that most often some respec-
(1985) suggest that a sample size of at least 400 or 500 is needed. ification of the measurement model will be required. It must be
Furthermore, consider Browne's (1984) comments regarding stressed, however, that respecification decisions should not be
the choice of the best generalized least squares (BGLS) estima- based on statistical considerations alone but rather in conjunc-
tors: tion with theory and content considerations. Consideration of
theory and content both greatly reduces the number of alternate
We note that the term "best" is used in a very restricted sense with models to investigate (of. Young, 1977) and reduces the possibil-
respect to a specific asymptotic property which possibly may not ity of taking advantage of sampling error to attain goodness
carry over to finite samples. It is possible that other estimators may of fit.
have other properties which render them superior to BGLS estima-
tors for practical applications of samples of moderate size. (p. 68) Sometimes, the first respecification necessary is in response
to nonconvergence or an improper solution. Noneonvergence
Related to these comments, in a small, preliminary Monte can occur because of a fundamentally incongruent pattern of
Carlo study, Browne (1984) found the BGLS estimates provided sample covariances that is caused either by sampling error in
by the asymptotic distribution-free procedure to have "unac- conjunction with a properly specified model or by a misspecifi-
ceptable bias" (p. 81) for some of the parameters with a sample cation. Relying on content, one can obtain convergence for the
size of 500. model by respecifying one or more problematic indicators to
different constructs or by excluding them from further analysis.
Considering improper solutions, van Driel (1978) presented
Assessment of Fit three potential causes: sampling variations in conjunction with
After estimating a measurement model, given a converged true parameter values close to zero, a fundamentally misspeci-
and proper solution, a researcher would assess how well the fled model, and indefiniteness (underidentification) of the
specified model accounted for the data with one or more overall model. Van Driel showed that it is possible to distinguish which
goodness-of-fit indices. The LISRELprogram provides the prob-
ability value associated with the chi-square likelihood ratio test, The normed fit index (Bentler & Bonett, 1980) can also be calcu-
the goodness-of-fit index, and the root-mean-square residual lated by using the LISRELprogram. This is accomplished by specifying
(of. Joreskog & Sorbom, 1984, pp. 1.38-42). Anderson and each indicator as a separate factor and then fixing lambda as an identity
Gerbing (1984) gave estimates of the expected values of these matrix, theta delta as a null matrix, and phi as a diagonal matrix with
indices, and their 5th- or 95th-percentile values, for a variety of freely estimated variances. Using the obtained chi-square value for this
confirmatory factor models and sample sizes. The chi-square overall null model (X~), in conjunction with the chi-square value (x2)
probability value and the normed and nonnormed fit indices from the measurement model, one can calculate the normed fit index
value as (X2~- x2 )/x20.
(Bentler & Bonett, 1980) are obtained from the EQS program
(Bentler, 1985, p. 94). 1 2 When a number of chi-square difference tests are performed for as-
sessments of discriminant validity, the significance level for each test
Convergent validity can be assessed from the measurement should be adjusted to maintain the "true" overall significance level for
model by determining whether each indicator's estimated pat- the family of tests (cf. Finn, 1974). This adjustment can be given as
tern coefficient on its posited underlying construct factor is sig- ao = 1 - ( 1 - ai)t, where ao is the overall significance level, typically set
nificant (greater than twice its standard error). Discriminant at .05; ,~i is the significance level that should be used for each individual
validity can be assessed for two estimated constructs by con- hypothesis test of discriminant validity; and t is the number of tests
straining the estimated correlation parameter (~ij) between performed.
7. STRUCTURAL EQUATION M O D E L I N G IN PRACTICE 417
of these causes is the likely one by examining the confidence Hunter, 1973) and multiple-groups analysis (cf. Anderson &
interval constructed around the negative estimate. When posi- Gerbing, 1982; Nunnally, 1978), each of which can readily be
tive values fall within this confidence interval and the size of the computed with the ITANprogram (Gerbing & Hunter, 1987). A
interval is comparable to that for proper estimates, the likely similarity coefficient, o0, for any two indicators, xi and xj, can
cause of the improper estimate is sampling error. Building on be defined for a set ofq indicators as
this work, Gerbing and Anderson (1987) recently found that q
for improper estimates due to sampling error, respecifying the
~_~ rxixkrxjxk
model with the problematic parameter fixed at zero has no ap-
preciable effect on the parameter estimates of other factors or vii = q k=~ q (8)
on the overall goodness-of-fit indices. Alternately, this parame- ( ~ r2,xk),/:(Z "XjXkl
,2 ~,12
ter can be fixed at some arbitrarily small, positive number (e.g., k=l k=l
.005) to preserve the confirmatory factor model (cf. Bentler, The value of this index ranges from -1.0 to + 1.0, with values
1976). greater in magnitude indicating greater internal and external
Given a converged and proper solution but unacceptable consistency for the two indicators. Thus, similarity coefficients
overall fit, there are four basic ways to respecify indicators that are useful because they efficiently summarize the internal and
have not "worked out as planned": Relate the indicator to a external consistency of the indicators with one another. Alter-
different factor, delete the indicator from the model, relate the nate indicators of the same underlying factor, therefore, should
indicator to multiple factors, or use correlated measurement have similarity coefficients that are typically .8 or greater.
errors. The first two ways preserve the potential to have unidi- Multiple-groups analysis is a confirmatory estimation
mensional measurement and are preferred because of this, method that is complementary to full-information estimation
whereas the last two ways do not, thereby obfuscating the mean- of multiple-indicator measurement models. With multiple-
ing of the estimated underlying constructs. The use of corre- groups analysis, each construct factor is defined as simply the
lated measurement errors can be justified only when they are unit-weighted sum of its posited indicators. The factor loadings
specified a priori. As an example, correlated measurement er- are simply the correlation of each indicator with the composite
rors may be expected in longitudinal research when the same (construct factor), and the factor correlations are obtained by
indicators are measured at multiple points in time. By contrast, correlating the composites. Communalities are computed
correlated measurement errors should not be used as respecifi- within each group of indicators by iteration. By using commu-
cations because they take advantage of chance, at a cost of only nalities, the resultant indicator-factor and factor-factor corre-
a single degree of freedom, with a consequent loss of interpret- lations are corrected for attenuation due to measurement error.
ability and theoretical meaningfulness (Bagozzi, 1983; Fornell, Because multiple-groups analysis estimates are computed from
1983). Gerbing and Anderson (1984) demonstrated how the un- only those covariances of the variables in the equation on which
critical use of correlated measurement errors for respecifica- the estimates are based, these estimates more clearly localize
tion, although improving goodness of fit, can mask a true un- misspecification, making it easier to detect (Anderson & Gerb-
derlying structure. ing, 1982). For example, if an indicator is specified as being
In our experience, the patterning of the residuals has been related to the wrong factor, then the multiple-groups analysis
the most useful for locating the source of misspecification in shows this by producing a higher factor loading for this indica-
multiple-indicator measurement models. The LISRELprogram tor on the correct factor. Full-information methods, by contrast,
provides normalized residuals (Joreskog & Sorbom, 1984, p. draw on all indicator covariances to produce estimates that
1.42), whereas the EQS program (Bentler, 1985, pp. 92-93) pro- minimize the fit function (Joreskog, 1978).
vides standardized residuals. Although Bentler and Dijkstra In summary, a researcher should use these sources of infor-
(I 985) recently pointed out that the normalized residuals may mation about respecification in an integrative manner, along
not be strictly interpretable as standard normal variates (i.e., with content considerations, in making decisions about respeci-
normalized residuals greater than 1.96 in magnitude may not fication. In practice, the measurement model may sometimes
be strictly interpretable as statistically significant), nonetheless, be judged to provide acceptable fit even though the chi-square
the pattern of large normalized residuals (e.g., greater than 2 in value is still statistically significant. This judgment should be
magnitude) is still informative for respecification. For example, supported by the values of the normed fit index and the other
an indicator assigned to the wrong factor will likely have a pat- fit indices, particularly the root-mean-square residual index in
tern of large negative normalized residuals with the other indi- conjunction with the number of large normalized or standard-
cators of the factor to which it was assigned (representing over- ized residuals (and the absolute values of the largest ones).
fitting), and when another factor on which it should belong ex-
ists, an obverse pattern of large positive residuals will be One-Step Versus Two-Step Modeling Approaches
observed with the indicators of this factor (representing under-
fitting). As another example, indicators that are multidimen- The primary contention of this article is that much is to be
sional tend to have large normalized residuals (the result of ei- gained from separate estimation and respecification oftbe mea-
ther underfitting or overfitting) with indicators of more than one surement model prior to the simultaneous estimation of the
factor, which often represents the only large normalized resid- measurement and structural submodels. In putting forth a spe-
ual for each of these other indicators. cific two-step approach, we use the concepts of nested models,
Useful adjuncts to the pattern of residuals are similarity (or pseudo chi-square tests, and sequential chi-square difference
proportionality) coefficients (Anderson & Gerbing, 1982; tests (SCDTs) and draw on some recent work from quantitative
8. 418 JAMES C. ANDERSON AND DAVID W. GERBING
psychology (Steiger, Shapiro, & Browne, 1985). These tests en- Recommended Two-Step Modeling Approach
able a separate assessment of the adequacy of the substantive
model of interest, apart from that of the measurement model. For assessing the structural model under a two-step ap-
We first present the structural model and discuss the concept of proach, we recommend estimating a series of five nested struc-
interpretational confounding (Burt, 1973, 1976). tural models. A model, M2, is said to be nested within another
A confirmatory structural model that specifies the posited model, Mi, when its set of freely estimated parameters is a sub-
causal relations of the estimated constructs to one another can set of those estimated in M~, and this can be denoted as M2 <
be given directly from Joreskog and Sorbom (1984, p. 1.5). This M~. That is, one or more parameters that are freely estimated
model can be expressed as in M~ are constrained in M2. Typically, these parameters are
fixed at zero, although equality constraints may be imposed so
that two or more parameters are constrained to have the same
= Bn + r~ + ~', (9) value.
A saturatedstructural submodel (cf. Bentler & Bonett, 1980),
where ~1is a vector of m endogenous constructs, ~ is a vector of M,, can be defined as one in which all parameters (i.e., unidirec-
n exogenous constructs, B is an m • m matrix of coefficients tional paths) relating the constructs to one another are esti-
representing the effects of the endogenous constructs on one an- mated. Note that this model is formally equivalent to a confir-
other, r is an m • n matrix of coefficients representing the matory measurement model. Obversely, a null structural sub-
effects of the exogenous constructs on the endogenous con- model, Mn, can be defined as one in which all parameters
structs, and ~"is a vector o f m residuals (errors in equations and relating the constructs to one another are fixed at zero (i.e.,
random disturbance terms). there are no posited relations of the constructs to one another).
The definitional distinction between endogenous and exoge- A third structural submodel, Mr, represents the researcher's
nous constructs is simply that endogenous constructs have their theoretical or substantive model of interest. Finally, the struc-
causal antecedents specified within the model under consider- tural submodels Mc and Mu represent, respectively, the "next
ation, whereas the causes of exogenous constructs are outside most likely'" constrained and unconstrained alternatives from a
the model and not of present interest. Note that this distinction theoretical perspective to the substantive model of interest.
was not germane in the specification of confirmatory measure- That is, in Me, one or more parameters estimated in Mt are
ment models, given in Equation 3. Because of this, all observed constrained, whereas in M,, one or more parameters con-
measures were denoted simply as x. In contrast, when struc- strained in Mt are estimated. Given their definitions, this set of
tural models are specified, only observed measures of exoge- five structural submodels is nested in a sequence such that
nous constructs are denoted as x, whereas observed measures of Mn < M e < Mt < M, <Ms.
endogenous constructs are denoted as y. Separate measurement Under a two-step approach, a researcher could first assess
submodels are specified for x and y (cf. Joreskog & Sorbom, whether any structural model that would have acceptable good-
1984, pp. 1.5-6), which then are simultaneously estimated with ness of fit existed. This would be accomplished with a pseudo
the structural submodel. chi-square test (Bentler & Bonett, 1980), in which a pseudo chi-
In the presence of misspecification, the usual situation in square statistic is constructed from the chi-square value for Ms
practice, a one-step approach in which the measurement and (the smallest value possible for any structural model) with the
structural submodels are estimated simultaneously will suffer degrees of freedom for Mn (the largest number of degrees of
from interpretational confounding(el. Burr, 1973, 1976). Inter- freedom for any structural model). Note that Ms and M, need
pretational confounding "occurs as the assignment of empirical not be estimated, because Ms is equivalent to the final measure-
ment model, and only the associated degrees of freedom for Mn
meaning to an unobserved variable which is other than the
are needed, lfthis pseudo chi-square statistic is significant, then
meaning assigned to it by an individual a priori to estimating
no structural model would give acceptable fit, because it would
unknown parameters" (Burr, 1976, p. 4). Furthermore, this
have a ehi-square value greater than or equal to the value for Ms
empirically defined meaning may change considerably, depend-
with fewer degrees of freedom than for Mn. Significance, then,
ing on the specification of free and constrained parameters for would suggest a fundamental misspecification of the measure-
the structural submodel. Interpretational confounding is re- ment model needs to be remedied, rather than a need to esti-
flected by marked changes in the estimates of the pattern co- mate additional structural models. A researcher using a one-
efficients when alternate structural models are estimated. step approach would not know this.
The potential for interpretational confounding is minimized Sequential chi-square difference tests (SCDTs). Continuing
by prior separate estimation of the measurement model be- with the two-step approach, a researcher would next estimate
cause no constraints are placed on the structural parameters Me, Mt and M,, obtaining a likelihood ratio chi-square statistic
that relate the estimated constructs to one another. Given ac- value for each. These sequential chi-square tests (SCTs) provide
ceptable unidimensional measurement, the pattern coefficients successive fit information, although these tests are not indepen-
from the measurement model should change only trivially, if at dent. A preferred approach is to employ these test statistic val-
all, when the measurement submodel and alternate structural ues and their respective degrees of freedom in a set of SCDTs
submodels are simultaneously estimated. With a one-step ap- (cf. Steiger et al., 1985), each of which is framed as a null hy-
proach, the presence of interpretational confounding may not pothesis of no significant difference between two nested struc-
be detected, resulting in fit being maximized at the expense of tural models (denoted as M2 - M~ = 0). The difference between
meaningful interpretability of the constructs. chi-square statistic values for nested models is itself asymptoti-
9. STRUCTURAL EQUATION MODELING IN PRACTICE 419
cally distributed as chi-square, with degrees of freedom equal Before continuing with this decision tree, we should mention
to the difference in degrees of freedom for the two models. In a another comparative strength of the two-step approach. Not
recent development, Steiger et al. (1985) proved analytically only does the SCDT comparison of Mt - Ms provide an assess-
that these sequential chi-square difference tests are asymptoti- ment of fit for the substantive model of interest to the estimated
cally independent. 3.4 construct covariances, but it also requires the researcher to con-
What this means is that to maintain asymptotically indepen- sider the strength of explanation of this theoretical model over
dent tests, a researcher would first use the SCDT comparison of that of a confirmatory measurement model. Comparing the de-
Mu - Ms to assess the reasonableness of the structural con- grees of freedom associated with this SCDT with the total num-
stralnts imposed by Mu on the estimated construct covariances. ber available, [(m + n)(m + n - 1)]/2, indicates this inferential
If the null hypothesis associated with this test was upheld, the strength. That is, the ability to make any causal inferences
SCDT comparison of Mt - M~ would be made. If the null hy- about construct relations from correlational data depends di-
pothesis was upheld for this test, a researcher would then pro- rectly on the available degrees of freedom. Thus, for example,
ceed to Me - M r . Each test assesses whether there is a significant a researcher who specifies a substantive model in which each
difference in explanation of the estimated construct covariances construct is related by direct causal paths to all others would
given by the two structural models. For each SCDT in which realize from this test the inability to make any causal inferences.
the associated null hypothesis was upheld, the more constrained This is because no degrees of freedom would exist for the
model of the two would be tentatively accepted. SCDT; the theoretical "causal" model is indistinguishable from
In practice, though, when this sequence of tests indicates that a confirmatory measurement model, and any causal interpreta-
M t o r Me should be accepted, a researcher would also like to tion should be carefully avoided. To the extent, however, that a
know whether or not M t o r M e also provides acceptable expla- "considerable" proportion of possible direct causal paths are
nation of the construct covarianees. That is, a researcher would specified as zero and there is acceptable fit, one can advance
like to know if the null hypothesis associated with the SCDT qualified causal interpretations.
comparison of Mr - Ms or of Me - Ms also is upheld. Note that The SCDT comparison of Mc - M t provides further under-
finding that M t - Mu and Mu - Ms are each not significant standing of the explanatory ability afforded by the theoretical
does not necessarily mean that Mt - Ms will not be significant. model of interest and, irrespective of the outcome of the
Conversely, finding that M t - M~ is significant, when M~ - Ms Mt - Ms comparison, would be considered next. Bagozzi (1984)
is not significant, does not necessarily mean that M t - Ms also recently noted the need to consider rival hypotheses in theory
will be significant. A similar situation holds for Me - Mt in rela- construction and stressed that whenever possible, these rival ex-
tion to M e - M s . Therefore, to provide a greater understanding planations should be tested within the same study. Apart from
of the acceptability of a given structural model, a researcher this but again stressing the need to assess alternative models,
would perform these additional SCDT comparisons in con- MacCallum (1986) concluded from his research on specifica-
junction with the earlier sequence of tests. tion searches that "investigators should not interpret a nonsig-
Fortunately, the SCDT comparisons of M t - M, and Me - nificant chi-square as a signal to stop a specification search"
Ms are each asymptotically independent of the chi-square test (p. 118). SCDTs are particularly well-suited for accomplishing
of Ms, which represents the baseline model. Because the SCDT these comparisons between alternative theoretical models.
value and associated degrees of freedom for Mt - M, are simply Consider first the upper branch of the decision tree in Figure
the respective sums of those for M t - M u and M~ - Ms, note 1, that is, the null hypothesis that Mt - Ms = 0 is not rejected.
that it will not, however, be independent from these tests. In Given this, when both the Me - Mt and the Me - Ms compari-
a similar way, the SCDT comparison of Me - M, will not be sons also are not significant, Me would be accepted because it
independent from the earlier sequence of three SCDT compari- is the most parsimonious structural model of the three hypothe-
sons (or from Mt - Ms). Nevertheless, the additional SCDT sized, theoretical alternatives and because it provides adequate
comparisons of Mt - Ms and Me - Ms can be usefully inter- explanation of the estimated construct covariances. When ei-
spersed with the earlier sequence of SCDT comparisons to pro-
vide a decision-tree framework that enables a better under- 3 Steiger et al. (1985) developed these analytic results within the con-
standing of which, if any, of the three alternative theoretical text of exploratory maximum likelihood factor analysis, in which the
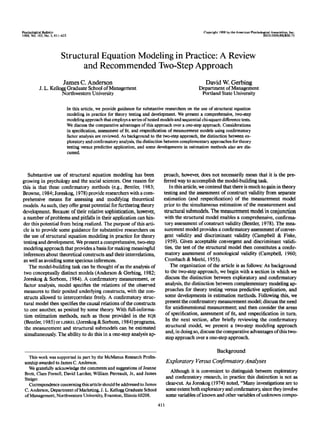
models should be accepted. We present: one decision-tree question of interest is the number of factors that best represents a given
framework for this set of SCDT comparisons in Figure 1. covariance matrix. However,their derivations were developed for a gen-
A decision-treeframework. As can be seen from Figure 1, eral discrepancy function, of which the fit function used in confirma-
under this decision-tree framework, a researcher would first per- tory analyses of covariance structures (of. Browne, 1984; Joreskog,
form the SCDT of Mr - Ms. This SCDT provides an asymptoti- 1978) is a special case. Their results even extend to situations in which
cally independent assessment of the theoretical model's expla- the null hypothesis need not be true. In such situations, the SCDTs will
nation of the relations of the estimated constructs to one an- still be asymptotically independent but asymptotically distributed as
noncentral chi-square variates.
other. In other words, one can make an asymptotically 4 A recent development in the EQS program (Bentler, 1986a) is the
independent test of nomological validity. Note that because provision of Wald tests and Lagrange multiplier tests (cf. Buse, 1982),
M t - Ms is asymptotically independent of Ms, a researcher can each of which is asymptotically equivalent to chi-square difference tests.
build a measurement model that has the best fit from a content This allows a researcher, within a single computer run, to obtain overall
and statistical standpoint, where respecification may have been goodness-of-fit information that is asymptotically equivalent to what
employed to accomplish this, and still provide a statistical as- would be obtained from separate SCDT comparisons of Mc and Mu
sessment of the adequacy of the theoretical model of interest. with the specified model, Mr.
10. 420 JAMES C. ANDERSON AND DAVID W. GERBING
ns ,. Accept M c
y Mc isigiRS
j Mc Mt
rls _--
~/~O'~'~ Mt . M u ~@~,.~.~0 Accept M t
Ml - Ms
Accept M u
ns
- Ms " Accept Me
~ M c - Mt
Mo I s'gn
~/~o"~'~ Mt . M u ns - Respecify M u as alternate model, Mu" ;
~then M - M u, a
t
Mu. Ms ns ._ Accept Mu
Helax . . .
. . . c~nstralnt in M u that is
"next-most-likely," model Mu2 ;
then Mu 2 - Ms a
Figure I. A decision-tree framework for the set of sequential chi-square difference tests (SCDTs). Mt =
theoretical model of interest; Ms = measurement (or "saturated") model; Mc and M. = next most likely
constrained and unconstrained structural models, respectively;ns and sign indicate that the null hypothesis
for each SCDT is not or is rejected, respectively, at the specified probability level (e.g., .05).
~The modeling approach shifts from being confirmatory to being increasingly exploratory.
ther Me - Mt or Mc - Ms is significant, the M t - M~ comparison some alternative structural model, M.,, such that M t < M.,. Put
would be assessed next. If this SCDT is not significant, it indi- differently, in this situation, a researcher needs to reconsider the
cates that relaxing the next most likely constraint or constraints set of parameters from Mt that were freed in M~ and pursue an
from a theoretical perspective in M t does not significantly add alternative theoretical tack in specifying Mu,. Then, a researcher
to its explanation of the construct covariances, and with parsi- would perform the SCDT of M t - Mu,, and the modeling ap-
mony preferred when given no difference in explanation, Mt proach would shift from being confirmatory to being increas-
would be accepted. Obversely, a significant result would indi- ingly exploratory. In practice, a researcher might at this point
cate that the additional estimated parameter or parameters in- also constrain to zero, or "trim" any parameters from M t that
crementaUy contribute to the explanation given by M t and have nonsignificant estimates (Me). A respecification search for
would lead to the acceptance of M.. Note that because of the M., would continue until both a significant value of M t - M . ,
additive property of chi-square values and their associated de- and a nonsignificant value of M., - Ms are obtained or until
grees of freedom, one need not perform the SCDT o f M . - Ms, there are no further constrained parameters that would be theo-
which must be nonsignificant given the earlier pattern of SCDT retically meaningful to relax.
results. Before moving on to consider the M. - M, branch, we should
Consider now the lower branch of the decision tree, that is, note that even though M t - Ms is significant and M t - M. is
the null hypothesis that M t - Ms = 0 is rejected. As with the not, it is possible to obtain a SCDT value for M. - Ms that is
upper branch, when both the Me - Mt and Mc - Ms compari- not significant. Although this may not occur often in practice,
sons are not significant, a researcher would accept Me. The ex- a researcher would still not accept Mu in this situation. The ra-
planation in this situation, however, would be that one or more tionale underlying this is that, given that Nit - Ms is significant,
parameters that were being estimated in M t w e r e superfluous in there must be one or more constrained parameters in Mt that,
that they were not significantly contributing to the explanation when allowed to be unconstrained (as M.,), would provide a
of the construct covariances but were "costing" their associated significant increment in the explanation of the estimated con-
degrees of freedom. Constraining these irrelevant parameters in struct covariances over Mt; that is, the SCDT ofMt - M., would
Mc gains their associated degrees of freedom, with no apprecia- be significant. Given this and that Mu - Ms was not significant,
ble loss of fit. As a result, although M t - Ms was significant, M., - Ms must also not be significant. Therefore, Mu, would
Mc - Ms, which has essentially the same SCDT value, is not provide a significant increment in explanation over M t and
because of these additional degrees of freedom. would provide adequate explanation of the estimated construct
When either the Mr - Mt or Mc - Ms comparison is signifi- covariances.
cant, the SCDT of M t - M. is considered next. Given that The final SCDT comparison of Mu - Ms is performed when
Mt - Ms has already been found significant, a nonsignificant Mt - M. is significant (as is M t - M s ) . When this SCDT value is
value for M t - M. would indicate the need to respecify Mu as significant, a researcher would accept M.. The next most likely
11. STRUCTURAL EQUATION MODELING IN PRACTICE 421
unconstrained theoretical alternative, though less parsimonious in covariation explained. Put differently, this value would indi-
than Mt, is required for acceptable explanation of the estimated cate the practical loss of explanatory ability that resulted from
construct covariances. Finally, when Mu - Ms is significant, a constraining to zero the paths that were hypothesized as such
researcher would relax one or more parameters in Mu that is in the substantive, structural model.
"next most likely" from a theoretical perspective, yielding a Depending on the research setting, a researcher may place
model M~2, such that M~ < M~2. Then, a researcher would per- greater emphasis on the normed fit index values than on the
form the SCDT ofMu, - Ms, and as with Mt - Mu,, the model- SCDT values in making decisions about which of the alternative
ing approach would shift from being confirmatory to being in- structural models to accept. For example, a researcher may de-
creasingiy exploratory. A respecification search for Mu2 would cide to accept Mt over Mu on the basis of a practically insignifi-
continue until a nonsignificant value of Mu2 - Ms is obtained cant Atu, even though the SCDT of Mt - Mu indicates a statisti-
or until no further constrained parameters are theoretically cally significant difference between the two models. That is,
meaningful to relax. Note that the critical distinction between from a practical standpoint, the more parsimonious Mt pro-
M~2 and Mu, is that with Mu2, the respecification search contin- vides adequate explanation.
ues along the same theoretical direction, whereas with M~,, the Finally, Ato would indicate the overall percentage of ob-
respecification search calls for a change in theoretical tack. This served-measure covariation explained by the structural and
is reflected by the fact that Mu < Mu2, whereas M~ will not be measurement submodels.
nested within Mu,. Considerations in drawing causal inferences. Causal infer-
We should mention two further advantages of this two-step ences made from structural equation models must be consistent
approach over a one-step approach. Paths that are specified as with established principles of scientific inference (of. Cliff,
absent and are then supported by an SCDT also provide theo- 1983). First, models are never confirmed by data; rather, they
retical information, and this should not be overlooked. A two- gain support by failing to be disconfirmed. Although a given
step approach focuses attention on the trade-offbetween good- model has acceptable goodness of fit, other models that would
ness of fit and strength of causal inference that is implicit in a have equal fit may exist, particularly when relatively few paths
one-step approach. Adding more paths will likely improve relating the constructs to one another have been specified as
goodness of fit, but it correspondingly compromises the ability absent. Second, temporal order is not an infallible guide to
to make meaningful, causal inferences about the relations of the causal relations. An example that Cliff noted is that although
constructs to one another. As a final comparative advantage, a father's occupation preceded his child's performance on an
separate assessments of the measurement model and the struc- intelligence test and the two are correlated, this does not mean
tural model preclude having good fit of one model compensate that the father's occupation "caused" the child's intelligence.
for (and potentially mask) poor fit of the other, which can occur Third, in what is known as the nominalisticfallacy, naming
with a one-step approach. something does not necessarily mean that one understands it.
An inherent gap in meaning exists between an observed vari-
Additional Considerations in Structural able (indicator) and its corresponding, underlying construct be-
Model Interpretation cause of(a) invalidity--the observed variable measures, at least
partly, something other than what was intended--and (b) unre-
Practicalversusstatisticalsignificance. To this point, we have liability-the values of the observed variable are partly due to
considered significance only from the perspective of formal, sta- random measurement error. Finally, although use of the two-
tistical tests. As has been noted by Bentler and Bonett (1980) step approach preserves the ability to make some inferences,
and others (e.g., Joreskog, 1974), however, the value of the chi- respecification typically limits the ability to infer causal re-
square likelihood ratio statistic is directly dependent on sample lations.
size. Because of this, with large sample sizes, significant values Ideally, a researcher would want to split a sample, using one
can be obtained even though there are only trivial discrepancies half to develop a model and the other half to validate the solu-
between a model and the data. Similarly, with large sample tion obtained from the first half. (For a discussion of cross-vali-
sizes, a significant value for an SCDT may be obtained even dation for covariance structures, see Cudeck & Browne's, 1983,
when there is only a trivial difference between two nested struc- article.) However, because large samples are needed to attain
tural models' explanations of the estimated construct covari- the desirable asymptotic properties of full-information ML or
ances. Therefore, an indication of goodness of fit from a practi- GLS estimators, in practice the ability to split a sample most
cal standpoint, such as that provided by the normed fit index often will be precluded. Application of these principles will
(A) of Bentler and Bonett, is useful in conjunction with formal have the effect that, in most research situations, only qualified
statistical tests. The normed fit index, which ranges from 0 to statements of causal inference can be justified.
1, can be thought of as the percentage of observed-measure co-
variation explained by a given measurement or structural Conclusion
model (compared with an overall, null model IMp] that solely
accounts for the observed-measure variances). We have attempted to provide some guidance for substantive
Under the two-step approach, a normed fit index value would researchers regarding the construction and evaluation of struc-
be calculated in conjunction with each SCDT. As an example, tural equation models in practice. Gaining a working under-
At~would provide supplementary information on the practical standing of these relatively new, confirmatory methods can be
decrement in fit of the theoretical model of interest from that facilitated by the suggested guidelines. The primary contribu-
of the measurement model, expressed as a percentage difference tion of this article is to present a comprehensive, two-step rood-
12. 422 JAMES C. ANDERSON AND DAVID W. GERBING
cling approach that draws on past research and experience, as Bentler, P. M. (1986a). Lagrange multiplier and WaMtestsfor EQS and
well as some recent analytic developments. We have also offered EQS/PC. Los Angeles: BMDP Statistical Software.
guidance regarding the specification, assessment, and respeci- Bentler, E M. (I 986b). Structural modeling and Psychometrika: An his-
fication of confirmatory measurement models. torical perspective on growth and achievements. Psychometrika, 51,
35-51.
As we have advocated, there is much to be gained from a
Bentler, P. M., & BoneR, D. G. (1980). Significance tests and goodness-
two-step approach, compared with a one-step approach, to the of-fit in the analysis of covariance structures. PsychologicalBulletin,
model-building process. A two-step approach has a number of 88, 588-606.
comparative strengths that allow meaningful inferences to be Bentler, P. M., & Dijkstra, T. (1985). Efficient estimation via lineariza-
made. First, it allows tests of the significance for all pattern co- tion in structural models. In P. R. Krishnaiah (Ed.), Multivariate
efficients. Second, the two-step approach allows an assessment analysis--Vl(pp. 9-42). Amsterdam: Elsevier.
of whether any structural model would give acceptable fit. Bentler, P. M., & Lee, S. Y. (1983). Covariance structures under polyno-
Third, one can make an asymptotically independent test of the mial constraints: Applications to correlation and alpha-type struc-
substantive or theoretical model of interest. Related to this, tural models. Journal ofEducational Statistics, 8, 207-222, 315-317.
because a measurement model serves as the baseline model in Beran, R. (1979). Testing for ellipsoidalsymmetry of a multivariateden-
SCDTs, the significance o f the fit for it is asymptotically inde- sity. The Annals of Statistics, 7, 150-162.
Bock, R. D., & Bargmann, R. E. (1966). Analysis of covariance struc-
pendent from the SCDTs of interest. As a result, respecification
tures. Psychometrika, 31, 507-534.
can be made to achieve acceptable unidimensional construct
Browne, M, W. (1974). Generalized least squares estimators in the anal-
measurement. Finally, the two-step approach provides a partic- ysis ofcovariance structures. South African Statistical Journal, 8, 1-
ularly useful framework for formal comparisons of the substan- 24.
tive model of interest with next most likely theoretical alterna- Browne, M. W. (1982). Covarianee structures. In D. M. Hawkins (Ed.),
tives. Topics in applied multivariate analysis (pp. 72-141). Cambridge,
Structural equation modeling, properly employed, offers England: Cambridge University Press.
great potential for theory development and construct validation Browne, M. W. (1984). Asymptotically distribution-free methods for
in psychology and the social sciences. If substantive researchers the analysis ofcovariance structures. British JournalofMathematical
employ the two-step approach recommended in this article and and Statistical Psychology, 37, 62-83.
remain cognizant of the basic principles of scientific inference Burt, R. S. (1973). Confirmatory factor-analytic structures and the the-
that we have reviewed, the potential of these confirmatory ory construction process. Sociological Methods and Research, 2,
131-187.
methods can be better realized in practice.
Burr, R. S. (1976). Interpretational confounding of unobserved vari-
ables in structural equation models. Sociological Methods and Re-
search, 5, 3-52.
References Buse, A. (1982). The likelihood ratio, Wald, and Lagrange multiplier
tests: An expository note. The American Statistician, 36, 153-157.
Anderson, J. C., & Gerbing, D. W. (1982). Some methods for respecify-
Campbell, D. T. (1960). Recommendations for APA test standards re-
ing measurement models to obtain unidimensional construct mea-
garding construct, trait, or discriminant validity. American Psycholo-
surement. Journal of Marketing Research, 19, 453-460.
gist, 15, 546-553.
Anderson, J. C., & Gerbing, D. W. (1984). The effect of sampling error
Campbell, D. T., & Fiske, D. W. (1959). Convergent and discriminant
on convergence, improper solutions, and goodness-of-fit indices for
validation by the multitrait-multimethod matrix. PsychologicalBul-
maximum likelihood confirmatory factor analysis. Psychometrika,
letin, 56, 81-105.
49, 155-173.
Babakus, E., Ferguson, C. E., Jr., & Joreskog, K. G. (I 987). The sensitiv- Cattell, R. B. (1973). Personality and mood by questionnaire. San Fran-
cisco: Jossey-Bass.
ity of confirmatory maximum likelihood factor analysis to violations
of mea.surement scale and distributional assumptions. Journal of Cattell, R. B. (1978). The scientific use offactor analysis in behavioral
Marketing Research, 24, 222-228. and life sciences. New York: Plenum Press.
Bagozzi, R. P. (1983). Issues in the application of covariance structure Cliff, N. (1983). Some cautions concerning the application of causal
analysis: A further comment. Journal of Consumer Research, 9, 449- modeling methods. MultivariateBehavioralResearch, 18, 115-126.
450. Cronbach, L. J., & Meehl, P. E. (1955). Construct validityin psychologi-
Bagozzi, R. P. (1984). A prospectus for theory construction in market- cal tests. PsychologicalBulletin, 52, 281-302.
ing. Journal of Marketing, 48, 11-29. Cudeck, R., & Browne, M. W. (1983). Cross-validation of covariance
Bagozzi, R. P., & Phillips, L. W. (1982). Representing and testing organ- structures. Multivariate Behavioral Research, 18, 147-167.
izational theories: A holistic eonstrual. Administrative Science Quar- Dijkstra, T. (1983). Some comments on maximum likelihood and par-
terly, 27, 459-489. tial least squares methods. Journal of Econometrics, 22, 67-90.
Bentler, P. M. (1976). Multistructural statistical models applied to fac- Dillon, W. R., Kumar, A., & Mulani, N. (1987). Offending estimates in
tor analysis. Multivariate Behavioral Research, 11, 3-25. covariance structure analysis: Comments on the causes of and solu-
Bentler, P. M. (1978). The interdependence of theory, methodology, and tions tO Heywood cases. PsychologicalBulletin, 101, 126-135.
empirical data: Causal modeling as an approach to construct valida- Efron, B., & Gong, G. (1983). A leisurely look at the bootstrap, the
tion. In D. B. Kandel (Ed.), Longitudinal drug research (pp. 267- jackknife, and cross-validation. The American Statistician, 37, 36-
302). New York: Wiley. 48.
Bentler, P. M. (I 983). Some contributions to efficient statistics in struc- Finn, J. D. (1974). A generalmodelfor multivariate analysis. New York:
tural models: Specification and estimation of moment structures. Holt, Rinehart & Winston.
Psychometrika, 48, 493-517. Fornell, C. (1983). Issues in the application of covariance structure
Bentler, P. M. (1985). Theory and implementation of EQS: A structural analysis: A comment. Journal of Consumer Research, 9, 443-448.
equations program. Los Angeles: BMDP Statistical Software. Forneli, C., & Bookstein, E L. (1982). Two structural equation models: