This document provides tips for manually and automatically counting pedestrians and bicyclists. It discusses choosing count locations and forms, training data collectors, prioritizing data collection, reviewing automated count data, and using count data to analyze safety risks and develop models. The tips are intended to help obtain accurate and consistent pedestrian and bicycle counts.
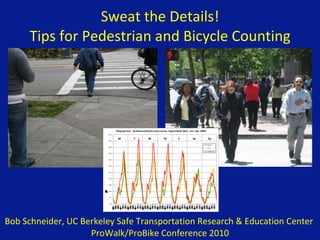
1. Sweat the Details! Tips for Pedestrian and Bicycle Counting Bob Schneider, UC Berkeley Safe Transportation Research & Education Center ProWalk/ProBike Conference 2010
23. Bicycle Turning Counts (Complex) Google Earth—Tele Atlas 2008 Right Straight Left Bicyclist Intersection Turning Counts
24. Bicycle Approach Counts (Simple) Google Earth—Tele Atlas 2008 Approaching from Leg C Bicyclist Intersection Counts
25. Bicycle Approach Counts (Simple) Google Earth—Tele Atlas 2008 Approaching from Leg C Bicyclist Intersection Counts Approaching from Leg A Approaching from Leg D Approaching from Leg B
26. Tip 3: Identify locations that need more than one data collector in advance
27.
28. Tip 4: Prioritize data items so that most important information is collected Essential Important Optional
38. Validation counts taken in Alameda County and San Francisco, CA. Included locations with different sidewalk widths, temperature, precipitation.
39. Undercounting is likely to depend on the width and design of the sidewalk in addition to the volume of pedestrians. However, this is an early attempt to develop a general conversion function.
46. Land Use Adjustment Factors Counts taken at locations with specific types of land uses were multiplied by these factors to match counts taken at “typical” Alameda County Locations (Example: Alameda County, CA)
47. Weather Adjustment Factors Counts taken under certain weather conditions were multiplied by these factors to match counts taken during “typical” Alameda County weather conditions (Example: Alameda County, CA)
48. Seasonal Adjustment Factors Counts taken during the spring were multiplied by these factors to match counts taken in Alameda County during a typical time of the year (Example: Alameda County, CA)
49. Seasonal Adjustment Factors Each month has a different proportion of the total annual pedestrian or bicycle volume (Example: National Documentation Project)
52. Alameda County Pedestrian Crash Analysis Mainline Roadway Intersecting Roadway Reported Pedestrian Crashes (1996-2005) Mission Boulevard Torrano Avenue 5 Davis Street Pierce Avenue 4 Foothill Boulevard D Street 1 Mission Boulevard Jefferson Street 5 University Avenue Bonar Street 7 International Boulevard 107th Avenue 2 San Pablo Avenue Harrison Street 2 East 14th Street Hasperian Boulevard 1 International Boulevard 46th Avenue 3 Solano Avenue Masonic Avenue 2 Broadway 12 th Street 5
53. Alameda County Pedestrian Risk Analysis Mainline Roadway Intersecting Roadway Estimated Total Weekly Pedestrian Crossings Annual Pedestrian Volume Estimate Ten-Year Pedestrian Volume Estimate Reported Pedestrian Crashes (1996-2005) Pedestrian Risk (Crashes per 10,000,000 crossings) Mission Boulevard Torrano Avenue 1,169 60,796 607,964 5 82.24 Davis Street Pierce Avenue 1,570 81,619 816,187 4 49.01 Foothill Boulevard D Street 632 32,862 328,624 1 30.43 Mission Boulevard Jefferson Street 5,236 272,246 2,722,464 5 18.37 University Avenue Bonar Street 11,175 581,113 5,811,127 7 12.05 International Boulevard 107th Avenue 3,985 207,243 2,072,429 2 9.65 San Pablo Avenue Harrison Street 4,930 256,357 2,563,572 2 7.80 East 14th Street Hasperian Boulevard 3,777 196,410 1,964,102 1 5.09 International Boulevard 46th Avenue 12,303 639,752 6,397,522 3 4.69 Solano Avenue Masonic Avenue 22,203 1,154,559 11,545,589 2 1.73 Broadway 12 th Street 112,896 5,870,590 58,705,898 5 0.85
![Pedestrian and Bicycle Counting Tips ,[object Object],[object Object],[object Object]](data:image/gif;base64,R0lGODlhAQABAIAAAAAAAP///yH5BAEAAAAALAAAAAABAAEAAAIBRAA7)