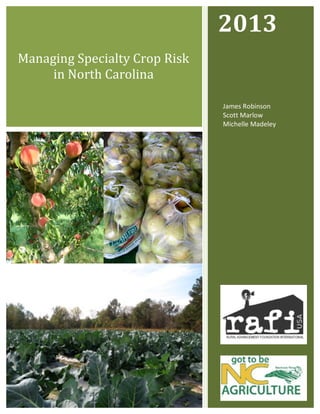
Managing Specialty Crop Risk in North Carolina 2013
•
2 likes•1,204 views

Addressing risk is critical to the survival of family farms. Specialty crops in particular face a greater challenge. Over the past year, RAFI worked with specialty crop farmers across North Carolina to research and write Managing Specialty Crop Risk in North Carolina.

Recommended
Recommended
More Related Content
What's hot
What's hot (7)
Viewers also liked
Viewers also liked (20)
Similar to Managing Specialty Crop Risk in North Carolina 2013
Similar to Managing Specialty Crop Risk in North Carolina 2013 (20)
More from RAFI-USA
More from RAFI-USA (20)
Recently uploaded
Recently uploaded (20)
Managing Specialty Crop Risk in North Carolina 2013
- 1. 2013 Managing Specialty Crop Risk in North Carolina James Robinson Scott Marlow Michelle Madeley
- 2. Thank you to the following: The research that made this report possible was generously funded by a 2011 Specialty Crop Block Grant from the North Carolina Department of Agriculture and United States Department of Agriculture. The authors of this report are extremely grateful to Debbie Hamrick and Rod Rejesus for their insightful review of the research survey. Additional thanks are due to the crop associations and organizations that distributed the research survey. A list of these organizations can be found in the appendix of this report. Finally, and most importantly, we offer our sincerest thanks to each specialty crop grower who participated in this research. By generously sharing their time, expertise and experiece, they made this research possible. The Rural Advancement Foundation International-USA (RAFI) cultivates markets, policies, and communities that support thriving, socially just, and environmentally sound family farms. Founded in 1990, RAFI traces its heritage to the National Sharecroppers’ Fund, which was founded in the 1930s by a group of bi-racial tenant farmers organizing for fair treatment. © 2013 Rural Advancement Foundation International-USA PO Box 640, Pittsboro, NC 27312 919-542-1396 www.rafiusa.org 1
- 3. Table of Contents Executive Summary ............................................................................................................................. 3 Introduction ........................................................................................................................................... 4 Research Methodology ....................................................................................................................... 5 Survey .......................................................................................................................................................... 5 Focus Groups ............................................................................................................................................... 6 Site Visits ..................................................................................................................................................... 6 Report Definitions ........................................................................................................................................ 6 Crop Insurance Overview .................................................................................................................. 8 Moral Hazard ............................................................................................................................................... 9 Specialty Crop Insurance Models .............................................................................................................. 10 Analysis of Crop Insurance Availability and Need ...................................................................................... 11 Mapping Natural Disaster Risk in North Carolina .................................................................. 14 Data and Methods ..................................................................................................................................... 14 Analysis of the Map ................................................................................................................................... 15 Additional Regional Observations ............................................................................................................. 16 Limitations of the Map .............................................................................................................................. 16 Survey Results ..................................................................................................................................... 17 Respondent Characteristics ....................................................................................................................... 17 Specialty Crop Risk Sources ....................................................................................................................... 19 Grower Knowledge of Crop Insurance ....................................................................................................... 21 Financing Specialty Crops .......................................................................................................................... 26 Production-‐Based Risk Management ........................................................................................................ 28 Case Studies ......................................................................................................................................... 29 Calderon Produce ...................................................................................................................................... 29 Justus Orchard ........................................................................................................................................... 31 Smith’s Nursery ......................................................................................................................................... 32 Parsons Farm ............................................................................................................................................. 33 Conclusions and Recommendations ............................................................................................ 34 Improving Whole-‐Farm Revenue Insurance .............................................................................................. 35 Next Steps .................................................................................................................................................. 36 Appendix ............................................................................................................................................... 38 Endnotes ............................................................................................................................................... 39 2
- 4. Executive Summary Varying types and levels of crop insurance coverage create a disparity in coverage availability that impacts farm-level decisions and farm viability. In 2011, single-crop policies covered less than half of North Carolina’s farm income from the production of specialty crops. The purpose of this research is to prioritize specialty crops for the development of crop insurance policies based on crop vulnerability to disaster losses and specialty crop producer needs, as well as identify needed reforms to existing policies. Factors that impacted need included uninsured farm income from specialty crop sales, the disaster declaration history of crop production locations, and historical variability of yield per acre. In addition, we surveyed NC specialty crop producers to assess their knowledge of currently available crop insurance policies, their experience with existing policies, and their priorities for additional policies. Surveys were distributed through existing commodity groups and farm organizations to more than 1,000 NC specialty crop producers, with 157 returned surveys. The following research findings indicate a strong need for both additional outreach and education about existing crop insurance policies and development of policies that better meet farmers’ needs. • • • • • • • Surveyed growers identified weather as the greatest risk source and excessive rain or drought as the weather events that caused the greatest financial losses. Fifty percent of surveyed growers indicated they did not know if crop insurance was available for any part of their specialty crop enterprise. Sixty-six percent of surveyed growers indicated they had little or no knowledge of crop insurance. There was a weak relationship found between knowledge of crop insurance and years farming. The relationship was also weak between knowledge of crop insurance and size of specialty crop operation. One-third of surveyed growers said that crop insurance availability plays at least a moderate role in their decision-making about what crops to grow. In 2012, $747 million in North Carolina specialty crop farm receipts went uninsurable by a single-crop policy. During focus groups and site visits, growers often identified a need for crop insurance to cover at least the cost of production. 3
- 5. Introduction Each year brings some weather event that reminds us of the inherent risk involved in growing crops. This past year was no different. In 2012, one of the worst droughts on record damaged crops across the Midwest and much of the rest of the country. One of the ways we create resiliency within agriculture and help farmers plan for these inevitable events, which damage their crops and their bottom line, is the use of crop insurance. Through crop insurance policies, farmers are able to recoup a portion of their lost income. Crop insurance options vary in several ways, including type of crop and type of loss covered. The varying types and levels of coverage create a disparity in coverage availability. Simple analysis shows that existing insurance options are not meeting the needs of specialty crop growers in North Carolina. For example, in 2011, $747 million of NC’s $1.4 billion in specialty crop farm receipts were not eligible for a single-crop policy.i In addition, Adjusted Gross Revenue-Lite (AGR-Lite), the whole-farm revenue insurance designed to insure diversified specialty crop farms, has inherent problems that resulted in extremely low policy sales. In 2012, only three policies were sold in North Carolina.ii The lack of a single-crop policy for most specialty crops combined with the underperformance of whole-farm revenue insurance results in most specialty crops going with little or no insurance coverage. This risk management void decreases specialty crop producers’ competitiveness by increasing their vulnerability to weather disasters, thereby reducing their access to credit and making operating financing more difficult to obtain. Local farmer John Vollmer called the lack of effective risk management programs “the one great undoing of our plan.” This report will focus on four issues in effort to improve future risk management programs: 1. Identify specialty crops that are most vulnerable due to the lack of crop insurance availability, 2. Identify crop insurance and risk management programs for specialty crops that can serve as models to build on, 3. Determine what farmers want in a crop insurance policy so that future crop insurance policies will provide coverage based on farmers’ needs, and 4. Use farmer input and data analysis to suggest changes to existing specialty crop insurance policies as well as propose new policies. 4
- 6. Research Methodology This research took a mixed methods approach to data collection. Specifically, data collection included an electronic and paper survey to collect quantitative data from specialty crop growers as well as focus groups and site visits to collect qualitative data. Survey RAFI’s electronic survey was administered between July 2012 and January 2013. The survey was distributed to all North Carolina Cooperative Extension county offices and 19 organizations and crop associations, 161 of which confirmed distribution of the survey (A complete list of the 16 organizations and association distributing the survey can be found in Appendix I.). This survey is estimated to have reached at least 1,000 specialty crop growers. Ultimately, 157 specialty crop growers responded to the survey. The goal of the survey was to collect quantitative data from growers on their use and knowledge of crop insurance, greatest risks related to their specialty crop operation, and ways in which crop insurance and other risk management tools could be improved to better meet their needs. Despite a wide distribution of the survey through a diverse group of organizations and associations, small-scale farms were likely over-represented. The average farm size in this survey was well below the average size of North Carolina farms, which was 170 acres in 2012.iii The research team did not use a random sample to determine survey participants because there was no identified population from which to choose a random sample. Because no sampling frame was available, we attempted to use a quota sampling method in an effort to collect our data from a representative group of North Carolina’s specialty crop farmers – i.e. the same number of small-scale, mid-scale, and large-scale farms, as well as beginning and experienced famers. However, as aforementioned, a larger number of small farmers ultimately responded to the survey, resulting in a somewhat unbalanced sample. Due to the non-random nature of the sample, extrapolating these findings to a larger population must be done cautiously. Despite this shortcoming in the data, we feel that this sample is a relatively good representation of specialty crop growers. Qualitative data collected from larger-scale farms seems to support this claim. Survey findings will be discussed in Survey Results section of this report. 1 The list of participating organizations was updated in December 2013, after the initial publication of the report in September 2013. 5
- 7. Focus Groups Focus groups were held around the state with a range of specialty crop grower subgroups. Focus groups were conducted with beginning and aspiring famers, organic growers, strawberry growers, Latino growers, Christmas tree growers, mixed vegetable growers, and grape growers, among others. Each group consisted of 3 to 8 participants. Sessions lasted between 30 minutes and 90 minutes and were recorded so that responses could be checked during analysis and report writing. The findings were used to inform interpretation of survey data as well as inform the questions asked about ways existing crop insurance policies could be improved. Qualitative data was not analyzed for frequency of specific responses, although it was clear to researchers working on the project that there were some very common experiences among growers when it came to their experience with crop insurance. Whereas the survey results provide a breadth of information about specialty crop risk management and allow for some generalizations to be made, the focus groups provide depth of information. Site Visits Before most of the surveys and focus groups were completed, eleven site visits were conducted. These visits were conducted with growers producing a range of crops, including blueberries, peaches, cucumbers, mixed vegetables and flowers, strawberries, apples, nursery crops, sweet potatoes, and tomatoes. Farms visited also represented a wide range of sizes, including farms of less than 1 acre and over 450 acres. Finally, site visits included growers from the western, piedmont, and eastern regions of North Carolina. During each site visit, a consistent series of questions were asked to gather demographic information and qualitative data about growers’ experience with crop insurance and risk management. The wide variety of crops grown by these farmers enabled RAFI to gain a sense of what specialty crops remain vulnerable under current crop insurance programs as well as hear what growers believe is needed to strengthen crop insurance programs for their crops. These site visits were considered case studies and have been used in this report to detail specific experiences with crop insurance and risk management. Four site visits, where farmers gave researchers permission to share their experience, are detailed in the Case Studies section of this report. Report Definitions Several terms will be used consistently throughout this paper and should be defined in advance so there is no confusion as to what a term means in the context of this report. 6
- 8. For this report the term “specialty crop” was used as it is defined in Specialty Crop Competitiveness Act of 2004 and the Food, Conservation, and Energy Act of 2008, meaning “fruits and vegetables, tree nuts, dried fruits, horticulture, and nursery crops (including floriculture)." In the survey we further defined it as crops “cultivated and used by people for food, medicinal purposes, and/or aesthetic gratification, with processed products constituting greater than 50% of the specialty crop by weight, exclusive of added water.” The term “small-scale producer” has been defined in many ways and there is currently not a universally accepted definition. A good definition of the term needs to incorporate farm sales, acreage, and profit as well as other factors. In order to maintain consistency within this report, the term small-scale farm is simply used to reference the fact that most survey respondents grow on 15 acres or less. This report has not tried to establish a universal definition of what a small farm is or is not. The term “beginning farmer” will be used as the USDA defines it, which is a farmer who has not owned and operated a farm or ranch for more than ten consecutive years.iv 7
- 9. Crop Insurance Overview There are several comprehensive reports on crop insurance that do an excellent job of covering the history of crop insurance and broadly discuss crop insurance problems for specialty crop growers. Among these reports are Disaster Program and the Changing Face of Agriculture,v and Ensuring the Harvest.vi While this report will provide a brief overview of crop insurance, those publications are recommended as a more comprehensive overview of the historical problems with crop insurance for specialty crop growers. This report is intended to add to the findings of these reports by providing detailed crop insurance recommendations for specialty crops in North Carolina. For the grower, crop insurance policy issues can be broken down into three basic categories: 1) the need for crop insurance, 2) the availability of existing crop insurance, and 3) the quality of existing crop insurance plans. All three of these factors, need, availability, and the quality of existing plans, vary by crop and type of specialty crop operation. For example, the amount of upfront investment required differs by crop as well as the average yield per acre. Crops that require a greater upfront investment and come with greater yield variability will increase a grower’s need for crop insurance. Crop insurance needs appear to differ based on whether or not the farm has its value spread over many crops producing in multiple seasons. Needs also differ for diversified farmers based on how their farm revenue breaks down by crop. Based on these individual circumstances, a grower may want a single crop policy, a whole-farm revenue policy, or a combination of single crop policies – to cover their highest earning crops – and a whole-farm revenue policy – to cover the rest of a grower’s crops. Crop insurance need is difficult but important to define. There is a balance with crop insurance that must be struck between not enough crop insurance, leaving a grower’s investment vulnerable, and so much crop insurance that it disincentives good farming practices. Focus group participants often said they wanted enough coverage so they could reinvest in a new production cycle without having to carry forward large amounts of debt. It is when farmers have to carry this debt from one year to the next that they run the risk of bankruptcy and losing their farm. What about crop insurance availability? In 2012, North Carolina offered crop insurance on 18 different crops and several policies for sub-varieties of those crops. Nine of these 18 were commodity crops or row crops. The other nine were specialty crops. This data is published by the USDA Risk Management Agency each year. Having a crop insurance policy does not necessarily mean a farmer’s risk management needs are met. In many cases crop insurance coverage may not be cost effective or not cover the cost of production, which can result in very low crop insurance enrollment 8
- 10. rates, particularly for AGR-Lite.vii Once farmers are informed about specific coverage, we can use participation rates as a measure of the cost-effectiveness of specific crop insurance policies. The issue of quality is closely related to availability, and the importance of quality is most apparent with whole-farm revenue crop insurance policies. For instance, AGR-Lite was created to give diversified growers the opportunity to participate in crop insurance programs without purchasing different crop insurance policies for every crop on their farm. AGR-Lite provides a farmer with benefits based on the five-year historical average of their adjusted gross income. While AGR-Lite has great potential for addressing the insurance needs of diversified and direct market producers, extremely low participation rates among eligible farmers show that there are problems with this policy that must be addressed.viii AGR-Lite is also not available to beginning farmers who do not have a five-year production history, which excludes an important group from the needed security that crop insurance provides. These problems and solutions will also be discussed in the Conclusions and Recommendations section of this report. Finally, for growers to be able to assess their crop insurance needs and the quality of existing crop insurance policies, farmers need to have a strong knowledge of crop insurance options and the coverage needs for their operation. The bottom line is that growers need accessible, quality crop insurance plans offering the amount of coverage they need. The most consistent finding during data analysis indicates that growers do not have the information needed to make informed crop insurance decisions. These results will be discussed in detail in the Survey Results section of this report. Moral Hazard Much has been written about crop insurance moral hazard. The problem is increased levels of risk tolerance in the form of reduced use of production-based risk management strategies, which results from the risk mitigation provided by crop insurance. Two of the dangers of crop insurance most cited by producers during focus groups and site visits were the possibility of fraud and the possibility that the reduced risk would result in increased production with lower levels of management. Production-based risk management holds a series of benefits, including reduced disruption of food supplies, decreased costs to the taxpayer for insurance payments, and environmental benefits from soil quality, crop diversification and other strategies. As we build the case for additional crop insurance availability for specialty crop producers, it should not be seen as a replacement for solid, production-based risk management. 9
- 11. Specialty Crop Insurance Models Before closely examining grower survey responses about crop insurance and specialty crop insurance availability, this section will examine various types of policies. Coverage level and causes of loss covered vary across current crop insurance models. Crop insurance policies can be understood by three factors: the type of losses covered (yield losses, income losses, or both); how the level of indemnity is determined (either by the farmer’s actual history or by indexing to a public level such as a county yield average); and how the damage is determined (through actual adjustment of the farmer’s crop, or by an index such as county averages.) These different models exist because, as we have seen, coverage needs vary from farm-to-farm. However, some of these models work better than others. One of the major goals of this research is to begin identifying the models that work better than others, and why they work better. Actual Production History (APH) is a multi-peril crop insurance (MPCI) policy, as are most policies, which insures against yield loss, based on the farmer’s production history, resulting from issues such as drought, excessive moisture, hail, wind, frost, or insects. Yield levels can be insured from 50-75 percent, and up to 85 percent in some areas. However, the policy also requires selecting a level of coverage, which can be between 55 and 100 percent of the crop price established annually by RMA. APH plans are available for a number of specialty crops, but availability depends on region. This model of crop insurance is common and works well in many circumstances. Farmers often use multi-peril APH crop insurance to insure single crops. Most single crop insurance policies are based on production history. However, there are problems with this model of insurance. First, it does not protect a farmer against revenue loss that is not related to yield. If the price drops or there is the loss of a market, the farmer is uncovered. Second, 85 percent coverage is often not enough to cover a farmer’s cost of production. Often 85 percent coverage will not be enough when the policy pays less than 100 percent of the RMA established crop price. Finally, APH insurance for single crops does not incentivize more diversified farming operations. Diversified farmers often report that their risk management is in their farm’s diversity, replacing the need for crop insurance. They say this because a diversified crop system means they are harvesting throughout the year, reducing vulnerability to single weather events and reducing the impact of a single risk source on a farm. Crop insurance could be used to incentivize this kind of farming by making it easier for farmers to insure multiple crops with one policy. Actual Revenue History (ARH) is also a MPCI plan but insures against loss of historical revenue rather than yield loss. The difference between APH and ARH plans is that 10
- 12. revenue insurance protects growers against losses from low yields, low prices, low crop quality, or a combination of these events. ARH provides an additional layer of protection for a farmer. If their revenue drops, even if they take the best crop of their careers out of the field, they are covered. The added protection that ARH plans provide make it desirable for many farmers, but it is also a type of policy that often insures single crops. For the same reasons APH does not incentive some production-based risk management practices, ARH single crop policies do not incentivize some production-based risk management practices that could ultimately reduce the need for indemnity payments. Whole-Farm Revenue (WFR) policies provide revenue protection for entire farms, no matter how many crops are being produced on that farm, and are based on a grower’s historical revenue. The advantages of WFR policies, including AGR and AGR-Lite, are the ability to insure a diversity of crops sold at diverse price points, and for lower insured risk as increased income from one crop offsets losses to another crop. For diversified farmers, obtaining crop insurance for every one of their many crops is impossible if the only policies available are single-crop policies. WFR policies allow farmers who sell into specialty markets, such as roadside stands or farmers markets, to insure the full retail price of their products. Levels of insurable revenue covered in both AGR and AGR-Lite are based on the average of gross farm income from the producer's last 5 Schedule F tax forms. Because these two policies work well for diversified farms, they allow farmers to diversify in a way that single crop policies of any kind cannot do. However, they are not practical for beginning farmers with less than 5 years of production history. Despite the positive aspects of both AGR and AGR-Lite, there are inherent problems with the policies that have keep the enrollment in these policies extremely low. For example, in North Carolina there were only three AGR-Lite policies sold in 2012 and AGR was not available. Specific recommendations for AGR and AGR-Lite reform are included in the Conclusions and Recommendations section of the report. Analysis of Crop Insurance Availability and Need Any list of crop insurance needs should start with a list of uninsured crops and the uninsured value of those crops. Most farmers choose to insure their crop with singlecrop policies. While whole-farm revenue insurance is available for most growers, most growers have opted not to participate due to problems with the policies and a lack of information about them. Therefore, identifying risk management gaps in agriculture still starts with identifying crops that have no single-crop policy. 11
- 13. Table 1 indicates that approximately $747 million in specialty crop receipts were uninsured by a single-crop policy in 2012. In order to add additional information about crop insurance need, the Yield Per Acre Variance indicates the amount of variance in yield per acres from 2003 to 2011. This analysis enables a comparison across crops of the amount of yield variance. The closer the coefficient of variance is to zero, the less variance there is in crop yield. The less variance there is in crop yield, the more predictable the yield between 2003 and 2011. Table 1: North Carolina’s 2012 Uninsured Specialty Cropsix 2012 Uninsured Crops Floriculture Sweet Potatoes Christmas Trees Tomatoes Bell Peppers Watermelons Cucumbers Strawberries Squash Sweet Corn Snap Beans Total 2011 Value of Production $250,495,000 $208,675,000 $75,000,000 $52,800,000 $30,134,000 $29,070,000 $27,897,000 $27,300,000 $25,740,000 $13,132,000 $7,028,000 $747,271,000.00 Yield Per Acre Variance Between 2003 and 2011 No Data .12 No Data .18 .49 .25 .11 .09 .13 .12 .24 N/A 2011 Price Per Unit/Unit N/A 17.7/Cwt N/A 37.5/Cwt 38/Cwt 15/Cwt 23.3/Cwt 140/Cwt 60/Cwt 28/Cwt 44.2/Cwt N/A 12
- 14. Table 2 lists specialty crops in North Carolina that currently have a single-crop insurance plan available. The total value of production in 2011 for these crops was approximately $136 million. However, not all of the acreage for these crops was insured. As we have seen, some farmers opt to not purchase crop insurance even when it is available. This means that even when crop insurance is available, few of the crop acres may actually be covered. For example, Table 2 shows that while 100 percent of blueberry crops are reportedly covered in North Carolina in 2012, only 21 percent of cabbage and 13 percent of grapes are covered. Table 2: North Carolina’s 2012 Insured Specialty Cropsx 2012 Insured Crops Blueberries Potatoes Apples Cabbage Peaches Grapes Total 2011 Value of Production 2012 Percentage Insured Acres $66,320,000 $24,478,000 $22,532,000 $12,827,000 $5,150,000 $5,101,000 $136,408,000.00 100% 84% 71% 21% 48% 13% N/A Yield Per Acre Variance Between 2003 and 2011 .18 .09 .24 .13 .40 .11 N/A 2011 Price Per Unit 1.83/Lb 12.3/Cwt 0.192/Lb 14.3/Cwt 1000/Ton 1030/Ton N/A 13
- 15. Mapping Natural Disaster Risk in North Carolina Risk can vary depending on the type of crop a farmer grows and the region in which a crop is grown. North Carolina, with its three distinct regions, has the potential for just about any type of weather from the mountains to the coast. Whether a farm is located in Dare or Cherokee County, there is the potential for high wind, heavy rain, excessive heat and freezing temperatures. When examined over time, historical weather data aids in identifying regional weather patterns and areas of unusually high weather risk in North Carolina. The map in this section identifies such areas of high risk and helps prioritize research areas and the questions that should be asked going forward. Data and Methods To measure physical vulnerability to natural hazards, the research team used data from USDA’s Farm Service Agency. Accordingly, this data counts the number of official disaster declarations by county, including the dates declared, the type, and the specific symptoms that affect farmers (flood, drought, hurricane, etc.). The research team used the raw number of total disasters declared, for each county, from 2008 to 2012.xi To capture the amount of specialty crop production in each North Carolina county, researchers used economic data on farm income from the North Carolina Department of Agriculture (NCDA). Each year, NCDA publishes a report with information collected in a cooperative program by NASDA enumerators who collect statistical data from both personal on-farm and telephone surveys. The research team selected Cash Receipts for “Vegetables, Fruits, Nuts, and Berries” and “Greenhouse and Nursery” crops to represent specialty crops. We used available data from 2008-2011, simply summing the yearly totals.xii 14
- 16. Map I: Specialty Crop Disaster Vulnerability By County Analysis of the Map The map layers the two data sets and illustrates the intersection between vulnerability or risk to natural hazards (physical vulnerability) and significance of specialty crop production. This map should serve as a starting point for further research, particularly research that looks at this intersection over many years, and more rigorous study into this inter-relationship. The data are imperfect estimates but give us a glimpse of this intersection. Below are some initial observations using the map. Again, these are not conclusions, but simply some preliminary observations or impressions of the lay of the land. • • The most physically vulnerable NC counties are among the counties generating the lowest level of income from specialty crops. The NC counties with the highest specialty crop income streams are generally not the highest-risk counties, but there is variability in their vulnerability. 15
- 17. • • There is also variability in the relationship between physical vulnerability and specialty crop income, especially in the counties with moderate exposure to natural hazards and meaningful income from specialty crops. The next step of this research would be to overlay production of specific crops and the most prevalent hazards by county and examine if the crops are vulnerable to the most prevalent hazards. The central region of NC (esp. Sampson, Bladen, Wilson, Wayne, Wake counties) could be called a "hot spot" where vulnerability to natural hazards meets high levels of specialty crop income, based on the last 4-5 years of data. However, this 4-5 year sample of recent data may not be representative of typical weather patterns. We cannot extrapolate using just these data, but we should begin to explore what makes this area pop on the map. Additional Regional Observations • • • • The coastal region appears to generate low specialty crop revenue, and is at risk to moderate physical vulnerability. Given the geographic exposure to hurricanes, this may be an area to dig deeper and add complexity to the map. For example, capturing “intensity” of the disaster may be an important layer to add to the disaster data set. The central region of North Carolina (esp. Sampson, Bladen, Wilson, Wayne, and Wake counties) is the "hotspot" on this map, where vulnerability to natural hazards meets high levels of specialty crop income. Western North Carolina (excluding the farthest West mountain counties) receives higher income from specialty crops and has the lowest physical risk collectively. The most Western part of North Carolina (mountain counties like Graham, Macon, Jackson) appear to be the most physically vulnerable and appear to do very little specialty crop production. Limitations of the Map There are many limitations to this map. The data for disaster declarations is a very rough approximation of physical vulnerability. We did not delineate by types or intensity of the disaster, though using the USDA’s classification system does ensure a standard of uniformity. Similarly, the data on farm income is not delineated by type of crop. So, we cannot discuss the implications for farmers who are producing specific crops. Further, some crops may suffer more from a flood than from a drought and vice versa. Finally, this four- to five-year sample is a glimpse into the recent trends, but having data from the past 10 years may provide more reliability. Future research integrating intensity of disaster event, specialty crop delineation, and a larger sample of annual data would help us begin to make conclusions about the relationship between physical vulnerability and specialty crop production. 16
- 18. Survey Results RAFI’s electronic survey was administered between July 2012 and January 2013. The survey was distributed to 19 organizations and crop associations (16 of which confirmed distribution of the survey), in addition to all North Carolina Cooperative Extension county offices. The survey is estimated to have reached at least 1,000 specialty crop growers. Ultimately, 157 specialty crop growers responded to the survey. The goal of the survey was to collect quantitative data from growers on their use and knowledge of crop insurance, greatest risks related to their specialty crop operation, and ways in which crop insurance and other risk management tools could be improved to better meet their needs. The following series of charts details the findings from the survey. Respondent Characteristics Chart 1 lists the types of specialty crops grown by survey respondents. Respondents were asked to select each crop grown on their specialty crop operation. Obviously, a very wide range of specialty crop production is represented in this report. Most growers indicated they grow multiple specialty crops. This could be one explanation for the finding that most growers in this survey do not have crop insurance. We frequently found, through conversations with growers and survey responses from highly diversified farmers, that a diversity of crops and extended harvest windows often satisfy the risk management concerns of diversified growers. What remains unclear from these responses is whether or not risk management needs are in fact met entirely through diversification. Crop insurance is likely still necessary for potential catastrophic events. Chart 1: Type of Specialty Crop Grown 70 60 50 40 30 20 0 Apples Beans (Snap, Blackberries Blueberries Broccoli Cabbage Carrots Cauliflower Celery Chive Christmas Trees Cucumbers Eggplant Garlic Grapes Herbs (including Leeks Le_uce Nursery Crops Melons (other Mushrooms Okra Onions Peas (Garden, Peaches Pecans Peppers Potatoes Radishes Raspberries Spinach Squash Strawberries Sweet Corn Sweet Potatoes Tomatoes Walnut Watermelons Other-‐ Please 10 Authors’ Analysis of Survey Data 17
- 19. Percentage of Respondents 40.0% 35.0% 30.0% 25.0% 20.0% 15.0% 10.0% 5.0% 0.0% more than 1000 acres 901 to 1000 acres 801 to 900 acres 701 to 800 acres 601 to 700 acres 501 to 600 acres 451 to 500 acres 401 to 450 acres 351 to 400 acres 301 to 350 acres 251 to 300 acres 201 to 250 acres 151 to 200 acres 101 to 150 acres 76 to 100 acres 51 to 75 acres 26 to 50 acres 21 to 25 acres 16 to 20 acres 11 to 15 acres 6 to 10 acres 1 to 5 acres Less than 1 acre None (Incubator, Barn, Chart 2 indicates the size of respondents specialty crop operation. Despite capturing a wide diversity of specialty crops grown in the survey, the average size of specialty crop operations is skewed toward the small-scale producer. Sixty percent of respondents are producing on five acres or less. Interpretation of survey results must be done with this in mind. Chart 2: Acres of Specialty Crop Operation Acres of Specialty Crop Opera<on Authors’ Analysis of Survey Data 18
- 20. Specialty Crop Risk Sources Chart 3 indicates which risk sources pose the greatest financial risk, according to respondents. Each respondent was asked to rank risk sources, with 1 indicating the greatest risk and 7 indicating the lowest risk. Weather was chosen as the greatest financial risk source, receiving an average ranking of 2.71. Pest damage was a close second with an average ranking of 2.96. Knowing that weather is the greatest risk to growers may inform the development of crop insurance policies. Weather being the greatest risk with pest management as a close second is consistent with comments made during focus group sessions. Complicating these findings, focus groups revealed that farmers often see interaction between these risk sources. For example, growers find excessive rain enhances the risk of pest damage. If a grower were to insure their crops with a weather index policy only, rain amounts may not trigger indemnity payments but do increase pest damage. This finding that risk factors interact with each other enhances the case for using multi-peril crop insurance over weather-index policies. Determining the links between risks and the level of risk is an area that needs further research. It is likely that the relationship between heavy rain and pests are not the only link. For example, one could hypothesize that when weather damage results in crop loss, labor becomes scarcer and more expensive. Chart 3: Greatest Financial Risk Sources 1= greatest risk; 7= lowest risk (scores represent the average response) Weather damage to crops 2.71 Labor costs 4.48 Pest damage to crops 2.96 Increasing operabon expenses (e.g. increased fuel prices) Food safety personal liability (i.e. outbreak on my farm) 3.88 4.61 Market disrupbon due to food safety concerns 4.71 Crop price drop 0.00 4.59 1.00 2.00 3.00 4.00 5.00 Authors’ Analysis of Survey Data 19
- 21. Given that weather is the greatest risk source for growers, it is important to break down the types of weather events that result in the greatest financial loss for specialty crop operation. Chart 4 indicates the greatest sources of weather risk, as reported by respondents. This chart shows excessive rain and drought as the two weather events resulting in the greatest financial loss. This data on excessive rain and drought provide an opportunity to begin examining how production-based risk management (i.e. increasing soil organic matter and increasing the length of harvest windows) can mitigate losses and further drive down the risk of crop loss. We find that production-based risk management is a critical component of the risk management picture and that crop insurance will not work to its full potential unless production-based risk management is incentivized in crop insurance policies. Research repeatedly indicates that taking measures to reduce exposure to excessive rain and drought through soil management can reduce a grower’s risk to crop loss.xiii Designing crop insurance policies to encourage these practices through premium incentives can ultimately reduce the need for crop insurance indemnity payments. Further research is also needed around how this could encourage the use of environmentally sound production practices. Chart 4: Weather Events Resulting in Greatest Financial Loss 1% 14% 31% 8% Excessive rain Drought Freezing temperatures Hail Fire 19% Hurricanes and high wind 27% Authors’ Analysis of Survey Data Having identified some of the greater risks that growers experience, the key question is if growers carry crop insurance policies best suited to cover their greatest risks. Survey data indicates that even when growers understand their greatest risk sources, they do not have enough information about crop insurance to identify the right plan. This 20
- 22. knowledge gap represents a significant need for outreach on assessing crop insurance policies, and could drive underutilization of available crop insurance policies. Grower Knowledge of Crop Insurance Chart 5 indicates growers’ knowledge of the existence of crop insurance coverage for any part of their specialty crop operation. Surprisingly, 50 percent of respondents indicated that they did not know if crop insurance was available for their specialty crop operation. With 50 percent unaware of crop insurance options, lack of information is an important factor in the underutilization of existing crop insurance policies. With this finding we must also examine the possibility that the skew toward small-scale producers is increasing the number of respondents who either do not know about crop insurance availability or find that it is unnecessary because risk management needs are being met through production-based risk management. Chart 5: Is Crop Insurance Available for Any Part of Your Specialty Crop Enterprise? 21.9% Yes 49.6% No Unkown 28.5% Authors’ Analysis of Survey Data 21
- 23. Chart 6 indicates respondents’ level of knowledge about crop insurance. Sixty-six percent of respondents indicated that they had no knowledge or little knowledge of crop insurance policies. Again, this finding might be due to the large number of smallscale specialty crop operations who responded to the survey. The next two charts will begin to examine how much this factors into survey results. Chart 6: Knowledge of Crop Insurance 40.0% 35.0% 35.0% 30.7% 30.0% 25.0% 20.0% 16.8% 15.0% 14.6% 10.0% 2.9% 5.0% 0.0% Not at all knowledgeable A li_le knowledgeable Moderately knowledgeable Knowledgeable Very knowledgeable Authors’ Analysis of Survey Data 22
- 24. The analysis in Chart 7 shows only a weak relationship between acres in production and knowledge of crop insurance. Chart 8 also indicates a weak relationship between knowledge of crop insurance years farming. The trend line indicates a weak relationship between crop insurance knowledge and increased acres or years farming. Were more large-scale specialty crop growers included in the survey sample, it is likely that grower reports of crop insurance would have increased slightly but Chart 7 does not give an indication that the increase would have been dramatic. Chart 7: Knowledge of Crop Insurance and Acres of Specialty Crop Production (1=Not at All Knowledgeable; 5=Very Knowledgeable) Knowledge of Crop Insurance 6 5 4 3 2 1 0 0 15 100 350 700 1000 Specialty Crop Acres Authors’ Analysis of Survey Data 23
- 25. Chart 8: Knowledge of Crop Insurance and Years Farming (1=Not at All Knowledgeable; 5=Very Knowledgeable) Knowledge of Crop Insurance 6 5 4 3 2 1 0 0 10 20 30 40 50 60 70 80 90 Years Farming Authors’ Analysis of Survey Data 24
- 26. Having established an apparently weak relationship between acres and knowledge of crop insurance, as well as years farming and knowledge of crop insurance, Chart 9 indicates respondents’ preferences for the type of crop insurance that best fits their specialty crop operation. This chart confirms that growers are not receiving enough information to make informed decisions about crop insurance. Sixty-eight percent of growers responded that they did not know which type of crop insurance policy would best fit their specialty crop operation. Chart 9: Type of Crop Insurance Best for Your Farm Operation 70.0% 60.0% 50.0% 40.0% 30.0% 20.0% 10.0% 0.0% Authors’ Analysis of Survey Data 25
- 27. Financing Specialty Crops Chart 10 indicates how growers pay for operating costs. We know from previous research that credit providers look for crop insurance as important risk mitigation for operating loans. Crop insurance serves as a guarantee that the loan will be repaired and reduces the likelihood that growers would need to use a house or land as collateral. With low rates of participation in crop insurance for specialty crops, it should be more difficult to obtain operating loans, meaning producers are either avoiding operating loans by self-financing, or accessing other forms of more expensive credit such as credit cards. Survey results indicate that thirty-four percent of respondents are operating out of their current farm cash flow and an additional 12 percent utilize farm loans. However, 51 percent of growers are dependent on off-farm income, savings or credit cards to finance the beginning of a new production cycle. Again, this finding could have been influenced by the high number of small-scale farms responding to the survey. Chart 10: How Do Growers Pay for Upfront Production Costs? 3% Credit Cards 10% Loans 12% Savings 34% 18% Operabng out of my current household cash flow Operabng out of my current farm cash flow 23% Other Authors’ Analysis of Survey Data 26
- 28. Despite the evidence that growers lack access to information about crop insurance, onethird of growers in Chart 11 indicated that crop insurance availability is at least moderately important when deciding which crops to grow. Despite the fact that crop insurance is driving crop production for one-third of growers, more than two-thirds of growers indicate that they don’t have the knowledge of crop insurance needed to make informed decisions about using crop insurance. This finding indicates that crop insurance, even among specialty crop growers, is a major factor in determining what specialty crops are grown, and helps shape North Carolina’s agricultural production. Chart 11: Importance of Crop Insurance Availability When Determining What Specialty Crops to Plant 40.0% 38.0% 35.0% 28.5% 30.0% 25.0% 20.0% 14.6% 15.0% 10.2% 10.0% 8.8% 5.0% 0.0% Unimportant Of li_le importance Moderately important Important Very important Authors’ Analysis of Survey Data 27
- 29. Production-‐Based Risk Management Chart 12 indicates how respondents manage risk other than the use of crop insurance. Respondents were given the opportunity to choose more than one response. Most growers indicated they have off-farm income to supplement farm income as a method of financial risk management. In addition, most growers indicated that they utilize crop diversification on their specialty crop enterprise as a method of production-based risk management. With high levels of use of production-based risk management strategies, there is danger that introduction of crop insurance could dis-incentivize current practices. Further research is needed on use of production-based risk management in order to quantify the risk-mitigating benefits of these methods. Further research is also needed to determine whether or not production-based risk management methods are being successfully implemented as alternatives to crop insurance. Chart 12: How Do You Manage your Specialty Crop Enterprise Risk Other Than Crop Insurance? 70.0% 60.0% 50.0% 40.0% 30.0% 20.0% Weather mibgabon (i.e. rain exclusion, frost protecbon, irrigabon Technical assistance Soil conservabon Producbon contracts Off-‐farm income Markebng contracts Crop rotabon Crop diversificabon Cost sharing (i.e. machinery cost, shared storage or processing 0.0% Save for a rainy day 10.0% Authors’ Analysis of Survey Data 28
- 30. Case Studies In addition to survey data, focus groups, and GIS analysis, the research for this report involved conducting 11 site visits on specialty crop farms. Site visits were made to farms growing blueberries, peaches, cucumbers, mixed vegetables and cut flowers, strawberries, apples, sweet potatoes, nursery crops, and tomatoes. Farms visited were producing 16 of the 17 specialty crops with reported cash receipts in the North Carolina Department of Agricultures’ 2011 Annual Statistics Book. Like the focus groups, each of these site visits provides depth to this study and serves as a case study on the use of crop insurance and other risk management tools. This section includes the story of four growers who graciously offered their stories for use in this report. Calderon Produce Martha Calderon and her family have been farming about 70 acres in Vale, North Carolina since 2010. Before owning their own farm they worked as migrant farmworkers along the east coast. They grow a variety of tomatoes, peppers, squash and pickling cucumbers. Like many farmers in North Carolina will tell you, the Calderon family farm is always just two bad seasons away from losing it all. They have seen this scenario play out for family farms around them, too. With weather being the top risk for Calderon Produce, two bad seasons can come very close together, resulting in losses completely out of their hands. Rain and hail are the top two weather related challenges for the farm. According to Martha, four straight days of rain would likely end their season. Even with their AGR-Lite coverage, bad losses in one year can mean 3 or 4 good years are needed before the resulting debt is paid back. “I was a migrant farmworker for seventeen years. I don't want to go back to that. I love farming and owning my own business. I love what I do. Crop insurance is a critical part of my risk management,” says Martha. One of the risk management tools they use to secure their farm income is AGR-Lite crop insurance. Martha says the plan needs improving and has been using the policy long enough to experience the consequences first-hand. Calderon Produce was carrying coverage based on their five-year historical revenue, 29
- 31. but decided a couple years ago the farm needed to expand because of increased demand from one of the wholesalers that purchases their produce. AGR-Lite uses a formula to determine the allowable amount of expanded revenue coverage. The single factor used to determine the allowable amount of expansion is the farmer’s history of revenue growth in the last five years. In Martha’s case, the allowed amount of expanded coverage did not cover all of her farm’s expansion. The year Calderon produce expanded their operation they also sustained crop losses due to flooding. Even with the losses due to flooding, they exceeded the revenue they had covered by AGR-Lite. Therefore, the investments they made in new acres of production where essentially uncovered by crop insurance, which forced them to carry debt forward into the next season. This debt carried from one season to the next, caused by insurance coverage levels below the cost of production, is what sets farms up for failure if two bad seasons come close together. Martha loves what she does and needs a crop insurance policy that will protect her farm we she sustains losses beyond her control. As Martha explains, “I was a migrant farmworker for seventeen years. I don't want to go back to that. I love farming and owning my own business. I love what I do. Crop insurance is a critical part of my risk management.” Reforming crop insurance so that it offers a higher level of coverage and is less confusing for everyone will help make sure Martha stays on her farm, providing food and jobs to the people in her community. 30
- 32. Justus Orchard Don Justus operates his family apple orchard in Hendersonville, NC. Along with apples, Don has begun plots of blackberries, peaches, and nectarines. The orchard is currently 50 acres and a 100 percent retail operation. Don does have crop insurance on his premium grade apples. “It’s only worth it for the premium grade apples,” he says. Having that crop insurance policy was critical for Don in 2012. Henderson County, NC saw only 20 percent of historical production in 2012, according to Don. It was a warm early spring followed by a late cold spell that damaged the young buds on his apple trees. Don says that his biggest risk management threat is weather. Frost, freeze, and hail do more damage to his crops than anything else. Don says simply, “I wouldn’t be farming without crop insurance.” Don says that his biggest risk management threat is weather. Frost, freeze, and hail do more damage to his crops than anything else. Don says simply, “I wouldn’t be farming without crop insurance.” Despite Don’s general satisfaction with his current crop insurance policy, he says it still leaves him vulnerable. If his orchard were to have a storm that caused not only yield losses, but also whole tree losses, his farm income would be at risk for years. Perennial crops like apples typically take at least 3 to 5 years before they bear a marketable fruit. If a storm killed a significant number of trees, then it could mean 3 to 5 years of income loss. Don’s specialty crop operation is clearly dependent on a risk management strategy that includes crop insurance. If we ask where his farm is most vulnerable, we find out that whole-tree losses are probably the most serious threat to the life of his farm. One way to begin solving this issue is to make available an insurance policy based on historical averages that would allow for some level of indemnity payments for the years in which new trees are growing but not yet producing. Such protection with a requirement that farmers replace lost trees could provide perennial farmers enough coverage to survive a catastrophic loss that includes loss of whole trees. 31
- 33. Smith’s Nursery Sarah Smith’s family has been in the Nursery business for 35 years. About 16 years ago they added strawberries and vegetables to their farm. In all, the farm encompasses 50 acres with two-thirds of that land in nursery crops. About three-fourths of the nursery is wholesale and twothirds of the vegetable operation is retail. Prior to growing specialty crops, her husband’s family farmed tobacco on the land. Freezing temperatures that cause superficial damage to nursery crops can dramatically reduce sales. “Customers see small areas of damage, think the plant is bad, and then don’t come back,” said Sarah. As Martha Calderon and Don Justus said, weather is the biggest risk to crops at Smith’s Nursery. Freezing temperatures are the biggest weather related risks for all their plants. But nursery crops present a unique challenge when it comes to specialty crop risk management. Freezing temperatures that cause superficial damage to nursery crops can dramatically reduce sales. “Customers see small areas of damage, think the plant is bad, and then don’t come back,” said Sarah. In other words, a plant that may have a beautiful healthy life might not be sold because of a light frost that temporarily discolors the leaves. In contrast, when freezing temperatures damage strawberry plants at the Smith Nursery, the fruit is no good and cannot be sold. Were those strawberries to be covered by a yield-based or revenuebased crop insurance plan, Smith Nursery could collect indemnity payments for that loss. But herein lies the challenge. Currently, the Smith’s do not have crop insurance, although at one time they did. “The cost of coverage and level of coverage just were not worth it,” said Sarah. Part of the challenge, as with any policy, is to create an actuarially sound policy that is also cost-effective for the farmer. Revising policies so that they provide enough coverage is one of the great challenges of crop insurance. One path forward is to use actuarial analysis to quantify the risk-mitigating benefits of some production-based risk management practices, such as the type of diversification accomplished by Smith Nursery. Such an analysis could be used to lower insurance premiums for diversified farms. 32
- 34. Parsons Farm James Parsons and his wife, Christine, along with their children, grow peaches and a few mixed vegetables in Candor, NC. They are the third generation farming their land. James says that his ancestors were farmers as far back as he could trace. James and Christine’s family certainly are part of a farming legacy and they intend to contribute to it as long as they can. Crop insurance gives their farm the resiliency needed to make sure the Parsons Farm is around as long as they want it to be. However, their current crop insurance is not providing them the coverage they need to be sure the farm can be around as long as they want it to be. This level of coverage only covers some of their upfront costs, but doesn’t get them any further. As James explains, “the insurance will cover 2 boxes a tree, but we sometimes get 12 to 15 boxes a tree in a good year.” James says, as so many other growers do, “two to three consecutive years of major losses would fold us.” The major reason behind this is the fact that the Parsons’ crop insurance does not cover their cost of production. Losses mean that they carry debt from one season to the next, a common result of As James explains, “the inadequate crop insurance and one documented insurance will cover 2 boxes a several times in this report. tree, but we sometimes get 12 to 15 boxes a tree in a good year.” James says, as so many other growers do, “two to three consecutive years of major losses would fold us.” Like Don Justus, the Parsons Farm grows mostly perennials, so the health of their farm is most in danger if they were to loose whole trees and not just one season’s crop. Solving this problem means, like it does for Don, designing an insurance plan that can keep the farm financially afloat for the three to five years it takes new trees to bear fruit. Creating this security with a wholefarm revenue policy could also enable the Parsons to diversify their farm without taking on numerous single crop insurance policies, thereby creating greater resiliency in their farm through production-based risk management. 33
- 35. Conclusions and Recommendations This research began with a focus on identifying both specialty crop vulnerability, determining what farmers want from their crop insurance policies, and using this input to suggest changes to existing policies and prioritize the development of new policies. Our research reinforces the importance of crop insurance to specialty crop producers, the need for better and expanded coverage, and finds a strong need for further outreach and education. Based on this research, we provide the following recommendations: 1. Continuing outreach and education on crop insurance and risk management options, especially as new crop insurance policies and models are brought into the marketplace, will be critical for specialty crop risk management and expansion of specialty crop production in North Carolina. Education on existing crop insurance options for specialty crop producers continues to be a barrier to participation, especially among beginning and smaller-scale producers. Early in the analysis of our data, it became clear that most specialty crop growers were reporting a lack of knowledge and information on available crop insurance. 2. With weather losses as a major risk factor, specialty crop producers require additional crop insurance options. While whole farm revenue coverage has great potential for covering diverse specialty crop income, producers wanted continued expansion of APH and APR policies for specific crops, especially at levels covering the costs of production. Many producers indicated the need for them to be able to cover their most significant crops at the cost of production. “If I have a major loss, I just want the ability to go again,” said one research participant. Uninsured crops with high levels of income include floriculture (although nurseries do have a revenue policy which covers approximately $97M in farm income), sweet potatoes, Christmas trees, and tomatoes. Crops with very high variation in yields, indicating the need for income risk mitigation, include bell peppers, watermelons and snap beans. In surveys and focus groups, producers continue to identify strawberries as a crop with significant up-front costs, a long window of investment risk, and income that is critical to their operations, and is therefore a major target for crop insurance policy development. 3. To make it a viable option for NC Specialty crop producers, whole farm revenue policies—AGR and AGR-Lite—require significant reform to make them accessible to beginning farmers and provide more cost-effective levels of coverage. Specific recommendations for reform follow in the Improving Whole-Farm Revenue Insurance section of this report. 34
- 36. 4. Analysis is needed to quantify the risk-mitigating impact of crop diversification and harvest window expansion. Many specialty crop producers are using a range of production-based risk management strategies. Many of these risk-mitigating practices are not recognized in crop insurance as either best management practices or for reduction in insurance premiums commensurate with risk reduction. Extension of crop insurance to additional crops without incentives for good production-based risk management risks dis-incentivizing best practices. Improving Whole-‐Farm Revenue Insurance Due to the underutilization of AGR-Lite in North Carolina and the potential for it to reduce risk for diversified farms, this section will list specific problems with AGR-Lite and solutions to those problems. This is not a comprehensive list of the changes that need to be made, but starting with these recommendations will begin to make this policy more accessible to beginning farmers as well as provide higher and more secure levels of coverage. Problem I: AGR-Lite does allow for up to 20 percent increases each year to be factored into anticipated revenue. However, the revenue expansion formula is based on a consistent pattern of growth. When operations expand in one year after a consistent revenue history, the AGR-Lite revenue expansion formula does not allow for the coverage of the additional expected revenue, which can leave growers underinsured. Recommendation: Calculate the value per acre using records from previous years and expand it to reflect the current year’s acreage of the crop. However, unlimited increasing of coverage for production expansion runs the risk of flooding local markets from increased production, a major concern raised by producers during focus groups and site visits. In order to prevent this unintended outcome, we propose a 10 percent limit on estimated revenue increases if no history of production expansion exists. Problem II: The level of coverage does not cover the cost of production, forcing growers to carry large debt forward after a bad year. Recommendation: The maximum coverage level should be increased to 85 percent with a payment rate option at 90 percent or 100 percent. Coverage levels could also be offered that are directly proportional to the amount of a grower’s operating loan. This would prevent growers from having to carry large amounts of debt forward after a catastrophic year and reduce the possibility that two consecutive catastrophic years would bankrupt the farm. 35
- 37. Problem III: Beginning farmers with less than 5 years of revenue history are not eligible for the policy because 5 years of historical gross revenue are required to calculate insurable revenue. Recommendation: Use Non-insured crop Assistance Program (NAP) crop yields and prices to establish a grower’s expected revenue. This can be done to build a complete history for a beginning farmer with less than 5 years of historical data and build 5 years of historical data when not all records are available. Problem IV: Premium payments do not decrease in proportion to the amount of risk reduced when growers diversify crops and livestock and/or expand harvest windows. Recommendation: By performing actuarial analysis on the impact of crop and livestock diversification as well as expanding harvest windows, reductions in a grower’s premium could be offered for the utilization of such practices. Problem V: The current definition of value-added products includes activities required to meet food safety standards and properly package crops for market. Recommendation: The material and labor costs required to move a crop from farm to market (e.g. refrigeration, washing, packing, packaging, labeling, branding, etc.) or the materials needed to accomplish these activities (e.g. vegetable ties, egg cartons, etc.) should be allowed as an adjustment to income. These basic necessities, required to market the product, should not mean the product is value-added. Next Steps Based on these conclusions, there are three steps that RAFI plans to take based on our findings. These three steps will directly address the major needs identified in this report. 1. Further farmer outreach and education about existing crop insurance options, including working directly with individual producers to test the cost effectiveness of existing crop insurance strategies, 2. Increase the level of crop insurance coverage in new and existing policies to insure producers’ cost of production, and 3. Quantify the risk-mitigating benefits of crop diversification and harvest window expansion. Farmer Outreach and Education Farmer outreach and education around crop insurance should begin with developing tools for famers that explain in plan language the amount of loss covered and the kinds of losses covered by each policy available to them. Farmers often say that if they had a significant loss, they would not be sure what percentage of their loss is actually covered. 36
- 38. One way to address this is by providing fact sheets about available policies that list the amount of loss covered as a single percentage rather than providing a coverage rate and a payment rate. A farmer tool should also provide farmers with information about the different policy options available to them. Farmers should not just know if crop insurance is available but how many policies are available to them as well as the pros and cons of each policy. These tools could be distributed to farmers around the country and survey feedback could be collected from farmers to determine the usefulness of such tools. Crop Insurance Development Three years ago, RAFI identified strawberries as an uninsured crop that farmers need insured. Strawberry farm receipts in 2011 were over $27 million and their price per unit was 140/cwt. Strawberries take a large upfront investment, but farmers get a premium price for strawberries and it is a crop that will draw customers to a farm stand, increasing the exposure of other products to potential customers. For all of these reasons, strawberry losses are particularly hard on farmers. Continuing work on the development of strawberry crop insurance is the first step in insuring crops that are currently uninsured. In addition to strawberries, growers indicated a wide variety of specialty crops that need insurance coverage. Using this farmer input and the uninsured crop charts in this report, crop insurance development can be prioritized beyond strawberry crop insurance. Whole-farm revenue insurance reform is currently underway. Whole-farm revenue insurance reform is likely to take several years and go through numerous drafts, but the end goal will be to have a policy that provides adequate coverage to farmers, including beginning and expanding farmers, and encourages crop diversification. Research Research with RMA actuaries and economists, university researchers, credit providers, and farmers over the next year will begin to provide data on the risk-mitigating impact of crop diversification and harvest window expansion. This data can then be both incorporated into new and existing crop insurance policies and used by credit providers when evaluating risk. By doing this, farmers will have greater incentive to produce crops through methods that reduce risk, rather than relying on crop insurance to reduce risk. 37
- 39. Appendix Appendix I2: Organizations & Crop Associations Distributing the Electronic Survey The survey was sent to 19 crop associations and agricultural organizations for distribution to their farmer membership. The list of 16 organizations below confirmed the distribution of the survey to their membership. Organization Appalachian Sustainable Agriculture Project Blueberry Council, NC Carolina Farm Stewardship Association Eastern Carolina Organics Herb Association, NC Growing Small Farms Listserv (Debbie Roos) North Carolina Christmas Tree Association North Carolina Commercial Flower Growers Association NC Farm Bureau North Carolina Strawberry Association North Carolina Vegetable Growers Association North Carolina Watermelon Association Nursery & Landscape Association of NC Pecan Growers Association, NC Potato Association, NC Sweet Potato Commission, NC 2 Appendix I was updated in December 2013, after the initial publication of the report in September 2013. 38
- 40. Endnotes i North Carolina Department of Agriculture & Consumer Services. 2012. 2012 Agriculture Statistics. Retrieved from http://www.ncagr.gov/stats/2012AgStat/Page013-‐036.pdf ii Federal Crop Insurance Corporation Crop Year Statistics for 2012. Retrieved from http://www3.rma.usda.gov/apps/sob/report_wait.cfm?ReportName=StateCrop&year_id=2012 &State_Cd=All&Crop_Cd=All&deltype='All'&InsPlan='Adjusted%20Gross%20Revenue%20Lite'& date=9-‐9-‐2013 iii North Carolina Department of Agriculture & Consumer Services. 2012. North Carolina Agriculture Overview. Retrieved from http://www.ncagr.gov/stats/general/overview.htm iv U.S. Department of Agriculture. 2011. Limited Resource Farmer and Rancher – (LRF/R) Beginning Famer Program Definition. Retrieved from http://www.lrftool.sc.egov.usda.gov/BFRP_Definition.aspx v Marlow, S., Justice, J., Hermann, C. 2007 Disaster Programs and the Changing Face of Agriculture. Rural Advancement Foundation International-‐USA. Retrieved from http://rafiusa.org/programs/farmsustainability/disaster-‐programs/report/ vi O’Hara, J. 2012. Ensuring the Harvest. Union of Concerned Scientists. Retrieved from http://www.ucsusa.org/assets/documents/food_and_agriculture/ensuring-‐the-‐harvest-‐full-‐ report.pdf vii Federal Crop Insurance Corporation Crop Year Statistics for 2012. Retrieved from http://www3.rma.usda.gov/apps/sob/report_wait.cfm?ReportName=StateCrop&year_id=2012 &State_Cd=All&Crop_Cd=All&deltype='All'&InsPlan='Adjusted%20Gross%20Revenue%20Lite'& date=9-‐9-‐2013 viii ibid ix North Carolina Department of Agriculture & Consumer Services. 2012. 2012 Agriculture Statistics. Retrieved from http://www.ncagr.gov/stats/2012AgStat/index.htm x ibid. xi USDA Farm Service Agency. Retrieved from https://www.fsa.usda.gov/FSA/webapp?area=home&subject=diap&topic=landing xii North Carolina Department of Agriculture & Consumer Services. 2012. 2012 Agriculture Statistics. Retrieved from http://www.ncagr.gov/stats/ xiii Magdoff, F., van Es, H. 2009. Building Soils for Better Crops, 3rd Edition. Sustainable Agriculture Research & Education Program. 39