4. The evolution of
service quality
Disconfirmation of expectations
The Nordic model
The three component model
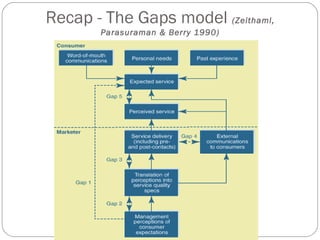
The Gaps model of service quality & SERVQUAL
6. Frequently Asked Questions
About Customer Expectations
Should a company aim to ‘delight’ the customer?
How does a company exceed customer service expectations?
Do customer service expectations continually escalate?
Is it a better strategy to under-promise and over-deliver?
How does a service company stay ahead of competition in meeting customer
expectations?
7. The Nordic model
(Gronroos 1990)
Represents the service experience on the basis of functional
and technical elements
Technical quality refers to what the customer receives from
the service
Functional quality refers to service delivery
Model emphasises companies must be careful what they
promise
11. Dual customer expectations levels
and the Zone of Tolerance
Desired Service
Zone of
Tolerance
Adequate Service
12. Zones of Tolerance for Different
Service Dimensions
DDeessiirreedd SSeerrvviiccee
Zone
of
Tolerance
AAddeeqquuaattee SSeerrvviiccee
Desired Service
Zone
of
Tolerance
Adequate Service
Reliability Tangibles
Level
of
Expectation
Source: L. L. Berry, A. Parasuraman, and V. A. Zeithaml, “Ten Lessons for Improving Service Quality,”
Marketing Science Institute, Report No. 93-104 (May 1993).
13. Factors That Influence Desired
Service
Lasting Service
Intensifiers
Lasting Service
Intensifiers
Desired Service
PPeerrssoonnaall NNeeeeddss Zone
of
Tolerance
Adequate Service
14. Factors That Influence Adequate
Service
Temporary Service
Temporary Service
Intensifiers
Intensifiers
Perceived Service
Perceived Service
Alternatives
Alternatives
Self-Perceived
Service Role
Self-Perceived
Service Role
Situational
Factors
Situational
Factors
Desired Service
Zone
of
Tolerance
Adequate Service
Predicted
Service
Predicted
Service
15. Factors That Influence Desired
and Predicted Service
Predicted
Service
Explicit Service
Promises
Implicit Service
Promises
WWoorrdd--ooff--MMoouutthh
Desired Service
Zone PPaasstt EExxppeerriieennccee
of
Tolerance
Adequate Service
16. Customer perceptions
Factors which influence consumers’ perceptions
Factors which influence satisfaction
Dimensions of service quality
Service encounters
18. Factors Influencing
Customer Satisfaction
Product/service quality
Specific product or service features
Consumer emotions
Attributions for service success or failure
19. Factors Influencing
Customer Satisfaction
Perceptions of equity or fairness
Other consumers, family members, and coworkers
Price
Personal factors
the customer’s mood or emotional state
situational factors
21. ASCI and Annual Percentage Growth
in S&P 500 Earnings
Source: C. Fornell “Customer Satisfaction and Corporate Earnings,“ commentary appearing on ACSI website, May 1, 2001,
http://www.bus.umich.edu/research/nqre/Q1-01c.html.
22. Relationship between Customer
Satisfaction and Loyalty in Competitive
Industries
Source: James L. Heskett, W. Earl Sasser, Jr., and Leonard A. Schlesinger, The Service Profit Chain, (New York, NY: The Free Press, 1997), p. 83.
23. Service Quality
The customer’s judgment of overall excellence of the service
provided in relation to the quality that was expected.
Service quality assessments are formed on judgments of:
outcome quality
interaction quality
physical environment quality
24. The SERVQUAL dimensions –
Perceived Service Quality
(Parasuraman, Zeithaml & Berry 1988)
Reliability (dependability, accurate performance)
Assurance (competence, courtesy, credibility & security)
Tangibles (appearance of physical elements)
Empathy (easy access, good communications & customer understanding)
Responsiveness (promptness & helpfulness)
25. The Five Dimensions of
Service Quality
Ability to perform the promised service
dependably and accurately.
Knowledge and courtesy of employees and their
ability to inspire trust and confidence.
Physical facilities, equipment, and appearance of
personnel.
Caring, individualized attention the firm provides
its customers.
Willingness to help customers and provide
prompt service.
Reliability
Assurance
Tangibles
Empathy
Responsiveness
26. Exercise to
Identify Service Attributes
In groups of five, choose a services industry and spend 10 minutes
brainstorming specific requirements of customers in each of the five
service quality dimensions. Be certain the requirements reflect the
customer’s point of view.
Reliability:
Assurance:
Tangibles:
Empathy:
Responsiveness
:
27. RELIABILITY
SERVQUAL Attributes
Providing service as promised
Dependability in handling customers’
service problems
Performing services right the first time
Providing services at the promised time
Maintaining error-free records
RESPONSIVENESS
Keeping customers informed as to
when services will be performed
Prompt service to customers
Willingness to help customers
Readiness to respond to customers’
requests
ASSURANCE
Employees who instill confidence in
customers
Making customers feel safe in their
transactions
Employees who are consistently courteous
Employees who have the knowledge to
answer customer questions
EMPATHY
Giving customers individual attention
Employees who deal with customers in a
caring fashion
Having the customer’s best interest at heart
Employees who understand the needs of
their customers
Convenient business hours
TANGIBLES
Modern equipment
Visually appealing facilities
Employees who have a neat,
professional appearance
Visually appealing materials associated
with the service
28. The Service Encounter is the “moment of truth”
occurs any time the customer interacts with the firm
can potentially be critical in determining customer satisfaction
and loyalty
types of encounters:
remote encounters, phone encounters, face-to-face encounters
is an opportunity to:
build trust
reinforce quality
build brand identity
increase loyalty
29. A Service Encounter Cascade
for a Hotel Visit
CChheecckk--IInn
RReeqquueesstt WWaakkee--UUpp CCaallll
CChheecckkoouutt
BBeellllbbooyy TTaakkeess ttoo RRoooomm
RReessttaauurraanntt MMeeaall
30. A Service Encounter
Cascade for an Industrial Purchase
SSaalleess CCaallll
OOrrddeerriinngg SSuupppplliieess
BBiilllliinngg
DDeelliivveerryy aanndd IInnssttaallllaattiioonn
SSeerrvviicciinngg
31. Critical Service Encounters
GORAeLs: earch
understanding actual events and behaviors that cause customer
dis/satisfaction in service encounters
METHOD:
Critical Incident Technique
DATA:
stories from customers and employees
OUTPUT:
identification of themes underlying satisfaction and dissatisfaction
with service encounters
32. Sample Questions for Critical Incidents
Technique Study
Think of a time when, as a customer, you had a particularly satisfying (dissatisfying)
interaction with an employee of ______________.
When did the incident happen?
What specific circumstances led up to this situation?
Exactly what was said and done?
What resulted that made you feel the interaction was satisfying (dissatisfying)?
33. Common Themes in Critical
Service Encounters Research
Recovery: Adaptability:
employee response
to service delivery
system failure
employee response
to customer needs
and requests
Coping: Spontaneity:
employee response
to problem customers
unprompted and
unsolicited employee
actions and attitudes
34. Recovery
DO DON’T
Acknowledge problem
Explain causes
Apologize
Compensate/upgrade
Lay out options
Take responsibility
Ignore customer
Blame customer
Leave customer to fend for
him/herself
Downgrade
Act as if nothing is wrong
“Pass the buck”
35. Adaptability
DO DON’T
Recognize the seriousness of
the need
Acknowledge
Anticipate
Attempt to accommodate
Adjust the system
Explain rules/policies
Take responsibility
Ignore
Promise, but fail to follow
through
Show unwillingness to try
Embarrass the customer
Laugh at the customer
Avoid responsibility
“Pass the buck”
36. Spontaneity
DO DON’T
Take time
Be attentive
Anticipate needs
Listen
Provide information
Show empathy
Exhibit impatience
Ignore
Yell/laugh/swear
Steal from customers
Discriminate
37. Coping
DO DON’T
Listen
Try to accommodate
Explain
Let go of the customer
Take customer’s
dissatisfaction personally
Let customer’s dissatisfaction
affect others
38. Evidence of Service from the
Customer’s Point of View
People
Contact employees
Customer
him/herself
Other customers
Process Physical
Evidence
Operational flow of
activities
Steps in process
Flexibility vs.
standard
Technology vs.
human
Tangible
communication
Servicescape
Guarantees
Technology
Website Source: From “Managing the Evidence of Service” by M. J. Bitner from The Service Quality Handbook,
eds. E. E. Scheuing and W. F. Christopher (1993), pp. 358-70.
40. InCfluuenscteso omn ceusrt oPmeerr pceercpepttiioonns osf soerfv iScee anrdv tihcee
relationships among customer satisfaction, service quality, and
individual service encounters.
Importance of customer satisfaction—what it is, the factors
that influence it, and the significant outcomes resulting from it.
Service quality and its five key dimensions: reliability,
responsiveness, empathy, assurance, and tangibles.
Service encounters or “moments of truth” are the essential
building blocks from which customers form their perceptions.
42. Factors Influencing
Customer Satisfaction
Product/service quality
Specific product or service features
Consumer emotions
Attributions for service success or failure
Perceptions of equity or fairness
Other consumers, family members, and coworkers
Price
Personal factors
the customer’s mood or emotional state
situational factors
44. ASCI and Annual Percentage Growth
in SP 500 Earnings
Source: C. Fornell “Customer Satisfaction and Corporate Earnings,“ commentary appearing on ACSI website, May 1, 2001,
http://www.bus.umich.edu/research/nqre/Q1-01c.html.
45. Relationship between Customer
Satisfaction and Loyalty in Competitive
Industries
Source: James L. Heskett, W. Earl Sasser, Jr., and Leonard A. Schlesinger, The Service Profit Chain, (New York, NY: The Free Press, 1997), p. 83.
46. Service Quality
The customer’s judgment of overall excellence of the service
provided in relation to the quality that was expected.
Service quality assessments are formed on judgments of:
outcome quality
interaction quality
physical environment quality
47. The Five Dimensions of
Service Quality
Ability to perform the promised service
dependably and accurately.
Knowledge and courtesy of employees and their
ability to inspire trust and confidence.
Physical facilities, equipment, and appearance of
personnel.
Caring, individualized attention the firm provides
its customers.
Willingness to help customers and provide
prompt service.
Reliability
Assurance
Tangibles
Empathy
Responsiveness
48. Exercise to
Identify Service Attributes
In groups of five, choose a services industry and spend 10 minutes
brainstorming specific requirements of customers in each of the five
service quality dimensions. Be certain the requirements reflect the
customer’s point of view.
Reliability:
Assurance:
Tangibles:
Empathy:
Responsiveness
:
49. SERVQUAL Attributes
RELIABILITY
Providing service as promised
Dependability in handling customers’
service problems
Performing services right the first time
Providing services at the promised time
Maintaining error-free records
RESPONSIVENESS
Keeping customers informed as to
when services will be performed
Prompt service to customers
Willingness to help customers
Readiness to respond to customers’
requests
ASSURANCE
Employees who instill confidence in
customers
Making customers feel safe in their
transactions
Employees who are consistently courteous
Employees who have the knowledge to
answer customer questions
EMPATHY
Giving customers individual attention
Employees who deal with customers in a
caring fashion
Having the customer’s best interest at heart
Employees who understand the needs of
their customers
Convenient business hours
TANGIBLES
Modern equipment
Visually appealing facilities
Employees who have a neat,
professional appearance
Visually appealing materials associated
with the service
50. The Service Encounter
is the “moment of truth”
occurs any time the customer interacts with the firm
can potentially be critical in determining customer satisfaction
and loyalty
types of encounters:
remote encounters, phone encounters, face-to-face encounters
is an opportunity to:
build trust
reinforce quality
build brand identity
increase loyalty
51. A Service Encounter Cascade
for a Hotel Visit
CChheecckk--IInn
RReeqquueesstt WWaakkee--UUpp CCaallll
CChheecckkoouutt
BBeellllbbooyy TTaakkeess ttoo RRoooomm
RReessttaauurraanntt MMeeaall
52. A Service Encounter
Cascade for an Industrial Purchase
SSaalleess CCaallll
OOrrddeerriinngg SSuupppplliieess
BBiilllliinngg
DDeelliivveerryy aanndd IInnssttaallllaattiioonn
SSeerrvviicciinngg
53. Critical Service Encounters
GORAeLs: earch
understanding actual events and behaviors that cause customer
dis/satisfaction in service encounters
METHOD:
Critical Incident Technique
DATA:
stories from customers and employees
OUTPUT:
identification of themes underlying satisfaction and dissatisfaction
with service encounters
54. Sample Questions for Critical
Incidents Technique Study
Think of a time when, as a customer, you had a particularly
satisfying (dissatisfying) interaction with an employee of
______________.
When did the incident happen?
What specific circumstances led up to this situation?
Exactly what was said and done?
What resulted that made you feel the interaction was satisfying
(dissatisfying)?
55. Common Themes in Critical
Service Encounters Research
Recovery: Adaptability:
employee response
to service delivery
system failure
employee response
to customer needs
and requests
Coping: Spontaneity:
employee response
to problem customers
unprompted and
unsolicited employee
actions and attitudes
56. Recovery
DO DON’T
Acknowledge problem
Explain causes
Apologize
Compensate/upgrade
Lay out options
Take responsibility
Ignore customer
Blame customer
Leave customer to fend for
him/herself
Downgrade
Act as if nothing is wrong
“Pass the buck”
57. Adaptability
DO DON’T
Recognize the seriousness of
the need
Acknowledge
Anticipate
Attempt to accommodate
Adjust the system
Explain rules/policies
Take responsibility
Ignore
Promise, but fail to follow
through
Show unwillingness to try
Embarrass the customer
Laugh at the customer
Avoid responsibility
“Pass the buck”
58. Spontaneity
DO DON’T
Take time
Be attentive
Anticipate needs
Listen
Provide information
Show empathy
Exhibit impatience
Ignore
Yell/laugh/swear
Steal from customers
Discriminate
59. Coping
DO DON’T
Listen
Try to accommodate
Explain
Let go of the customer
Take customer’s
dissatisfaction personally
Let customer’s dissatisfaction
affect others
60. Evidence of Service from the
Customer’s Point of View
People
Contact employees
Customer
him/herself
Other customers
Process Physical
Evidence
Operational flow of
activities
Steps in process
Flexibility vs.
standard
Technology vs.
human
Tangible
communication
Servicescape
Guarantees
Technology
Website Source: From “Managing the Evidence of Service” by M. J. Bitner from The Service Quality Handbook,
eds. E. E. Scheuing and W. F. Christopher (1993), pp. 358-70.
63. Expected
Service
Company
Perceptions of
Consumer
Expectations
Provider Gap 1
CUSTOMER
COMPANY
Listening
Gap
Part 3 Opener
64. Listening to customers through
market research
Using Marketing Research to Understand Customer
Expectations
Elements in an Effective Services Marketing Research
Program
Analyzing and Interpreting Marketing Research Findings
Model Services Marketing Research Programs
Using Marketing Research Information
Upward Communication
65. Objectives for Chapter 6:
Listening to Customers through
Research
Present the types of and guidelines for marketing research in
services.
Show how marketing research information can and should be
used for services.
Describe the strategies by which companies can facilitate
interaction and communication between management and
customers.
Present ways that companies can and do facilitate interaction
between contact people and management.
66. Common Research Objectives
for Services
To discover customer requirements or expectations for
service.
To monitor and track service performance.
To assess overall company performance compared with that of
competition.
To assess gaps between customer expectations and
perceptions.
To identify dissatisfied customers, so that service recovery can
be attempted.
To gauge effectiveness of changes in service delivery.
To appraise the service performance of individuals and teams
for evaluation, recognition, and rewards.
To determine customer expectations for a new service.
To monitor changing customer expectations in an industry.
To forecast future expectations of customers.
67. Criteria for an Effective
Service Research Program
Includes both qualitative and quantitative research
Includes both expectations and perceptions of customers
Balances the cost of the research and the value of the information
Includes statistical validity when necessary
Measures priorities or importance of attributes
Occurs with appropriate frequency
Includes measures of loyalty, behavioral intentions, or actual
behavior
68. Stages in the Research Process
Stage 1 : Define Problem
Stage 2 : Develop Measurement Strategy
Stage 3 : Implement Research Program
Stage 4 : Collect and Tabulate Data
Stage 5 : Interpret and Analyze Findings
Stage 6 : Report Findings
69. Portfolio of Services Research
Research Objective Type of Research
Customer Complaint
Solicitation
“Relationship” Surveys
Post-Transaction Surveys
Customer Focus Groups
“Mystery Shopping” of
Service Providers
Employee Surveys
Identify dissatisfied customers to attempt recovery;
identify most common categories of service failure
for remedial action
Assess company’s service performance compared to
competitors; identify service-improvement priorities;
track service improvement over time
Obtain customer feedback while service experience is
fresh; act on feedback quickly if negative patterns develop
Use as input for quantitative surveys; provide a forum
for customers to suggest service-improvement ideas
Measure individual employee service behaviors for use
in coaching, training, performance evaluation,
recognition and rewards; identify systemic strengths
and weaknesses in service
Measure internal service quality; identify employee-perceived
obstacles to improve service; track
employee morale and attitudes
Determine the reasons why customers defect
Lost Customer Research
Forecast future expectations of customers; develop
and test new service ideas
Future Expectations Research
70. Figure 6.3
Tracking of Customer Expectations
and Perceptions of Service Reliability
Source: E. Sivadas, “Europeans Have a Different Take on CS [Customer Satisfaction] Programs,” Marketing News, October 26, 1998, p. 39.
71. Figure 6.4
Service Quality Perceptions
Relative to Zones of Tolerance
9
8
7
O 6
O
5
4
3
2
1
0 Reliability Responsiveness Assurance Empathy Tangibles
Retail Chain
O O
O
O
= Zone of Tolerance = Service Quality
Perception
72. Service Quality Perceptions
Relative to Zones of Tolerance
10
8
6
4
2
0
O O O O
Reliability Responsiveness Assurance Empathy Tangibles
Computer Manufacturer
O
= Zone of Tolerance O = S.Q. Perception
73. Figure 6.5
Importance/Performance Matrix
HIGH
Importance
High
Leverage
Attributes to Improve Attributes to Maintain
Low
Leverage
Low
Leverage
Attributes to Maintain Attributes to De-emphasize
LOW Performance HIGH
Editor's Notes
Based on the disconfirmation model, these models view service quality as the gap between the expected level of service and the customer’s perceptions of the actual service received. The gaps model proposes that consumers’ overall service quality perceptions are a result of comparisons between expectations and perceptions. The higher the service quality expectation in relation to actual performance, the lower the level of perceived service quality. Similarly, the lower the expectation in relation to actual performance, the higher the level of perceived service quality. In this way the gaps model sees service quality as a disconfirmation between expectations and perceptions. The gaps model (see figure 4.2) serves as a useful diagnostic tool for evaluating why service quality is failing, and comprises two primary sections.
The first section section, comprising four gaps that are aimed at management, reflects potential service failure as a result of management’s actions. These gaps provide a framework for management to understand the causes of service quality failure. The second section, or fifth gap, occurs at the consumer level. This gap suggests that the difference between expected and perceived levels of service form consumers’ overall perception of service quality. It is this gap that is the central focus of the gaps model. It is also this gap that the SERVQUAL instrument measures
Three broad stages in consumer choice. Need recognition: physiolocical needs, safety & security needs, social needs, ego needs and self-actualisation. Different drivers that prompt consumers to move to the next stage.
Various researchers have developed models of service quality. Five of the key models include, in chronological order: the disconfirmation of expectations model (Oliver 1977, 1980, 1981); the Nordic model developed by Grönroos (1982; 1984); the SERVQUAL/Gaps model developed by Parasuraman, Zeithaml and Berry (1985, 1988, 1991); and the three-component model developed by Rust and Oliver (1994). More recently, researchers (Dabholkar, Thorpe & Rentz 1996, Brady & Cronin 2001) have focused on integrating the perspectives of these four service quality models in an effort to extend current thought in service quality into the twenty-first century. It is important that we explore each of these models so that we can see how service quality as a construct has developed over time. We begin with the disconfirmation of expectations model, which is the cornerstone of service quality research.
Student activity
Ask students to think about tertiary education. What constitutes quality in education? Ask students in groups to write down how they would assess quality in education. Provide two or three groups with overheads to write their answers on. Use the student overheads to highlight the aspects identified as you talk about each model in turn.
Much of the early service quality theory draws from research into how disconfirmed expectations affect product perceptions. That is, if our expectations are not met we change our perception and attitude toward a product. Many early models of service quality are based on the disconfirmation model used in the physical goods literature (Oliver 1977).
The disconfirmation of expectations model shown in figure 4.1 was developed from the seminal work of Oliver (1980). This model proposes three determinants of customer (dis)satisfaction: expectations, perceptions and (dis)confirmation. Using adaptation level theory as a basis, Oliver (1980) claims that customers form expectations before the purchase of a product or service, with expectations acting as a standard or frame of reference against which the service performance is judged. Within this conceptualisation, expectations form a baseline for consumers’ satisfaction levels. The higher the expectation in relation to actual performance, the greater the degree of disconfirmation and the lower the level of satisfaction to be achieved.
The model also implies that if customer expectations for a service are relatively low, then they may be satisfied with a service experience even if the performance is poor. For example, if a restaurant has a reputation for very inexpensive meals, customers will probably expect to wait or queue for a table and may not expect a high degree of personal service.
Grönroos’s (1984) model represents the service experience on the basis of functional and technical elements. The concept of technical quality refers to what the consumer receives from the service, or the outcome of the service process — for example the actual haircut from a hairdresser or legal advice from a solicitor.
The functional quality of the service refers to the way the service is delivered as reflected through the consumer’s perception of interactions that occur during the service encounter. This might include, for example, the friendliness of the hairdresser, the amount of attention given to the customer and so on. Within this model, Grönroos contends that, in forming service quality perceptions, consumers compare the expected level of service and the actual service performance they receive.
The key implication of this model for managers is the clear distinction drawn between the service itself and how it is delivered. This model emphasises that companies must be careful what they promise to consumers. The attributes and benefits popularised by companies through traditional marketing activities, such as advertising and promotion, must be realistic when compared to the service that customers eventually receive. If firms promise a level of service above what they can actually deliver, customers will be unsatisfied and unhappy with the service they receive.
The three-component model includes factors relating to the service product, service delivery and service environment, as shown in figure 4.3.
The service product is the consumer’s overall perceptions of the service offering and outcome, including any additional services that accompany its delivery. The service delivery refers to the interaction between consumers and the organisation within the service setting. Because services are intangible, variable and inseparable, the communication between provider and customer shapes the way the customer perceives the service delivery. The service environment is the internal and external environment. Literature on the internal environment focuses on the organisational culture and philosophy of management. The external environment, termed the ‘servicescape’ by Bitner (1992) reflects the setting in which the service is delivered.
The implications of this model are that organisations can target three main elements of service quality to improve their overall service quality. The model helps us to better understand how service quality works and suggests the elements on which managers should base service quality research. Management would need to develop surveys that reflect these three dimensions, in their specific industries, to properly assess consumers’ service quality perceptions.
Reliability refers to the firm’s ability to deliver a promised service dependably and accurately (Parasuraman, Zeithaml & Berry 1985). An example of this is a taxi driver arriving promptly and taking you to your destination safely and efficiently.
Assurance refers to the knowledge and courtesy of employees and their ability to inspire trust and confidence (Parasuraman, Zeithaml & Berry 1985). For example, an accountant is knowledgeable, skilled, qualified and has a good reputation.
Tangibles are the physical facilities, equipment and the appearance of staff (Parasuraman, Zeithaml & Berry 1985). For example, a hairdressing salon should be neat and tidy, employees appropriately dressed, and so on.
Responsiveness refers to the service provider’s willingness to help customers and provide prompt service (Parasuraman, Zeithaml & Berry 1985). In a dentist surgery, for example, the dentist should be accessible, there should be no waiting and staff should be willing to listen.
Empathy is demonstrated by giving caring, individualised attention to customers (Parasuraman, Zeithaml & Berry 1985). For example, employees should understand consumers’ needs, listen to their concerns and be patient.