E-shopper barometer by DPDGroup
•
0 j'aime•100 vues

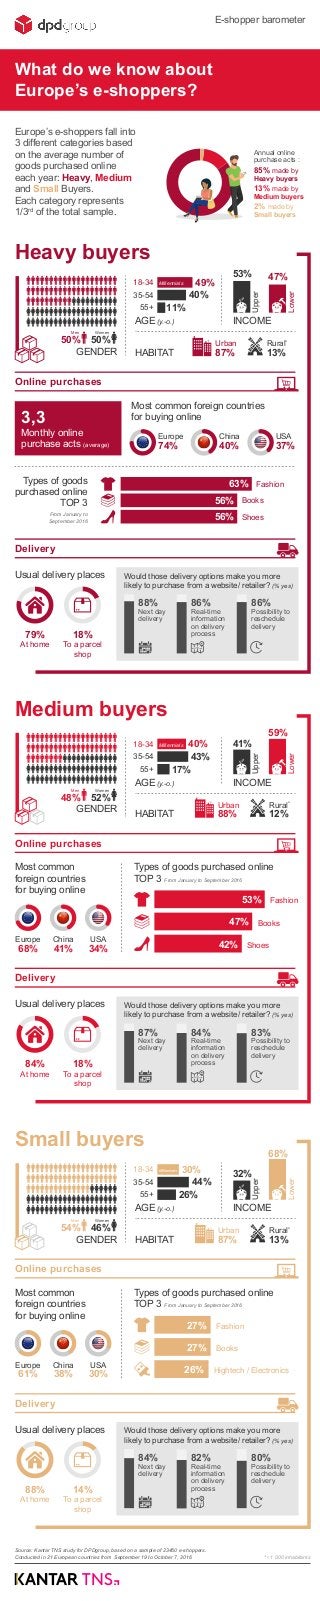
Europe’s e-shoppers fall into 3 different categories based on the average number of goods purchased online each year: Heavy, Medium and Small Buyers
Recommandé

Recommandé
Contenu connexe
Dernier
Dernier (11)
En vedette
En vedette (20)
E-shopper barometer by DPDGroup
- 1. Heavy buyers Types of goods purchased online TOP 3 From January to September 2016 Monthly online purchase acts (average) Most common foreign countries for buying online What do we know about Europe’s e-shoppers? E-shopper barometer Europe 74% China 40% USA 37% GENDER AGE (y.-o.) HABITAT INCOME Rural* 13% Urban 87% Upper Lower 53% 47% 3,3 Online purchases Online purchases Delivery 63% 56% 56% Fashion Books Shoes Hightech / Electronics Source: Kantar TNS study for DPDgroup, based on a sample of 23450 e-shoppers. Conducted in 21 European countries from September 19 to October 7, 2016 Europe’s e-shoppers fall into 3 different categories based on the average number of goods purchased online each year: Heavy, Medium and Small Buyers. Each category represents 1/3rd of the total sample. Usual delivery places 79% At home 18% To a parcel shop Would those delivery options make you more likely to purchase from a website/ retailer? (% yes) 88% Next day delivery 86% Possibility to reschedule delivery 86% Real-time information on delivery process 49% 40% 11% 18-34 35-54 55+ Millennials Medium buyers Types of goods purchased online TOP 3 From January to September 2016 Most common foreign countries for buying online Europe 68% China 41% USA 34% AGE (y.-o.) HABITAT INCOME Rural* 12% Urban 88% Upper Lower 41% 59% 53% 47% 42% Fashion Books Shoes 40% 43% 17% 18-34 35-54 55+ Millennials Delivery Usual delivery places 84% At home 18% To a parcel shop Would those delivery options make you more likely to purchase from a website/ retailer? (% yes) 87% Next day delivery 83% Possibility to reschedule delivery 84% Real-time information on delivery process Annual online purchase acts : 85% made by Heavy buyers 13% made by Medium buyers 2% made by Small buyers Online purchases Small buyers Types of goods purchased online TOP 3 From January to September 2016 Most common foreign countries for buying online Europe 61% China 38% USA 30% AGE (y.-o.) HABITAT INCOME Rural* 13% Urban 87% * < 1 000 inhabitants Upper Lower 32% 68% 27% 27% 26% Fashion Books 30% 44% 26% 18-34 35-54 55+ Millennials Delivery Usual delivery places 88% At home 14% To a parcel shop Would those delivery options make you more likely to purchase from a website/ retailer? (% yes) 84% Next day delivery 80% Possibility to reschedule delivery 82% Real-time information on delivery process 50% Men 50% Women GENDER 48% Men 52% Women GENDER 54% Men 46% Women