1. SAP BI Monitoring
In todays BI scenarios it is critical to ensure that end users retrieve up-to-date
information from the BI solution. This requires sufficient performance and
availability of all involved components. BI monitoring has the capabilities to
ensure that the involved technical systems and components are working as
expected. The BI Monitoring application is part of the Technical Monitoring
Work Center within SAP Solution Manager.
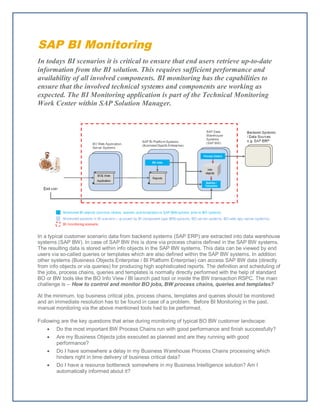
In a typical customer scenario data from backend systems (SAP ERP) are extracted into data warehouse
systems (SAP BW). In case of SAP BW this is done via process chains defined in the SAP BW systems.
The resulting data is stored within info objects in the SAP BW systems. This data can be viewed by end
users via so-called queries or templates which are also defined within the SAP BW systems. In addition
other systems (Business Objects Enterprise / BI Platform Enterprise) can access SAP BW data (directly
from info objects or via queries) for producing high sophisticated reports. The definition and scheduling of
the jobs, process chains, queries and templates is normally directly performed with the help of standard
BO or BW tools like the BO Info View / BI launch pad tool or inside the BW transaction RSPC. The main
challenge is -- How to control and monitor BO jobs, BW process chains, queries and templates?
At the minimum, top business critical jobs, process chains, templates and queries should be monitored
and an immediate resolution has to be found in case of a problem. Before BI Monitoring in the past,
manual monitoring via the above mentioned tools had to be performed.
Following are the key questions that arise during monitoring of typical BO BW customer landscape:
Do the most important BW Process Chains run with good performance and finish successfully?
Are my Business Objects jobs executed as planned and are they running with good
performance?
Do I have somewhere a delay in my Business Warehouse Process Chains processing which
hinders right in time delivery of business critical data?
Do I have a resource bottleneck somewhere in my Business Intelligence solution? Am I
automatically informed about it?
2. Did the process chain process too many/few records?
Were too many/few data packages processed in process chains?
Did the BO jobs start or finish on time (start delay and end delay)?
Are BO jobs running outside a definite time window?
Are BO jobs running into a status indicating an error or warning?
BI monitoring has the capabilities to address above questions that arise to perform end to end monitoring
of the heterogeneous BI solution landscape. Following are the highlights of capabilities offered by the BI
monitoring.
The intention of the BI Monitoring is to centrally perform proactive monitoring of Business Intelligence
solutions based on SAP BW and BOE XI including BW Process Chain and BOBJ Job Monitoring and
Alerting. The BI Monitoring application is part of the Technical Monitoring Work Center within SAP
Solution Manager.
Two monitoring levels are provided:
System level monitoring for the involved technical systems
Monitoring of important BI objects (process chains, queries, templates, BO jobs)
BI monitoring is achieved with the combination of below monitors:
BI Overview Monitor
BI Details Monitor (BO Job Monitor, BW Process Chain Monitor, BW Reporting Monitor)
BI Overview Monitor
The BI Overview Monitor shows at a glance the summary of the current status and the open alerts of all
BI components that are included in your technical scenario. With the navigation panel in the upper area
you can select one of the layers in the BI solution:
BO Web Layer (BO Web Application Systems)
BO Server Layer (BO Server systems)
BW Server Layer (BW systems)
Clicking on a component type in the BI overview monitor expands the underlying single systems and
technical instances with their separate alert and status aggregation per system resp. technical instance
BI Monitoring Prerequisites
SAP Solution Manager 7.1 and higher
Business Objects Enterprise 4.0 and
higher
SAP BW 7.0 and higher
Learn more about BI
Monitoring
http://wiki.sdn.sap.com/wiki/display/Tech
Ops/Home --> BI Monitoring
3. BO Job Monitor
Monitored jobs are grouped by the BO system they belong to and you can see the status of each
monitored metric for that job. The thresholds of the jobs to be monitored are easily configurable.
Following table gives explanation of the metrics:
Not Started on
Time
Delay in minutes of the last finished or currently running job run to the specified
threshold timestamp (today if the timestamp is already reached or yesterday
otherwise.
Out of Time
Window
Maximum distance in minutes of the last finished or currently running job run to the
specified threshold time window on the day where the window start timestamp has
the closest distance to the job start time. 0 if the job start time is > window start
time and job end resp. current time for running job is < window end time.
Duration Duration of last finished or currently running job run in minutes.
Status Status of the last finished job run (= job instance) Green if successful / Red if failed
BW Process Chain Monitor
Monitored process chains/steps are grouped by the BW system they belong to and you can see the
status of each monitored metric for the process chains. Monitoring of complete process chains as well as
single process chain steps is supported. Metrics defined for the process chains/steps are : Not Started
on Time, Out of Time Window, Duration, Status, Records Processed and Data Packages Processed .
4. BW Report Monitor
Monitored queries / templates are grouped by the BW system they belong to and you can monitor the
Average Response Time in seconds and the alerts for each BW Query or Template.
BI System Monitor Metrics
For each involved technical system the jump-in to the System Monitoring is available and provides metric
details on system level:
The system monitoring provides all general system monitoring capabilities for the underlying system plus
specific monitoring for BI specific metrics.
5. BI System Monitor metrics are classified into three categories, Availability, Performance and Exceptions.
Following table gives a summary of the metrics infrastructure for BO Web Application and BO Server
System.
Category BO Web Application System BO Server System
Availability Regular http ping check for the BO
InfoView web application (web UI for
BOE). The URL is defined during
managed system setup and stored in
the Solution Manager URL framework.
BOE Server availability metric from
Introscope (collected by BO monitoring
service and
offered via JMX)
Performance Average response time of BO web
application frontend calls (Introscope
metric)
Average response time of BO Server
Introscope metric
Exceptions Any message of type ERROR in the
BO web application log of the InfoView
webapp.
More specific ERROR patterns can be
customized by the customer based on
customer need / experience.
An inactive metric entry is available for BO
server type in the SAP template
More specific ERROR patterns can be
customized by the customer based on
customer need / experience.
As an example, the BO Server System Monitor shows the single BO Server components that are part of
your technical scenario. Each single instance of a BO Server component is shown including details like
number of alerts, availability status, performance status and exception status. BO Server metrics related
to all the BO services and servers are captured. To name a few, metrics related to Server Intelligence
Agent (SIA), Central Management Server (CMS), File Repository Server, Web Intelligence Processing
Service and so on are available. System monitoring for each system can be viewed via the system
monitoring UI or as jump in from the BI monitoring UI.
BI Alerting approach
The BI Monitoring application is tightly integrated with its specific alerts in the alert inbox including
notification management, incident management, task assignment and forwarding to 3rd party tools.