SlideShare une entreprise Scribd logo
1  sur  16
Télécharger pour lire hors ligne
February 2019 Monthly Snapshot
One-Year Change in One-Year Change in
Median Sales Price
Single Family
Median Sales Price
Condo/TIC/Coop
2
3
4
5
6
7
8
9
10
11
12
13
14
15
16
Monthly Indicators
- 11.5% + 5.3% - 2.2%
One-Year Change in
It is worthwhile to mention the weather when discussing residential real estate
for large portions of the U.S. for February 2019, because this month has turned
in some impressively cold, rainy and snowy days that have stalled some buying
and selling actions. Nevertheless, housing markets have proven to be resilient
despite predictions of a tougher year for the industry. It is still too early to say
how the entire year will play out, but economic fundamentals remain positive.
New Listings were down 30.4 percent for single family homes and 40.2 percent
for Condo/TIC/Coop properties. Pending Sales decreased 8.9 percent for single
family homes and 1.8 percent for Condo/TIC/Coop properties.
The Median Sales Price was down 11.5 percent to $1,505,000 for single family
homes but increased 5.3 percent to $1,142,500 for Condo/TIC/Coop properties.
Months Supply of Inventory increased 5.6 percent for single family units but was
down 14.8 percent for Condo/TIC/Coop units.
The National Association of REALTORS® recently reported that national
existing-home sales were down slightly during January 2019 and that pending
sales were up in year-over-year comparisons. It is worth noting that some
softening of sales was anticipated, as was a positive sales bounce during
January 2019 after a slow end to 2018. Weather-related events have hampered
some of the necessary machinations of making home sales during February
2019, yet buyers have shown determination toward achieving their
homeownership goals.
Median Sales Price
All Property Types
Residential real estate activity in San Francisco County (Districts 1-10)
composed of single-family properties, townhomes and condominiums.
Percent changes are calculated using rounded figures.
Single Family Activity Overview
Months Supply of Inventory
Current as of March 11, 2019. All data from the San Francisco MLS. Report © 2019 ShowingTime.
Condo/TIC/Coop Activity Overview
Inventory of Active Listings
% of Properties Sold Over List Price
% of List Price Received
Housing Affordability Ratio
All Properties Activity Overview
New Listings
Pending Sales
Sold Listings
Median Sales Price
Average Sales Price
Days on Market Until Sale
Activity by District
Single Family Activity Overview
Key metrics by report month and for year-to-date (YTD) starting from the first of the year.
Key Metrics Historical Sparkbars 2-2018 2-2019 Percent Change YTD 2018 YTD 2019 Percent Change
Current as of March 11, 2019. All data from the San Francisco MLS. Report © 2019 ShowingTime. | 2
Months Supply 1.8 1.9 + 5.6% -- -- --
Affordability Ratio 29 33 + 13.8%
% of List Price Received 115.8% 112.8% - 2.6% 114.1%
33
69.9% - 7.7%
- 3.9%
34 + 3.0%
109.6%
% of Properties Sold Over List Price 80.4% 78.2% - 2.7% 75.7%
Active Listings 348 343 - 1.4% --
Avg. Sales Price $2,107,409 $1,878,466 - 10.9% $1,956,868
Days on Market 22 30 + 36.4% 27 35 + 29.6%
$1,789,007
-- --
Median Sales Price $1,700,000 $1,505,000 - 11.5% $1,500,000
Sold Listings 107 110 + 2.8% 202
New Listings 207 144 - 30.4% 395
Pending Sales 158 144 - 8.9% - 5.3%245 232
- 17.5%326
209 + 3.5%
$1,460,000 - 2.7%
- 8.6%
2-2016 2-2017 2-2018 2-2019
2-2016 2-2017 2-2018 2-2019
2-2016 2-2017 2-2018 2-2019
2-2016 2-2017 2-2018 2-2019
2-2016 2-2017 2-2018 2-2019
2-2016 2-2017 2-2018 2-2019
2-2016 2-2017 2-2018 2-2019
2-2016 2-2017 2-2018 2-2019
2-2016 2-2017 2-2018 2-2019
2-2016 2-2017 2-2018 2-2019
2-2016 2-2017 2-2018 2-2019
Condo/TIC/Coop Activity Overview
Key metrics by report month and for year-to-date (YTD) starting from the first of the year.
Key Metrics Historical Sparkbars 2-2018 2-2019 Percent Change YTD 2018 YTD 2019 Percent Change
Current as of March 11, 2019. All data from the San Francisco MLS. Report © 2019 ShowingTime. | 3
Months Supply 2.7 2.3 - 14.8% -- -- --
Affordability Ratio 53 50 - 5.7%
% of List Price Received 105.1% 104.4% - 0.7% 103.7%
52
48.9% + 1.7%
- 0.7%
52 0.0%
103.0%
% of Properties Sold Over List Price 58.9% 54.4% - 7.6% 48.1%
Active Listings 654 552 - 15.6% --
Avg. Sales Price $1,264,649 $1,360,281 + 7.6% $1,288,730
Days on Market 37 40 + 8.1% 45
$1,099,000 + 0.4%
- 0.4%
46 + 2.2%
$1,284,155
-- --
Sold Listings 202 160 - 20.8% 351 274 - 21.9%
Median Sales Price $1,085,000 $1,142,500 + 5.3% $1,095,000
- 25.9%
Pending Sales 224 220 - 1.8% 404 343 - 15.1%
New Listings 356 213 - 40.2% 723 536
2-2016 2-2017 2-2018 2-2019
2-2016 2-2017 2-2018 2-2019
2-2016 2-2017 2-2018 2-2019
2-2016 2-2017 2-2018 2-2019
2-2016 2-2017 2-2018 2-2019
2-2016 2-2017 2-2018 2-2019
2-2016 2-2017 2-2018 2-2019
2-2016 2-2017 2-2018 2-2019
2-2016 2-2017 2-2018 2-2019
2-2016 2-2017 2-2018 2-2019
2-2016 2-2017 2-2018 2-2019
New Listings
New Listings
Single
Family
Year-Over-Year
Change
Condo/TIC/
Coop
Year-Over-Year
Change
Mar-2018 276 0.0% 379 +8.3%
Apr-2018 270 +9.3% 378 +32.2%
May-2018 271 -5.6% 370 +2.5%
Jun-2018 266 +11.8% 356 +13.7%
Jul-2018 240 +13.7% 259 -5.5%
Aug-2018 244 +14.0% 309 +5.5%
Sep-2018 335 +11.3% 449 +2.3%
Oct-2018 256 +7.1% 333 +1.2%
Nov-2018 153 +5.5% 188 -10.0%
Dec-2018 75 -3.8% 114 -11.6%
Jan-2019 182 -3.2% 323 -12.0%
Feb-2019 144 -30.4% 213 -40.2%
12-Month Avg 226 +3.1% 306 -0.9%
Historical New Listings by Month
Current as of March 11, 2019. All data from the San Francisco MLS. Report © 2019 ShowingTime. | 4
A count of the properties that have been newly listed on the market in a given month.
187
330
207
356
144
213
Single Family Condo/TIC/Coop
February
0
100
200
300
400
500
600
700
1-2005 1-2006 1-2007 1-2008 1-2009 1-2010 1-2011 1-2012 1-2013 1-2014 1-2015 1-2016 1-2017 1-2018 1-2019
Single Family Condo/TIC/Coop
365
659
395
723
326
536
Single Family Condo/TIC/Coop
Year to Date
2017 2018 2019
- 40.2%+ 7.9%- 30.4%+ 10.7% + 9.7%- 17.5%+ 8.2% - 25.9%
2017 2018 2019 2017 2018 2019 2017 2018 2019
- 18.0% - 11.0% + 4.3%- 2.4%
Pending Sales
Pending Sales
Single
Family
Year-Over-Year
Change
Condo/TIC/
Coop
Year-Over-Year
Change
Mar-2018 215 +0.9% 336 +10.5%
Apr-2018 207 +4.5% 287 +27.6%
May-2018 275 +14.6% 297 -2.9%
Jun-2018 203 -18.5% 302 +4.1%
Jul-2018 165 -4.6% 246 +17.7%
Aug-2018 173 -16.0% 232 +9.4%
Sep-2018 193 -5.4% 219 -10.2%
Oct-2018 251 +1.2% 291 -11.8%
Nov-2018 187 -5.6% 222 -5.1%
Dec-2018 121 +13.1% 147 -23.4%
Jan-2019 88 +1.1% 123 -31.7%
Feb-2019 144 -8.9% 220 -1.8%
12-Month Avg 185 -2.6% 244 -0.9%
Historical Pending Sales by Month
A count of the properties on which offers have been accepted in a given month.
Current as of March 11, 2019. All data from the San Francisco MLS. Report © 2019 ShowingTime. | 5
135
209
158
224
144
220
Single Family Condo/TIC/Coop
February
0
100
200
300
400
1-2005 1-2006 1-2007 1-2008 1-2009 1-2010 1-2011 1-2012 1-2013 1-2014 1-2015 1-2016 1-2017 1-2018 1-2019
Single Family Condo/TIC/Coop
228
354
245
404
232
343
Single Family Condo/TIC/Coop
Year to Date
2017 2018 2019
- 1.8%+ 7.2%- 8.9%+ 17.0% + 14.1%- 5.3%+ 7.5% - 15.1%
2017 2018 2019 2017 2018 2019 2017 2018 2019
+ 8.9% + 2.2% - 4.3%- 7.9%
Sold Listings
Sold Listings
Single
Family
Year-Over-Year
Change
Condo/TIC/
Coop
Year-Over-Year
Change
Mar-2018 200 +15.6% 289 +0.7%
Apr-2018 190 -6.4% 296 +27.6%
May-2018 249 +14.2% 312 +14.7%
Jun-2018 231 +0.4% 303 -6.5%
Jul-2018 192 -8.6% 273 +14.2%
Aug-2018 192 -9.9% 258 +17.8%
Sep-2018 146 -17.5% 183 +4.6%
Oct-2018 246 +5.1% 292 -6.1%
Nov-2018 220 -10.2% 262 -5.8%
Dec-2018 160 +7.4% 193 -22.8%
Jan-2019 99 +4.2% 114 -23.5%
Feb-2019 110 +2.8% 160 -20.8%
12-Month Avg 186 -0.8% 245 -0.1%
Historical Sold Listings by Month
A count of the actual sales that closed in a given month.
Current as of March 11, 2019. All data from the San Francisco MLS. Report © 2019 ShowingTime. | 6
111
157
107
202
110
160
Single Family Condo/TIC/Coop
February
0
100
200
300
400
1-2005 1-2006 1-2007 1-2008 1-2009 1-2010 1-2011 1-2012 1-2013 1-2014 1-2015 1-2016 1-2017 1-2018 1-2019
Single Family Condo/TIC/Coop
217
307
202
351
209
274
Single Family Condo/TIC/Coop
Year to Date
2017 2018 2019
- 20.8%+ 28.7%+ 2.8%- 3.6% + 14.3%+ 3.5%- 6.9% - 21.9%
2017 2018 2019 2017 2018 2019 2017 2018 2019
+ 8.8% + 5.3% - 3.2%- 6.5%
Median Sales Price
Median Sales Price
Single
Family
Year-Over-Year
Change
Condo/TIC/
Coop
Year-Over-Year
Change
Mar-2018 $1,687,500 +25.0% $1,250,000 +9.9%
Apr-2018 $1,648,000 +19.4% $1,250,000 +13.6%
May-2018 $1,618,888 +9.8% $1,257,500 +7.6%
Jun-2018 $1,625,000 +11.2% $1,170,000 +4.0%
Jul-2018 $1,626,250 +16.2% $1,150,000 0.0%
Aug-2018 $1,544,000 +12.3% $1,234,400 +5.1%
Sep-2018 $1,500,000 +13.6% $1,150,000 +5.0%
Oct-2018 $1,600,000 +1.6% $1,218,500 +6.9%
Nov-2018 $1,427,500 -4.5% $1,198,625 -3.1%
Dec-2018 $1,492,500 +2.9% $1,165,000 +4.0%
Jan-2019 $1,378,000 +3.6% $1,040,000 -5.5%
Feb-2019 $1,505,000 -11.5% $1,142,500 +5.3%
12-Month Avg* $1,575,000 +10.1% $1,200,000 +4.8%
Historical Median Sales Price by Month
Point at which half of the sales sold for more and half sold for less, not accounting for seller concessions, in a given month.
* Median Sales Price for all properties from March 2018 through February 2019. This is not the
average of the individual figures above.
Current as of March 11, 2019. All data from the San Francisco MLS. Report © 2019 ShowingTime. | 7
$1,290,000
$1,185,000
$1,700,000
$1,085,000
$1,505,000
$1,142,500
Single Family Condo/TIC/Coop
February
$400,000
$600,000
$800,000
$1,000,000
$1,200,000
$1,400,000
$1,600,000
$1,800,000
1-2005 1-2006 1-2007 1-2008 1-2009 1-2010 1-2011 1-2012 1-2013 1-2014 1-2015 1-2016 1-2017 1-2018 1-2019
Single Family Condo/TIC/Coop
$1,275,000
$1,100,000
$1,500,000
$1,095,000
$1,460,000
$1,099,000
Single Family Condo/TIC/Coop
Year to Date
2017 2018 2019
+ 5.3%- 8.4%- 11.5%+ 31.8% - 0.5%- 2.7%+ 17.6% + 0.4%
2017 2018 2019 2017 2018 2019 2017 2018 2019
- 7.2% + 1.2% + 0.9%+ 8.0%
Average Sales Price
Avg. Sales Price
Single
Family
Year-Over-Year
Change
Condo/TIC/
Coop
Year-Over-Year
Change
Mar-2018 $1,949,493 +3.1% $1,371,131 +6.9%
Apr-2018 $2,185,545 +16.2% $1,335,639 +3.0%
May-2018 $2,020,490 +10.1% $1,399,046 +3.9%
Jun-2018 $1,943,346 +12.5% $1,337,494 -1.0%
Jul-2018 $1,969,483 +13.3% $1,242,275 -0.1%
Aug-2018 $1,834,962 +17.6% $1,347,023 +6.1%
Sep-2018 $1,826,997 +13.4% $1,255,936 +3.2%
Oct-2018 $2,160,394 +7.9% $1,345,345 +5.5%
Nov-2018 $1,864,335 +6.2% $1,266,048 -8.7%
Dec-2018 $1,786,072 -6.4% $1,329,356 +5.2%
Jan-2019 $1,689,609 -5.5% $1,177,310 -10.9%
Feb-2019 $1,878,466 -10.9% $1,360,281 +7.6%
12-Month Avg* $1,948,835 +8.0% $1,322,946 +2.0%
Historical Average Sales Price by Month
Average sales price for all closed sales, not accounting for seller concessions, in a given month.
* Avg. Sales Price for all properties from March 2018 through February 2019. This is not the
average of the individual figures above.
Current as of March 11, 2019. All data from the San Francisco MLS. Report © 2019 ShowingTime. | 8
$1,684,181
$1,358,682
$2,107,409
$1,264,649
$1,878,466
$1,360,281
Single Family Condo/TIC/Coop
February
$500,000
$1,000,000
$1,500,000
$2,000,000
$2,500,000
1-2005 1-2006 1-2007 1-2008 1-2009 1-2010 1-2011 1-2012 1-2013 1-2014 1-2015 1-2016 1-2017 1-2018 1-2019
Single Family Condo/TIC/Coop
$1,659,253
$1,262,501
$1,956,868
$1,288,730
$1,789,007
$1,284,155
Single Family Condo/TIC/Coop
Year to Date
2017 2018 2019
+ 7.6%- 6.9%- 10.9%+ 25.1% + 2.1%- 8.6%+ 17.9% - 0.4%
2017 2018 2019 2017 2018 2019 2017 2018 2019
+ 4.5% + 4.3% + 6.0%+ 12.3%
Days on Market Until Sale
Days on Market
Single
Family
Year-Over-Year
Change
Condo/TIC/
Coop
Year-Over-Year
Change
Mar-2018 22 -29.0% 26 -18.8%
Apr-2018 18 -30.8% 26 -18.8%
May-2018 20 -16.7% 27 -18.2%
Jun-2018 18 -33.3% 27 -27.0%
Jul-2018 21 -12.5% 31 -6.1%
Aug-2018 22 -18.5% 36 -12.2%
Sep-2018 23 -17.9% 30 -28.6%
Oct-2018 24 +9.1% 27 -12.9%
Nov-2018 26 0.0% 38 +8.6%
Dec-2018 33 +17.9% 44 -2.2%
Jan-2019 40 +21.2% 55 0.0%
Feb-2019 30 +36.4% 40 +8.1%
12-Month Avg* 24 -9.6% 32 -13.0%
Historical Days on Market Until Sale by Month
Average number of days between when a property is listed and when an offer is accepted in a given month.
* Days on Market for all properties from March 2018 through February 2019. This is not the
average of the individual figures above.
Current as of March 11, 2019. All data from the San Francisco MLS. Report © 2019 ShowingTime. | 9
34
36
22
37
30
40
Single Family Condo/TIC/Coop
February
0
20
40
60
80
100
120
1-2005 1-2006 1-2007 1-2008 1-2009 1-2010 1-2011 1-2012 1-2013 1-2014 1-2015 1-2016 1-2017 1-2018 1-2019
Single Family Condo/TIC/Coop
38
47
27
45
35
46
Single Family Condo/TIC/Coop
Year to Date
2017 2018 2019
+ 8.1%+ 2.8%+ 36.4%- 35.3% - 4.3%+ 29.6%- 28.9% + 2.2%
2017 2018 2019 2017 2018 2019 2017 2018 2019
+ 9.7% + 5.6% + 20.5%+ 2.9%
Inventory of Active Listings
Active Listings
Single
Family
Year-Over-Year
Change
Condo/TIC/
Coop
Year-Over-Year
Change
Mar-2018 390 +1.0% 652 +3.2%
Apr-2018 426 +3.1% 701 +7.5%
May-2018 399 -6.6% 720 +8.9%
Jun-2018 424 +11.0% 710 +15.6%
Jul-2018 457 +17.2% 650 +7.8%
Aug-2018 478 +30.2% 660 +7.8%
Sep-2018 576 +33.3% 835 +10.4%
Oct-2018 524 +30.7% 812 +18.0%
Nov-2018 439 +36.3% 683 +14.4%
Dec-2018 298 +34.2% 466 +12.3%
Jan-2019 375 +18.7% 609 +5.4%
Feb-2019 343 -1.4% 552 -15.6%
12-Month Avg* 427 +16.4% 671 +7.9%
Historical Inventory of Active Listings by Month
The number of properties available for sale in active status at the end of a given month.
* Active Listings for all properties from March 2018 through February 2019. This is not the
average of the individual figures above.
Current as of March 11, 2019. All data from the San Francisco MLS. Report © 2019 ShowingTime. | 10
351
624
348
654
343
552
Single Family Condo/TIC/Coop
February
0
250
500
750
1,000
1,250
1,500
1-2005 1-2006 1-2007 1-2008 1-2009 1-2010 1-2011 1-2012 1-2013 1-2014 1-2015 1-2016 1-2017 1-2018 1-2019
Single Family Condo/TIC/Coop
2017 2018 2019
- 15.6%+ 4.8%- 1.4%- 0.9%
2017 2018 2019
- 5.9% + 15.8%
% of Properties Sold Over List Price
% of Properties
Sold Over List Price
Single
Family
Year-Over-Year
Change
Condo/TIC/
Coop
Year-Over-Year
Change
Mar-2018 77.5% +3.9% 59.2% -4.5%
Apr-2018 77.9% +0.8% 66.6% +7.2%
May-2018 84.7% +7.4% 67.6% +10.8%
Jun-2018 88.3% +10.4% 68.3% +16.6%
Jul-2018 85.4% +4.9% 63.4% +1.0%
Aug-2018 80.2% +2.3% 57.8% -4.8%
Sep-2018 81.5% -5.1% 63.4% +19.4%
Oct-2018 82.5% -1.6% 68.2% +2.4%
Nov-2018 73.6% -8.9% 54.2% -7.0%
Dec-2018 68.1% -7.0% 46.1% -15.3%
Jan-2019 60.6% -14.0% 41.2% +22.6%
Feb-2019 78.2% -2.7% 54.4% -7.6%
12-Month Avg 79.4% +0.1% 60.9% +3.6%
Historical % of Properties Sold Over List Price by Month
Percentage found when dividing the number of properties sold by properties sold over its original list price, not accounting for seller
concessions.
* % of Properties Sold Over List Price for all properties from March 2018 through February 2019.
This is not the average of the individual figures above.
Current as of March 11, 2019. All data from the San Francisco MLS. Report © 2019 ShowingTime. | 11
78.4%
57.3%
80.4%
58.9%
78.2%
54.4%
Single Family Condo/TIC/Coop
February
0.0%
20.0%
40.0%
60.0%
80.0%
100.0%
1-2005 1-2006 1-2007 1-2008 1-2009 1-2010 1-2011 1-2012 1-2013 1-2014 1-2015 1-2016 1-2017 1-2018 1-2019
Single Family Condo/TIC/Coop
70.5%
48.2%
75.7%
48.1%
69.9%
48.9%
Single Family Condo/TIC/Coop
Year to Date
2017 2018 2019
- 7.6%+ 2.8%- 2.7%+ 2.6% - 0.2%- 7.7%+ 7.4% + 1.7%
2017 2018 2019 2017 2018 2019 2017 2018 2019
+ 1.2% - 8.1% - 13.6%- 1.7%
% of List Price Received
% of List Price
Received
Single
Family
Year-Over-Year
Change
Condo/TIC/
Coop
Year-Over-Year
Change
Mar-2018 117.5% +4.5% 107.1% +2.1%
Apr-2018 119.3% +3.4% 108.9% +3.6%
May-2018 119.5% +3.6% 108.4% +2.8%
Jun-2018 120.1% +2.8% 107.3% +1.4%
Jul-2018 117.2% +0.1% 107.1% +1.0%
Aug-2018 114.7% -0.6% 105.7% 0.0%
Sep-2018 115.4% -0.8% 106.5% +1.6%
Oct-2018 114.0% -1.4% 107.7% +1.0%
Nov-2018 111.2% -3.7% 104.1% -0.4%
Dec-2018 110.5% -3.3% 102.1% -1.6%
Jan-2019 106.1% -5.5% 101.0% -0.7%
Feb-2019 112.8% -2.6% 104.4% -0.7%
12-Month Avg* 115.5% +0.1% 106.4% +1.2%
Historical % of List Price Received by Month
Percentage found when dividing a property’s sales price by its most recent list price, then taking the average for all properties sold in a given
month, not accounting for seller concessions.
* % of List Price Received for all properties from March 2018 through February 2019. This is not
the average of the individual figures above.
Current as of March 11, 2019. All data from the San Francisco MLS. Report © 2019 ShowingTime. | 12
113.8%
103.9%
115.8%
105.1%
112.8%
104.4%
Single Family Condo/TIC/Coop
February
110.8%
102.6%
114.1%
103.7%
109.6%
103.0%
Single Family Condo/TIC/Coop
Year to Date
90.0%
100.0%
110.0%
120.0%
130.0%
1-2005 1-2006 1-2007 1-2008 1-2009 1-2010 1-2011 1-2012 1-2013 1-2014 1-2015 1-2016 1-2017 1-2018 1-2019
Single Family Condo/TIC/Coop
2017 2018 2019
- 0.7%+ 1.2%- 2.6%+ 1.8%
2017 2018 2019
+ 1.1% - 1.9%
2017 2018 2019
- 0.7%+ 1.1%- 3.9%+ 3.0%
2017 2018 2019
- 0.9% - 2.2%
Housing Affordability Ratio
Affordability Ratio
Single
Family
Year-Over-Year
Change
Condo/TIC/
Coop
Year-Over-Year
Change
Mar-2018 29 -21.6% 46 -9.8%
Apr-2018 29 -21.6% 45 -16.7%
May-2018 30 -14.3% 44 -13.7%
Jun-2018 30 -14.3% 48 -9.4%
Jul-2018 30 -18.9% 49 -5.8%
Aug-2018 31 -18.4% 45 -13.5%
Sep-2018 31 -20.5% 47 -14.5%
Oct-2018 28 -12.5% 41 -21.2%
Nov-2018 32 -8.6% 43 -12.2%
Dec-2018 33 -5.7% 48 -9.4%
Jan-2019 36 -2.7% 54 +3.8%
Feb-2019 33 +13.8% 50 -5.7%
12-Month Avg* 31 -7.3% 36 -4.4%
Historical Housing Affordability Ratio by Month
This index measures housing affordability for the region. For example, an index of 120 means the median household income is 120% of what is
necessary to qualify for the median-priced home under prevailing interest rates. A higher number means greater affordability.
* Affordability Ratio for all properties from March 2018 through February 2019. This is not the
average of the individual figures above.
Current as of March 11, 2019. All data from the San Francisco MLS. Report © 2019 ShowingTime. | 13
39
49
29
53
33
50
Single Family Condo/TIC/Coop
February
20
40
60
80
100
1-2005 1-2006 1-2007 1-2008 1-2009 1-2010 1-2011 1-2012 1-2013 1-2014 1-2015 1-2016 1-2017 1-2018 1-2019
Single Family Condo/TIC/Coop
2017 2018 2019
- 5.7%+ 8.2%+ 13.8%- 25.6%
2017 2018 2019
+ 2.6% - 12.5%
39
53
33
52
34
52
Single Family Condo/TIC/Coop
Year to Date
2017 2018 2019
0.0%- 1.9%+ 3.0%- 15.4%
2017 2018 2019
- 7.1% - 5.4%
Months Supply of Inventory
Months Supply
Single
Family
Year-Over-Year
Change
Condo/TIC/
Coop
Year-Over-Year
Change
Mar-2018 2.0 -4.8% 2.6 -3.7%
Apr-2018 2.2 0.0% 2.8 0.0%
May-2018 2.1 -8.7% 2.8 0.0%
Jun-2018 2.2 +4.8% 2.8 +7.7%
Jul-2018 2.4 +14.3% 2.5 -3.8%
Aug-2018 2.6 +30.0% 2.6 0.0%
Sep-2018 3.1 +34.8% 3.3 +3.1%
Oct-2018 2.8 +33.3% 3.2 +14.3%
Nov-2018 2.4 +41.2% 2.7 +8.0%
Dec-2018 1.6 +33.3% 1.9 +11.8%
Jan-2019 2.0 +17.6% 2.5 +4.2%
Feb-2019 1.9 +5.6% 2.3 -14.8%
12-Month Avg* 2.3 +16.2% 2.7 +2.3%
Historical Months Supply of Inventory by Month
The inventory of homes for sale at the end of a given month, divided by the average monthly pending sales from the last 12 months.
* Months Supply for all properties from March 2018 through February 2019. This is not the
average of the individual figures above.
Current as of March 11, 2019. All data from the San Francisco MLS. Report © 2019 ShowingTime. | 14
1.9
2.7
1.8
2.7
1.9
2.3
Single Family Condo/TIC/Coop
February
0.0
2.0
4.0
6.0
8.0
10.0
1-2005 1-2006 1-2007 1-2008 1-2009 1-2010 1-2011 1-2012 1-2013 1-2014 1-2015 1-2016 1-2017 1-2018 1-2019
Single Family Condo/TIC/Coop
2017 2018 2019
- 14.8%0.0%+ 5.6%- 5.3%
2017 2018 2019
- 5.0% + 22.7%
All Properties Activity Overview
Key metrics by report month and for year-to-date (YTD) starting from the first of the year.
Key Metrics Historical Sparkbars 2-2018 2-2019 Percent Change YTD 2018 YTD 2019 Percent Change
Current as of March 11, 2019. All data from the San Francisco MLS. Report © 2019 ShowingTime. | 15
Months Supply 2.3 2.1 - 8.7% -- -- --
Affordability Ratio 37 37 0.0%
% of List Price Received 108.8% 107.8% - 0.9% 107.5%
38
58.0% - 0.3%
- 1.5%
39 + 2.6%
105.9%
% of Properties Sold Over List Price 66.3% 64.1% - 3.3% 58.2%
Active Listings 1,002 895 - 10.7% --
Avg. Sales Price $1,556,478 $1,571,394 + 1.0% $1,532,787
Days on Market 32 36 + 12.5% 38
$1,250,000 - 0.8%
- 2.0%
41 + 7.9%
$1,502,610
-- --
Sold Listings 309 270 - 12.6% 553 483 - 12.7%
Median Sales Price $1,301,000 $1,272,000 - 2.2% $1,260,000
- 22.9%
Pending Sales 382 364 - 4.7% 649 575 - 11.4%
New Listings 563 357 - 36.6% 1,118 862
2-2016 2-2017 2-2018 2-2019
2-2016 2-2017 2-2018 2-2019
2-2016 2-2017 2-2018 2-2019
2-2016 2-2017 2-2018 2-2019
2-2016 2-2017 2-2018 2-2019
2-2016 2-2017 2-2018 2-2019
2-2016 2-2017 2-2018 2-2019
2-2016 2-2017 2-2018 2-2019
2-2016 2-2017 2-2018 2-2019
2-2016 2-2017 2-2018 2-2019
2-2016 2-2017 2-2018 2-2019
Activity by District
SF District 1: Northwest (Sea Cliff, Lake, Jordan Park / Laurel Heights, Outer Richmond, Central Richmond, Inner Richmond, Lone Mountain)
SF District 2: Central West (Outer Sunset, Central Sunset, Inner Sunset, Outer Parkside, Parkside, Inner Parkside, Golden Gate Heights)
SF District 3: Southwest (Pine Lake Park, Lake Shore, Merced Manor, Stonestown, Lakeside, Merced Heights, Ingleside, Ingleside Heights, Oceanview)
SF District 4: Twin Peaks W (Forest Hill (& Ext), W Portal, St Francis Wd, Balboa Terr, Mt Dav Manor, Ingleside Terr, Monterey Hts, Wstwd Pk & H'lnds, Shrwd Fst, Miraloma Pk, Dmnd Hts, Mdtwn Terr)
SF District 5: Central (Haight Ashbury, Cole Vly / Prnssus Hts, Clarndn Hts, Corona Hts, Twin Pks, Glen Pk, Noe Vly, Eureka Vly / Dolores Hts, Mission Dolores, Duboce Trngl, Buena Vista / Ashbury Hts)
SF District 6: Central North (Lower Pacific Heights, Anza Vista, Western Addition, North Panhandle, Alamo Square, Hayes Valley)
SF District 7: North (Marina, Cow Hollow, Presidio Heights, Pacific Heights)
SF District 8: Northeast (North Waterfront, North Beach, Russian Hill, Telegraph Hill, Nob Hill, Financial District / Barbary Coast, Downtown, Van Ness / Civic Center, Tenderloin)
SF District 9: Central East (Yerba Buena, South Beach, South of Market, Mission Bay, Inner Mission, Potrero Hill, Central Waterfront / Dogpatch, Bernal Heights)
SF District 10: Southeast (Outer Mission, Mission Terr, Excelsior, Portola, Bayview, Silver Terr, Hunters Pt, Candlestick Pt, Bayview Hts, Little Hollywood, Visitation Vly, Crocker Amazon)
2-2018 2-2019 + / – 2-2018 2-2019 + / – 2-2018 2-2019 + / – 2-2018 2-2019 + / – 2-2018 2-2019 + / –
Single Family
1 SF District 1 32 26 -18.8% 9 11 +22.2% $1,925,000 $1,630,000 -15.3% 31 40 +29.0% 2.5 1.5 -40.0%
2 SF District 2 33 39 +18.2% 11 15 +36.4% $1,450,000 $1,605,000 +10.7% 6 20 +233.3% 1.0 1.2 +20.0%
3 SF District 3 20 23 +15.0% 6 7 +16.7% $1,025,500 $1,010,000 -1.5% 46 22 -52.2% 1.5 1.9 +26.7%
4 SF District 4 35 34 -2.9% 15 17 +13.3% $1,850,000 $1,520,000 -17.8% 14 29 +107.1% 1.4 1.2 -14.3%
5 SF District 5 63 51 -19.0% 20 13 -35.0% $2,925,500 $2,275,000 -22.2% 24 22 -8.3% 2.4 1.9 -20.8%
6 SF District 6 7 11 +57.1% 3 2 -33.3% $2,215,000 $2,450,000 +10.6% 33 5 -84.8% 2.1 3.1 +47.6%
7 SF District 7 31 29 -6.5% 5 6 +20.0% $4,900,000 $4,065,000 -17.0% 11 59 +436.4% 3.5 3.6 +2.9%
8 SF District 8 11 16 +45.5% 1 2 +100.0% $4,995,000 $3,087,500 -38.2% 72 50 -30.6% 4.1 7.0 +70.7%
9 SF District 9 48 49 +2.1% 14 12 -14.3% $1,626,250 $1,520,000 -6.5% 10 29 +190.0% 2.2 2.5 +13.6%
10 SF District 10 68 65 -4.4% 23 25 +8.7% $1,060,000 $965,000 -9.0% 29 32 +10.3% 1.6 1.8 +12.5%
Condo/TIC/Coop
1 SF District 1 17 28 +64.7% 9 9 0.0% $1,185,000 $1,350,000 +13.9% 15 11 -26.7% 1.6 2.0 +25.0%
2 SF District 2 10 6 -40.0% 7 3 -57.1% $1,370,000 $1,175,000 -14.2% 16 30 +87.5% 2.9 1.4 -51.7%
3 SF District 3 10 11 +10.0% 2 2 0.0% $760,500 $1,022,500 +34.5% 94 75 -20.2% 3.8 3.9 +2.6%
4 SF District 4 10 10 0.0% 4 0 -100.0% $510,846 $0 -100.0% 89 0 -100.0% 2.8 2.0 -28.6%
5 SF District 5 76 50 -34.2% 26 19 -26.9% $1,462,500 $1,575,000 +7.7% 30 23 -23.3% 2.1 1.4 -33.3%
6 SF District 6 68 49 -27.9% 23 14 -39.1% $1,215,000 $1,200,000 -1.2% 42 28 -33.3% 2.6 2.3 -11.5%
7 SF District 7 64 61 -4.7% 15 19 +26.7% $1,650,000 $1,550,000 -6.1% 20 29 +45.0% 2.6 2.4 -7.7%
8 SF District 8 140 117 -16.4% 20 25 +25.0% $1,241,500 $800,000 -35.6% 48 76 +58.3% 3.4 2.8 -17.6%
9 SF District 9 239 198 -17.2% 85 66 -22.4% $979,000 $1,075,000 +9.8% 37 41 +10.8% 2.7 2.3 -14.8%
10 SF District 10 20 22 +10.0% 11 3 -72.7% $638,500 $845,000 +32.3% 48 34 -29.2% 2.3 3.8 +65.2%
Key metrics by report month for the districts of San Fransisco.
Current as of March 11, 2019. All data from the San Francisco MLS. Report © 2019 ShowingTime. | 16
Active Listings Sold Listings Median Sales Price Days on Market Months Supply

Contenu connexe

Tendances

San Francisco market focus report December 2019
San Francisco market focus report December 2019San Francisco market focus report December 2019
San Francisco market focus report December 2019Ronny Budiutama
 
San Francisco Market Focus Report Jan 2019
San Francisco Market Focus Report Jan 2019San Francisco Market Focus Report Jan 2019
San Francisco Market Focus Report Jan 2019Ronny Budiutama
 
San Francisco Market Report for March 2020
San Francisco Market Report for March 2020San Francisco Market Report for March 2020
San Francisco Market Report for March 2020Ronny Budiutama
 
San Francisco market report July 2020
San Francisco market report July 2020San Francisco market report July 2020
San Francisco market report July 2020Ronny Budiutama
 
San Francisco Market Focus Report Feb 2020
San Francisco Market Focus Report Feb 2020San Francisco Market Focus Report Feb 2020
San Francisco Market Focus Report Feb 2020Ronny Budiutama
 
San Francisco market report May 2020
San Francisco market report May 2020San Francisco market report May 2020
San Francisco market report May 2020Ronny Budiutama
 
San Francisco Market Focus Report Jan 2020
San Francisco Market Focus Report Jan 2020San Francisco Market Focus Report Jan 2020
San Francisco Market Focus Report Jan 2020Ronny Budiutama
 
San Francisco market report September 2020
San Francisco market report September 2020San Francisco market report September 2020
San Francisco market report September 2020Ronny Budiutama
 
San Francisco market report August 2020
San Francisco market report August 2020San Francisco market report August 2020
San Francisco market report August 2020Ronny Budiutama
 
San Francisco market report April 2020
San Francisco market report April 2020San Francisco market report April 2020
San Francisco market report April 2020Ronny Budiutama
 
San Francisco Market Report December 2020
San Francisco Market Report December 2020San Francisco Market Report December 2020
San Francisco Market Report December 2020Ronny Budiutama
 
San Francisco Market Report March 2021
San Francisco Market Report March 2021San Francisco Market Report March 2021
San Francisco Market Report March 2021Ronny Budiutama
 
San Francisco Market Report January 2021
San Francisco Market Report January 2021San Francisco Market Report January 2021
San Francisco Market Report January 2021Ronny Budiutama
 
San Francisco Market Data October 2020
San Francisco Market Data October 2020San Francisco Market Data October 2020
San Francisco Market Data October 2020Ronny Budiutama
 
San Francisco Market Focus Report Aug 2018
San Francisco Market Focus Report Aug 2018San Francisco Market Focus Report Aug 2018
San Francisco Market Focus Report Aug 2018Ronny Budiutama
 
San Francisco Market Report May 2021
San Francisco Market Report May 2021San Francisco Market Report May 2021
San Francisco Market Report May 2021Ronny Budiutama
 
Gbar monthly-market-insight-report-jan20
Gbar monthly-market-insight-report-jan20Gbar monthly-market-insight-report-jan20
Gbar monthly-market-insight-report-jan20Joe Schutt
 
San Francisco Market Report April 2021
San Francisco Market Report April 2021San Francisco Market Report April 2021
San Francisco Market Report April 2021Ronny Budiutama
 
San Francisco Market Report June 2021
San Francisco Market Report June 2021San Francisco Market Report June 2021
San Francisco Market Report June 2021Ronny Budiutama
 
San Francisco Market Focus Report September 2018
San Francisco Market Focus Report September 2018San Francisco Market Focus Report September 2018
San Francisco Market Focus Report September 2018Ronny Budiutama
 

Tendances (20)

San Francisco market focus report December 2019
San Francisco market focus report December 2019San Francisco market focus report December 2019
San Francisco market focus report December 2019
 
San Francisco Market Focus Report Jan 2019
San Francisco Market Focus Report Jan 2019San Francisco Market Focus Report Jan 2019
San Francisco Market Focus Report Jan 2019
 
San Francisco Market Report for March 2020
San Francisco Market Report for March 2020San Francisco Market Report for March 2020
San Francisco Market Report for March 2020
 
San Francisco market report July 2020
San Francisco market report July 2020San Francisco market report July 2020
San Francisco market report July 2020
 
San Francisco Market Focus Report Feb 2020
San Francisco Market Focus Report Feb 2020San Francisco Market Focus Report Feb 2020
San Francisco Market Focus Report Feb 2020
 
San Francisco market report May 2020
San Francisco market report May 2020San Francisco market report May 2020
San Francisco market report May 2020
 
San Francisco Market Focus Report Jan 2020
San Francisco Market Focus Report Jan 2020San Francisco Market Focus Report Jan 2020
San Francisco Market Focus Report Jan 2020
 
San Francisco market report September 2020
San Francisco market report September 2020San Francisco market report September 2020
San Francisco market report September 2020
 
San Francisco market report August 2020
San Francisco market report August 2020San Francisco market report August 2020
San Francisco market report August 2020
 
San Francisco market report April 2020
San Francisco market report April 2020San Francisco market report April 2020
San Francisco market report April 2020
 
San Francisco Market Report December 2020
San Francisco Market Report December 2020San Francisco Market Report December 2020
San Francisco Market Report December 2020
 
San Francisco Market Report March 2021
San Francisco Market Report March 2021San Francisco Market Report March 2021
San Francisco Market Report March 2021
 
San Francisco Market Report January 2021
San Francisco Market Report January 2021San Francisco Market Report January 2021
San Francisco Market Report January 2021
 
San Francisco Market Data October 2020
San Francisco Market Data October 2020San Francisco Market Data October 2020
San Francisco Market Data October 2020
 
San Francisco Market Focus Report Aug 2018
San Francisco Market Focus Report Aug 2018San Francisco Market Focus Report Aug 2018
San Francisco Market Focus Report Aug 2018
 
San Francisco Market Report May 2021
San Francisco Market Report May 2021San Francisco Market Report May 2021
San Francisco Market Report May 2021
 
Gbar monthly-market-insight-report-jan20
Gbar monthly-market-insight-report-jan20Gbar monthly-market-insight-report-jan20
Gbar monthly-market-insight-report-jan20
 
San Francisco Market Report April 2021
San Francisco Market Report April 2021San Francisco Market Report April 2021
San Francisco Market Report April 2021
 
San Francisco Market Report June 2021
San Francisco Market Report June 2021San Francisco Market Report June 2021
San Francisco Market Report June 2021
 
San Francisco Market Focus Report September 2018
San Francisco Market Focus Report September 2018San Francisco Market Focus Report September 2018
San Francisco Market Focus Report September 2018
 

Similaire à San Francisco Market Focus Report Feb 2019

San Francisco market focus report June 2018
San Francisco market focus report June 2018San Francisco market focus report June 2018
San Francisco market focus report June 2018Ronny Budiutama
 
San Francisco Market Focus February 2018
San Francisco Market Focus February 2018San Francisco Market Focus February 2018
San Francisco Market Focus February 2018Ronny Budiutama
 
San Francisco Market Report August 2021
San Francisco Market Report August 2021San Francisco Market Report August 2021
San Francisco Market Report August 2021Ronny Budiutama
 
San Francisco Market Focus Report July
San Francisco Market Focus Report JulySan Francisco Market Focus Report July
San Francisco Market Focus Report JulyRonny Budiutama
 
San Francisco Market Focus Report May
San Francisco Market Focus Report MaySan Francisco Market Focus Report May
San Francisco Market Focus Report MayRonny Budiutama
 
San Francisco Market Focus Report Nov 2020
San Francisco Market Focus Report Nov 2020San Francisco Market Focus Report Nov 2020
San Francisco Market Focus Report Nov 2020Ronny Budiutama
 
San Francisco Market Focus March 2018
San Francisco Market Focus March 2018San Francisco Market Focus March 2018
San Francisco Market Focus March 2018Ronny Budiutama
 
San Francisco Market Focus April 2018
San Francisco Market Focus April 2018San Francisco Market Focus April 2018
San Francisco Market Focus April 2018Ronny Budiutama
 
San Francisco Market Focus Report October 2018
San Francisco Market Focus Report October 2018San Francisco Market Focus Report October 2018
San Francisco Market Focus Report October 2018Ronny Budiutama
 
Georgia Housing Market Snapshot For March 2019
Georgia Housing Market Snapshot For March 2019Georgia Housing Market Snapshot For March 2019
Georgia Housing Market Snapshot For March 2019Arthur Prescott
 
San Francisco Market Report February 2021
San Francisco Market Report February 2021San Francisco Market Report February 2021
San Francisco Market Report February 2021Ronny Budiutama
 
San Francisco Market Focus July 2017
San Francisco Market Focus July 2017San Francisco Market Focus July 2017
San Francisco Market Focus July 2017Ronny Budiutama
 

Similaire à San Francisco Market Focus Report Feb 2019 (12)

San Francisco market focus report June 2018
San Francisco market focus report June 2018San Francisco market focus report June 2018
San Francisco market focus report June 2018
 
San Francisco Market Focus February 2018
San Francisco Market Focus February 2018San Francisco Market Focus February 2018
San Francisco Market Focus February 2018
 
San Francisco Market Report August 2021
San Francisco Market Report August 2021San Francisco Market Report August 2021
San Francisco Market Report August 2021
 
San Francisco Market Focus Report July
San Francisco Market Focus Report JulySan Francisco Market Focus Report July
San Francisco Market Focus Report July
 
San Francisco Market Focus Report May
San Francisco Market Focus Report MaySan Francisco Market Focus Report May
San Francisco Market Focus Report May
 
San Francisco Market Focus Report Nov 2020
San Francisco Market Focus Report Nov 2020San Francisco Market Focus Report Nov 2020
San Francisco Market Focus Report Nov 2020
 
San Francisco Market Focus March 2018
San Francisco Market Focus March 2018San Francisco Market Focus March 2018
San Francisco Market Focus March 2018
 
San Francisco Market Focus April 2018
San Francisco Market Focus April 2018San Francisco Market Focus April 2018
San Francisco Market Focus April 2018
 
San Francisco Market Focus Report October 2018
San Francisco Market Focus Report October 2018San Francisco Market Focus Report October 2018
San Francisco Market Focus Report October 2018
 
Georgia Housing Market Snapshot For March 2019
Georgia Housing Market Snapshot For March 2019Georgia Housing Market Snapshot For March 2019
Georgia Housing Market Snapshot For March 2019
 
San Francisco Market Report February 2021
San Francisco Market Report February 2021San Francisco Market Report February 2021
San Francisco Market Report February 2021
 
San Francisco Market Focus July 2017
San Francisco Market Focus July 2017San Francisco Market Focus July 2017
San Francisco Market Focus July 2017
 

Plus de Ronny Budiutama

San Francisco January 2024 Market Report
San Francisco January 2024 Market ReportSan Francisco January 2024 Market Report
San Francisco January 2024 Market ReportRonny Budiutama
 
San Francisco December 2023 Market Report
San Francisco December 2023 Market ReportSan Francisco December 2023 Market Report
San Francisco December 2023 Market ReportRonny Budiutama
 
San Francisco November 2023 Market Report
San Francisco November 2023 Market ReportSan Francisco November 2023 Market Report
San Francisco November 2023 Market ReportRonny Budiutama
 
2023 Annual San Francisco Housing Market
2023 Annual San Francisco Housing Market2023 Annual San Francisco Housing Market
2023 Annual San Francisco Housing MarketRonny Budiutama
 
October 2023 Report: San Francisco Real Estate Market Insights
October 2023 Report: San Francisco Real Estate Market InsightsOctober 2023 Report: San Francisco Real Estate Market Insights
October 2023 Report: San Francisco Real Estate Market InsightsRonny Budiutama
 
CA Weekly MLS Market Data Report - August 2023
CA Weekly MLS Market Data Report - August 2023CA Weekly MLS Market Data Report - August 2023
CA Weekly MLS Market Data Report - August 2023Ronny Budiutama
 
San Francisco Market Report July 2023.pdf
San Francisco Market Report July 2023.pdfSan Francisco Market Report July 2023.pdf
San Francisco Market Report July 2023.pdfRonny Budiutama
 
San Francisco May 2023 Market Report.pdf
San Francisco May 2023 Market Report.pdfSan Francisco May 2023 Market Report.pdf
San Francisco May 2023 Market Report.pdfRonny Budiutama
 
San Francisco June 2023 Market Report.pdf
San Francisco June 2023 Market Report.pdfSan Francisco June 2023 Market Report.pdf
San Francisco June 2023 Market Report.pdfRonny Budiutama
 
San Francisco Market Report March 2023.pdf
San Francisco Market Report March 2023.pdfSan Francisco Market Report March 2023.pdf
San Francisco Market Report March 2023.pdfRonny Budiutama
 
San Francisco Market Report February 2023
San Francisco Market Report February 2023San Francisco Market Report February 2023
San Francisco Market Report February 2023Ronny Budiutama
 
San Francisco Market Report January 2023.pdf
San Francisco Market Report January 2023.pdfSan Francisco Market Report January 2023.pdf
San Francisco Market Report January 2023.pdfRonny Budiutama
 
Annual Report on the San Francisco County Housing Market.pdf
Annual Report on the San Francisco County Housing Market.pdfAnnual Report on the San Francisco County Housing Market.pdf
Annual Report on the San Francisco County Housing Market.pdfRonny Budiutama
 
San Francisco Market Report December 2022.pdf
San Francisco Market Report December 2022.pdfSan Francisco Market Report December 2022.pdf
San Francisco Market Report December 2022.pdfRonny Budiutama
 
San Francisco Market Report November 2022.pdf
San Francisco Market Report November 2022.pdfSan Francisco Market Report November 2022.pdf
San Francisco Market Report November 2022.pdfRonny Budiutama
 
San Francisco Market Report October 2022.pdf
San Francisco Market Report October 2022.pdfSan Francisco Market Report October 2022.pdf
San Francisco Market Report October 2022.pdfRonny Budiutama
 
San Francisco Market Report September 2022.pdf
San Francisco Market Report September 2022.pdfSan Francisco Market Report September 2022.pdf
San Francisco Market Report September 2022.pdfRonny Budiutama
 
San Francisco Market Report August 2022.pdf
San Francisco Market Report August 2022.pdfSan Francisco Market Report August 2022.pdf
San Francisco Market Report August 2022.pdfRonny Budiutama
 
San Francisco Market Report July 2022.pdf
San Francisco Market Report July 2022.pdfSan Francisco Market Report July 2022.pdf
San Francisco Market Report July 2022.pdfRonny Budiutama
 
San Francisco Market Report June 2022.pdf
San Francisco Market Report June 2022.pdfSan Francisco Market Report June 2022.pdf
San Francisco Market Report June 2022.pdfRonny Budiutama
 

Plus de Ronny Budiutama (20)

San Francisco January 2024 Market Report
San Francisco January 2024 Market ReportSan Francisco January 2024 Market Report
San Francisco January 2024 Market Report
 
San Francisco December 2023 Market Report
San Francisco December 2023 Market ReportSan Francisco December 2023 Market Report
San Francisco December 2023 Market Report
 
San Francisco November 2023 Market Report
San Francisco November 2023 Market ReportSan Francisco November 2023 Market Report
San Francisco November 2023 Market Report
 
2023 Annual San Francisco Housing Market
2023 Annual San Francisco Housing Market2023 Annual San Francisco Housing Market
2023 Annual San Francisco Housing Market
 
October 2023 Report: San Francisco Real Estate Market Insights
October 2023 Report: San Francisco Real Estate Market InsightsOctober 2023 Report: San Francisco Real Estate Market Insights
October 2023 Report: San Francisco Real Estate Market Insights
 
CA Weekly MLS Market Data Report - August 2023
CA Weekly MLS Market Data Report - August 2023CA Weekly MLS Market Data Report - August 2023
CA Weekly MLS Market Data Report - August 2023
 
San Francisco Market Report July 2023.pdf
San Francisco Market Report July 2023.pdfSan Francisco Market Report July 2023.pdf
San Francisco Market Report July 2023.pdf
 
San Francisco May 2023 Market Report.pdf
San Francisco May 2023 Market Report.pdfSan Francisco May 2023 Market Report.pdf
San Francisco May 2023 Market Report.pdf
 
San Francisco June 2023 Market Report.pdf
San Francisco June 2023 Market Report.pdfSan Francisco June 2023 Market Report.pdf
San Francisco June 2023 Market Report.pdf
 
San Francisco Market Report March 2023.pdf
San Francisco Market Report March 2023.pdfSan Francisco Market Report March 2023.pdf
San Francisco Market Report March 2023.pdf
 
San Francisco Market Report February 2023
San Francisco Market Report February 2023San Francisco Market Report February 2023
San Francisco Market Report February 2023
 
San Francisco Market Report January 2023.pdf
San Francisco Market Report January 2023.pdfSan Francisco Market Report January 2023.pdf
San Francisco Market Report January 2023.pdf
 
Annual Report on the San Francisco County Housing Market.pdf
Annual Report on the San Francisco County Housing Market.pdfAnnual Report on the San Francisco County Housing Market.pdf
Annual Report on the San Francisco County Housing Market.pdf
 
San Francisco Market Report December 2022.pdf
San Francisco Market Report December 2022.pdfSan Francisco Market Report December 2022.pdf
San Francisco Market Report December 2022.pdf
 
San Francisco Market Report November 2022.pdf
San Francisco Market Report November 2022.pdfSan Francisco Market Report November 2022.pdf
San Francisco Market Report November 2022.pdf
 
San Francisco Market Report October 2022.pdf
San Francisco Market Report October 2022.pdfSan Francisco Market Report October 2022.pdf
San Francisco Market Report October 2022.pdf
 
San Francisco Market Report September 2022.pdf
San Francisco Market Report September 2022.pdfSan Francisco Market Report September 2022.pdf
San Francisco Market Report September 2022.pdf
 
San Francisco Market Report August 2022.pdf
San Francisco Market Report August 2022.pdfSan Francisco Market Report August 2022.pdf
San Francisco Market Report August 2022.pdf
 
San Francisco Market Report July 2022.pdf
San Francisco Market Report July 2022.pdfSan Francisco Market Report July 2022.pdf
San Francisco Market Report July 2022.pdf
 
San Francisco Market Report June 2022.pdf
San Francisco Market Report June 2022.pdfSan Francisco Market Report June 2022.pdf
San Francisco Market Report June 2022.pdf
 

Dernier

Rustomjee The Panorama At Pali Hill, Bandra West, Mumbai - Brochure.pdf
Rustomjee The Panorama At Pali Hill, Bandra West, Mumbai - Brochure.pdfRustomjee The Panorama At Pali Hill, Bandra West, Mumbai - Brochure.pdf
Rustomjee The Panorama At Pali Hill, Bandra West, Mumbai - Brochure.pdfmonikasharma630
 
Ajmera Prive at Juhu, Mumbai E-Brochure.pdf
Ajmera Prive at Juhu, Mumbai  E-Brochure.pdfAjmera Prive at Juhu, Mumbai  E-Brochure.pdf
Ajmera Prive at Juhu, Mumbai E-Brochure.pdfManishSaxena95
 
Kolte Patil Universe Hinjewadi Pune Brochure.pdf
Kolte Patil Universe Hinjewadi Pune Brochure.pdfKolte Patil Universe Hinjewadi Pune Brochure.pdf
Kolte Patil Universe Hinjewadi Pune Brochure.pdfPrachiRudram
 
Experion Elements Sector 45 Noida_Brochure.pdf.pdf
Experion Elements Sector 45 Noida_Brochure.pdf.pdfExperion Elements Sector 45 Noida_Brochure.pdf.pdf
Experion Elements Sector 45 Noida_Brochure.pdf.pdfkratirudram
 
Provident Solitaire Park Square Kanakapura Road, Bangalore E- Brochure.pdf
Provident Solitaire Park Square Kanakapura Road, Bangalore E- Brochure.pdfProvident Solitaire Park Square Kanakapura Road, Bangalore E- Brochure.pdf
Provident Solitaire Park Square Kanakapura Road, Bangalore E- Brochure.pdffaheemali990101
 
What-are-the-latest-modular-wardrobe-designs.pdf
What-are-the-latest-modular-wardrobe-designs.pdfWhat-are-the-latest-modular-wardrobe-designs.pdf
What-are-the-latest-modular-wardrobe-designs.pdfKams Designer Zone
 
Kumar Fireworks Hadapsar Link Road Pune Brochure.pdf
Kumar Fireworks Hadapsar Link Road Pune Brochure.pdfKumar Fireworks Hadapsar Link Road Pune Brochure.pdf
Kumar Fireworks Hadapsar Link Road Pune Brochure.pdfBabyrudram
 
SVN Live 4.22.24 Weekly Property Broadcast
SVN Live 4.22.24 Weekly Property BroadcastSVN Live 4.22.24 Weekly Property Broadcast
SVN Live 4.22.24 Weekly Property BroadcastSVN International Corp.
 
LCAR Unit 22 - Leasing and Property Management - 14th Edition Revised.pptx
LCAR Unit 22 - Leasing and Property Management - 14th Edition Revised.pptxLCAR Unit 22 - Leasing and Property Management - 14th Edition Revised.pptx
LCAR Unit 22 - Leasing and Property Management - 14th Edition Revised.pptxTom Blefko
 
Brigade Neopolis Kokapet, Hyderabad E- Brochure
Brigade Neopolis Kokapet, Hyderabad E- BrochureBrigade Neopolis Kokapet, Hyderabad E- Brochure
Brigade Neopolis Kokapet, Hyderabad E- Brochurefaheemali990101
 
Choose Noida's Leading Architect
Choose    Noida's    Leading   ArchitectChoose    Noida's    Leading   Architect
Choose Noida's Leading ArchitectMM Design Studio
 
Shapoorji Pallonji Vanaha GolfLand 2 | A Space For You To Find Your Space
Shapoorji Pallonji Vanaha GolfLand 2 | A Space For You To Find Your SpaceShapoorji Pallonji Vanaha GolfLand 2 | A Space For You To Find Your Space
Shapoorji Pallonji Vanaha GolfLand 2 | A Space For You To Find Your Spaceaidasheikh47
 
Radiance Majestic Valasaravakkam Chennai.pdf
Radiance Majestic Valasaravakkam Chennai.pdfRadiance Majestic Valasaravakkam Chennai.pdf
Radiance Majestic Valasaravakkam Chennai.pdfashiyadav24
 
Managed Farmland Brochures to get more in
Managed Farmland Brochures to get more inManaged Farmland Brochures to get more in
Managed Farmland Brochures to get more inknoxdigital1
 
The Role of Mortgage Brokers in Retirement Housing: Key Considerations
The Role of Mortgage Brokers in Retirement Housing: Key ConsiderationsThe Role of Mortgage Brokers in Retirement Housing: Key Considerations
The Role of Mortgage Brokers in Retirement Housing: Key Considerationssunlite Mortgage
 
Call Girls In Sahibabad Ghaziabad ❤️8860477959 Low Rate Escorts Service In 24...
Call Girls In Sahibabad Ghaziabad ❤️8860477959 Low Rate Escorts Service In 24...Call Girls In Sahibabad Ghaziabad ❤️8860477959 Low Rate Escorts Service In 24...
Call Girls In Sahibabad Ghaziabad ❤️8860477959 Low Rate Escorts Service In 24...lizamodels9
 

Dernier (20)

Rustomjee The Panorama At Pali Hill, Bandra West, Mumbai - Brochure.pdf
Rustomjee The Panorama At Pali Hill, Bandra West, Mumbai - Brochure.pdfRustomjee The Panorama At Pali Hill, Bandra West, Mumbai - Brochure.pdf
Rustomjee The Panorama At Pali Hill, Bandra West, Mumbai - Brochure.pdf
 
Ajmera Prive at Juhu, Mumbai E-Brochure.pdf
Ajmera Prive at Juhu, Mumbai  E-Brochure.pdfAjmera Prive at Juhu, Mumbai  E-Brochure.pdf
Ajmera Prive at Juhu, Mumbai E-Brochure.pdf
 
Kolte Patil Universe Hinjewadi Pune Brochure.pdf
Kolte Patil Universe Hinjewadi Pune Brochure.pdfKolte Patil Universe Hinjewadi Pune Brochure.pdf
Kolte Patil Universe Hinjewadi Pune Brochure.pdf
 
Experion Elements Sector 45 Noida_Brochure.pdf.pdf
Experion Elements Sector 45 Noida_Brochure.pdf.pdfExperion Elements Sector 45 Noida_Brochure.pdf.pdf
Experion Elements Sector 45 Noida_Brochure.pdf.pdf
 
Provident Solitaire Park Square Kanakapura Road, Bangalore E- Brochure.pdf
Provident Solitaire Park Square Kanakapura Road, Bangalore E- Brochure.pdfProvident Solitaire Park Square Kanakapura Road, Bangalore E- Brochure.pdf
Provident Solitaire Park Square Kanakapura Road, Bangalore E- Brochure.pdf
 
Hot call girls in Moti Bagh🔝 9953056974 🔝 escort Service
Hot call girls in Moti Bagh🔝 9953056974 🔝 escort ServiceHot call girls in Moti Bagh🔝 9953056974 🔝 escort Service
Hot call girls in Moti Bagh🔝 9953056974 🔝 escort Service
 
What-are-the-latest-modular-wardrobe-designs.pdf
What-are-the-latest-modular-wardrobe-designs.pdfWhat-are-the-latest-modular-wardrobe-designs.pdf
What-are-the-latest-modular-wardrobe-designs.pdf
 
Kumar Fireworks Hadapsar Link Road Pune Brochure.pdf
Kumar Fireworks Hadapsar Link Road Pune Brochure.pdfKumar Fireworks Hadapsar Link Road Pune Brochure.pdf
Kumar Fireworks Hadapsar Link Road Pune Brochure.pdf
 
SVN Live 4.22.24 Weekly Property Broadcast
SVN Live 4.22.24 Weekly Property BroadcastSVN Live 4.22.24 Weekly Property Broadcast
SVN Live 4.22.24 Weekly Property Broadcast
 
9953056974 Low Rate Call Girls In Saket, Delhi NCR
9953056974 Low Rate Call Girls In Saket, Delhi NCR9953056974 Low Rate Call Girls In Saket, Delhi NCR
9953056974 Low Rate Call Girls In Saket, Delhi NCR
 
LCAR Unit 22 - Leasing and Property Management - 14th Edition Revised.pptx
LCAR Unit 22 - Leasing and Property Management - 14th Edition Revised.pptxLCAR Unit 22 - Leasing and Property Management - 14th Edition Revised.pptx
LCAR Unit 22 - Leasing and Property Management - 14th Edition Revised.pptx
 
Brigade Neopolis Kokapet, Hyderabad E- Brochure
Brigade Neopolis Kokapet, Hyderabad E- BrochureBrigade Neopolis Kokapet, Hyderabad E- Brochure
Brigade Neopolis Kokapet, Hyderabad E- Brochure
 
young call girls in Lajpat Nagar,🔝 9953056974 🔝 escort Service
young call girls in Lajpat Nagar,🔝 9953056974 🔝 escort Serviceyoung call girls in Lajpat Nagar,🔝 9953056974 🔝 escort Service
young call girls in Lajpat Nagar,🔝 9953056974 🔝 escort Service
 
Choose Noida's Leading Architect
Choose    Noida's    Leading   ArchitectChoose    Noida's    Leading   Architect
Choose Noida's Leading Architect
 
Shapoorji Pallonji Vanaha GolfLand 2 | A Space For You To Find Your Space
Shapoorji Pallonji Vanaha GolfLand 2 | A Space For You To Find Your SpaceShapoorji Pallonji Vanaha GolfLand 2 | A Space For You To Find Your Space
Shapoorji Pallonji Vanaha GolfLand 2 | A Space For You To Find Your Space
 
Radiance Majestic Valasaravakkam Chennai.pdf
Radiance Majestic Valasaravakkam Chennai.pdfRadiance Majestic Valasaravakkam Chennai.pdf
Radiance Majestic Valasaravakkam Chennai.pdf
 
Managed Farmland Brochures to get more in
Managed Farmland Brochures to get more inManaged Farmland Brochures to get more in
Managed Farmland Brochures to get more in
 
Call Girls in Mahavir Nagar whatsaap call US +919953056974
Call Girls in Mahavir Nagar  whatsaap call US  +919953056974Call Girls in Mahavir Nagar  whatsaap call US  +919953056974
Call Girls in Mahavir Nagar whatsaap call US +919953056974
 
The Role of Mortgage Brokers in Retirement Housing: Key Considerations
The Role of Mortgage Brokers in Retirement Housing: Key ConsiderationsThe Role of Mortgage Brokers in Retirement Housing: Key Considerations
The Role of Mortgage Brokers in Retirement Housing: Key Considerations
 
Call Girls In Sahibabad Ghaziabad ❤️8860477959 Low Rate Escorts Service In 24...
Call Girls In Sahibabad Ghaziabad ❤️8860477959 Low Rate Escorts Service In 24...Call Girls In Sahibabad Ghaziabad ❤️8860477959 Low Rate Escorts Service In 24...
Call Girls In Sahibabad Ghaziabad ❤️8860477959 Low Rate Escorts Service In 24...
 

San Francisco Market Focus Report Feb 2019

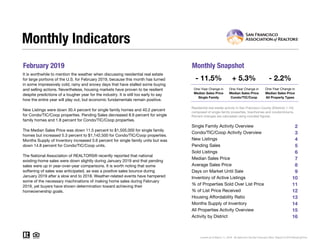
  • 1. February 2019 Monthly Snapshot One-Year Change in One-Year Change in Median Sales Price Single Family Median Sales Price Condo/TIC/Coop 2 3 4 5 6 7 8 9 10 11 12 13 14 15 16 Monthly Indicators - 11.5% + 5.3% - 2.2% One-Year Change in It is worthwhile to mention the weather when discussing residential real estate for large portions of the U.S. for February 2019, because this month has turned in some impressively cold, rainy and snowy days that have stalled some buying and selling actions. Nevertheless, housing markets have proven to be resilient despite predictions of a tougher year for the industry. It is still too early to say how the entire year will play out, but economic fundamentals remain positive. New Listings were down 30.4 percent for single family homes and 40.2 percent for Condo/TIC/Coop properties. Pending Sales decreased 8.9 percent for single family homes and 1.8 percent for Condo/TIC/Coop properties. The Median Sales Price was down 11.5 percent to $1,505,000 for single family homes but increased 5.3 percent to $1,142,500 for Condo/TIC/Coop properties. Months Supply of Inventory increased 5.6 percent for single family units but was down 14.8 percent for Condo/TIC/Coop units. The National Association of REALTORS® recently reported that national existing-home sales were down slightly during January 2019 and that pending sales were up in year-over-year comparisons. It is worth noting that some softening of sales was anticipated, as was a positive sales bounce during January 2019 after a slow end to 2018. Weather-related events have hampered some of the necessary machinations of making home sales during February 2019, yet buyers have shown determination toward achieving their homeownership goals. Median Sales Price All Property Types Residential real estate activity in San Francisco County (Districts 1-10) composed of single-family properties, townhomes and condominiums. Percent changes are calculated using rounded figures. Single Family Activity Overview Months Supply of Inventory Current as of March 11, 2019. All data from the San Francisco MLS. Report © 2019 ShowingTime. Condo/TIC/Coop Activity Overview Inventory of Active Listings % of Properties Sold Over List Price % of List Price Received Housing Affordability Ratio All Properties Activity Overview New Listings Pending Sales Sold Listings Median Sales Price Average Sales Price Days on Market Until Sale Activity by District
  • 2. Single Family Activity Overview Key metrics by report month and for year-to-date (YTD) starting from the first of the year. Key Metrics Historical Sparkbars 2-2018 2-2019 Percent Change YTD 2018 YTD 2019 Percent Change Current as of March 11, 2019. All data from the San Francisco MLS. Report © 2019 ShowingTime. | 2 Months Supply 1.8 1.9 + 5.6% -- -- -- Affordability Ratio 29 33 + 13.8% % of List Price Received 115.8% 112.8% - 2.6% 114.1% 33 69.9% - 7.7% - 3.9% 34 + 3.0% 109.6% % of Properties Sold Over List Price 80.4% 78.2% - 2.7% 75.7% Active Listings 348 343 - 1.4% -- Avg. Sales Price $2,107,409 $1,878,466 - 10.9% $1,956,868 Days on Market 22 30 + 36.4% 27 35 + 29.6% $1,789,007 -- -- Median Sales Price $1,700,000 $1,505,000 - 11.5% $1,500,000 Sold Listings 107 110 + 2.8% 202 New Listings 207 144 - 30.4% 395 Pending Sales 158 144 - 8.9% - 5.3%245 232 - 17.5%326 209 + 3.5% $1,460,000 - 2.7% - 8.6% 2-2016 2-2017 2-2018 2-2019 2-2016 2-2017 2-2018 2-2019 2-2016 2-2017 2-2018 2-2019 2-2016 2-2017 2-2018 2-2019 2-2016 2-2017 2-2018 2-2019 2-2016 2-2017 2-2018 2-2019 2-2016 2-2017 2-2018 2-2019 2-2016 2-2017 2-2018 2-2019 2-2016 2-2017 2-2018 2-2019 2-2016 2-2017 2-2018 2-2019 2-2016 2-2017 2-2018 2-2019
  • 3. Condo/TIC/Coop Activity Overview Key metrics by report month and for year-to-date (YTD) starting from the first of the year. Key Metrics Historical Sparkbars 2-2018 2-2019 Percent Change YTD 2018 YTD 2019 Percent Change Current as of March 11, 2019. All data from the San Francisco MLS. Report © 2019 ShowingTime. | 3 Months Supply 2.7 2.3 - 14.8% -- -- -- Affordability Ratio 53 50 - 5.7% % of List Price Received 105.1% 104.4% - 0.7% 103.7% 52 48.9% + 1.7% - 0.7% 52 0.0% 103.0% % of Properties Sold Over List Price 58.9% 54.4% - 7.6% 48.1% Active Listings 654 552 - 15.6% -- Avg. Sales Price $1,264,649 $1,360,281 + 7.6% $1,288,730 Days on Market 37 40 + 8.1% 45 $1,099,000 + 0.4% - 0.4% 46 + 2.2% $1,284,155 -- -- Sold Listings 202 160 - 20.8% 351 274 - 21.9% Median Sales Price $1,085,000 $1,142,500 + 5.3% $1,095,000 - 25.9% Pending Sales 224 220 - 1.8% 404 343 - 15.1% New Listings 356 213 - 40.2% 723 536 2-2016 2-2017 2-2018 2-2019 2-2016 2-2017 2-2018 2-2019 2-2016 2-2017 2-2018 2-2019 2-2016 2-2017 2-2018 2-2019 2-2016 2-2017 2-2018 2-2019 2-2016 2-2017 2-2018 2-2019 2-2016 2-2017 2-2018 2-2019 2-2016 2-2017 2-2018 2-2019 2-2016 2-2017 2-2018 2-2019 2-2016 2-2017 2-2018 2-2019 2-2016 2-2017 2-2018 2-2019
  • 4. New Listings New Listings Single Family Year-Over-Year Change Condo/TIC/ Coop Year-Over-Year Change Mar-2018 276 0.0% 379 +8.3% Apr-2018 270 +9.3% 378 +32.2% May-2018 271 -5.6% 370 +2.5% Jun-2018 266 +11.8% 356 +13.7% Jul-2018 240 +13.7% 259 -5.5% Aug-2018 244 +14.0% 309 +5.5% Sep-2018 335 +11.3% 449 +2.3% Oct-2018 256 +7.1% 333 +1.2% Nov-2018 153 +5.5% 188 -10.0% Dec-2018 75 -3.8% 114 -11.6% Jan-2019 182 -3.2% 323 -12.0% Feb-2019 144 -30.4% 213 -40.2% 12-Month Avg 226 +3.1% 306 -0.9% Historical New Listings by Month Current as of March 11, 2019. All data from the San Francisco MLS. Report © 2019 ShowingTime. | 4 A count of the properties that have been newly listed on the market in a given month. 187 330 207 356 144 213 Single Family Condo/TIC/Coop February 0 100 200 300 400 500 600 700 1-2005 1-2006 1-2007 1-2008 1-2009 1-2010 1-2011 1-2012 1-2013 1-2014 1-2015 1-2016 1-2017 1-2018 1-2019 Single Family Condo/TIC/Coop 365 659 395 723 326 536 Single Family Condo/TIC/Coop Year to Date 2017 2018 2019 - 40.2%+ 7.9%- 30.4%+ 10.7% + 9.7%- 17.5%+ 8.2% - 25.9% 2017 2018 2019 2017 2018 2019 2017 2018 2019 - 18.0% - 11.0% + 4.3%- 2.4%
  • 5. Pending Sales Pending Sales Single Family Year-Over-Year Change Condo/TIC/ Coop Year-Over-Year Change Mar-2018 215 +0.9% 336 +10.5% Apr-2018 207 +4.5% 287 +27.6% May-2018 275 +14.6% 297 -2.9% Jun-2018 203 -18.5% 302 +4.1% Jul-2018 165 -4.6% 246 +17.7% Aug-2018 173 -16.0% 232 +9.4% Sep-2018 193 -5.4% 219 -10.2% Oct-2018 251 +1.2% 291 -11.8% Nov-2018 187 -5.6% 222 -5.1% Dec-2018 121 +13.1% 147 -23.4% Jan-2019 88 +1.1% 123 -31.7% Feb-2019 144 -8.9% 220 -1.8% 12-Month Avg 185 -2.6% 244 -0.9% Historical Pending Sales by Month A count of the properties on which offers have been accepted in a given month. Current as of March 11, 2019. All data from the San Francisco MLS. Report © 2019 ShowingTime. | 5 135 209 158 224 144 220 Single Family Condo/TIC/Coop February 0 100 200 300 400 1-2005 1-2006 1-2007 1-2008 1-2009 1-2010 1-2011 1-2012 1-2013 1-2014 1-2015 1-2016 1-2017 1-2018 1-2019 Single Family Condo/TIC/Coop 228 354 245 404 232 343 Single Family Condo/TIC/Coop Year to Date 2017 2018 2019 - 1.8%+ 7.2%- 8.9%+ 17.0% + 14.1%- 5.3%+ 7.5% - 15.1% 2017 2018 2019 2017 2018 2019 2017 2018 2019 + 8.9% + 2.2% - 4.3%- 7.9%
  • 6. Sold Listings Sold Listings Single Family Year-Over-Year Change Condo/TIC/ Coop Year-Over-Year Change Mar-2018 200 +15.6% 289 +0.7% Apr-2018 190 -6.4% 296 +27.6% May-2018 249 +14.2% 312 +14.7% Jun-2018 231 +0.4% 303 -6.5% Jul-2018 192 -8.6% 273 +14.2% Aug-2018 192 -9.9% 258 +17.8% Sep-2018 146 -17.5% 183 +4.6% Oct-2018 246 +5.1% 292 -6.1% Nov-2018 220 -10.2% 262 -5.8% Dec-2018 160 +7.4% 193 -22.8% Jan-2019 99 +4.2% 114 -23.5% Feb-2019 110 +2.8% 160 -20.8% 12-Month Avg 186 -0.8% 245 -0.1% Historical Sold Listings by Month A count of the actual sales that closed in a given month. Current as of March 11, 2019. All data from the San Francisco MLS. Report © 2019 ShowingTime. | 6 111 157 107 202 110 160 Single Family Condo/TIC/Coop February 0 100 200 300 400 1-2005 1-2006 1-2007 1-2008 1-2009 1-2010 1-2011 1-2012 1-2013 1-2014 1-2015 1-2016 1-2017 1-2018 1-2019 Single Family Condo/TIC/Coop 217 307 202 351 209 274 Single Family Condo/TIC/Coop Year to Date 2017 2018 2019 - 20.8%+ 28.7%+ 2.8%- 3.6% + 14.3%+ 3.5%- 6.9% - 21.9% 2017 2018 2019 2017 2018 2019 2017 2018 2019 + 8.8% + 5.3% - 3.2%- 6.5%
  • 7. Median Sales Price Median Sales Price Single Family Year-Over-Year Change Condo/TIC/ Coop Year-Over-Year Change Mar-2018 $1,687,500 +25.0% $1,250,000 +9.9% Apr-2018 $1,648,000 +19.4% $1,250,000 +13.6% May-2018 $1,618,888 +9.8% $1,257,500 +7.6% Jun-2018 $1,625,000 +11.2% $1,170,000 +4.0% Jul-2018 $1,626,250 +16.2% $1,150,000 0.0% Aug-2018 $1,544,000 +12.3% $1,234,400 +5.1% Sep-2018 $1,500,000 +13.6% $1,150,000 +5.0% Oct-2018 $1,600,000 +1.6% $1,218,500 +6.9% Nov-2018 $1,427,500 -4.5% $1,198,625 -3.1% Dec-2018 $1,492,500 +2.9% $1,165,000 +4.0% Jan-2019 $1,378,000 +3.6% $1,040,000 -5.5% Feb-2019 $1,505,000 -11.5% $1,142,500 +5.3% 12-Month Avg* $1,575,000 +10.1% $1,200,000 +4.8% Historical Median Sales Price by Month Point at which half of the sales sold for more and half sold for less, not accounting for seller concessions, in a given month. * Median Sales Price for all properties from March 2018 through February 2019. This is not the average of the individual figures above. Current as of March 11, 2019. All data from the San Francisco MLS. Report © 2019 ShowingTime. | 7 $1,290,000 $1,185,000 $1,700,000 $1,085,000 $1,505,000 $1,142,500 Single Family Condo/TIC/Coop February $400,000 $600,000 $800,000 $1,000,000 $1,200,000 $1,400,000 $1,600,000 $1,800,000 1-2005 1-2006 1-2007 1-2008 1-2009 1-2010 1-2011 1-2012 1-2013 1-2014 1-2015 1-2016 1-2017 1-2018 1-2019 Single Family Condo/TIC/Coop $1,275,000 $1,100,000 $1,500,000 $1,095,000 $1,460,000 $1,099,000 Single Family Condo/TIC/Coop Year to Date 2017 2018 2019 + 5.3%- 8.4%- 11.5%+ 31.8% - 0.5%- 2.7%+ 17.6% + 0.4% 2017 2018 2019 2017 2018 2019 2017 2018 2019 - 7.2% + 1.2% + 0.9%+ 8.0%
  • 8. Average Sales Price Avg. Sales Price Single Family Year-Over-Year Change Condo/TIC/ Coop Year-Over-Year Change Mar-2018 $1,949,493 +3.1% $1,371,131 +6.9% Apr-2018 $2,185,545 +16.2% $1,335,639 +3.0% May-2018 $2,020,490 +10.1% $1,399,046 +3.9% Jun-2018 $1,943,346 +12.5% $1,337,494 -1.0% Jul-2018 $1,969,483 +13.3% $1,242,275 -0.1% Aug-2018 $1,834,962 +17.6% $1,347,023 +6.1% Sep-2018 $1,826,997 +13.4% $1,255,936 +3.2% Oct-2018 $2,160,394 +7.9% $1,345,345 +5.5% Nov-2018 $1,864,335 +6.2% $1,266,048 -8.7% Dec-2018 $1,786,072 -6.4% $1,329,356 +5.2% Jan-2019 $1,689,609 -5.5% $1,177,310 -10.9% Feb-2019 $1,878,466 -10.9% $1,360,281 +7.6% 12-Month Avg* $1,948,835 +8.0% $1,322,946 +2.0% Historical Average Sales Price by Month Average sales price for all closed sales, not accounting for seller concessions, in a given month. * Avg. Sales Price for all properties from March 2018 through February 2019. This is not the average of the individual figures above. Current as of March 11, 2019. All data from the San Francisco MLS. Report © 2019 ShowingTime. | 8 $1,684,181 $1,358,682 $2,107,409 $1,264,649 $1,878,466 $1,360,281 Single Family Condo/TIC/Coop February $500,000 $1,000,000 $1,500,000 $2,000,000 $2,500,000 1-2005 1-2006 1-2007 1-2008 1-2009 1-2010 1-2011 1-2012 1-2013 1-2014 1-2015 1-2016 1-2017 1-2018 1-2019 Single Family Condo/TIC/Coop $1,659,253 $1,262,501 $1,956,868 $1,288,730 $1,789,007 $1,284,155 Single Family Condo/TIC/Coop Year to Date 2017 2018 2019 + 7.6%- 6.9%- 10.9%+ 25.1% + 2.1%- 8.6%+ 17.9% - 0.4% 2017 2018 2019 2017 2018 2019 2017 2018 2019 + 4.5% + 4.3% + 6.0%+ 12.3%
  • 9. Days on Market Until Sale Days on Market Single Family Year-Over-Year Change Condo/TIC/ Coop Year-Over-Year Change Mar-2018 22 -29.0% 26 -18.8% Apr-2018 18 -30.8% 26 -18.8% May-2018 20 -16.7% 27 -18.2% Jun-2018 18 -33.3% 27 -27.0% Jul-2018 21 -12.5% 31 -6.1% Aug-2018 22 -18.5% 36 -12.2% Sep-2018 23 -17.9% 30 -28.6% Oct-2018 24 +9.1% 27 -12.9% Nov-2018 26 0.0% 38 +8.6% Dec-2018 33 +17.9% 44 -2.2% Jan-2019 40 +21.2% 55 0.0% Feb-2019 30 +36.4% 40 +8.1% 12-Month Avg* 24 -9.6% 32 -13.0% Historical Days on Market Until Sale by Month Average number of days between when a property is listed and when an offer is accepted in a given month. * Days on Market for all properties from March 2018 through February 2019. This is not the average of the individual figures above. Current as of March 11, 2019. All data from the San Francisco MLS. Report © 2019 ShowingTime. | 9 34 36 22 37 30 40 Single Family Condo/TIC/Coop February 0 20 40 60 80 100 120 1-2005 1-2006 1-2007 1-2008 1-2009 1-2010 1-2011 1-2012 1-2013 1-2014 1-2015 1-2016 1-2017 1-2018 1-2019 Single Family Condo/TIC/Coop 38 47 27 45 35 46 Single Family Condo/TIC/Coop Year to Date 2017 2018 2019 + 8.1%+ 2.8%+ 36.4%- 35.3% - 4.3%+ 29.6%- 28.9% + 2.2% 2017 2018 2019 2017 2018 2019 2017 2018 2019 + 9.7% + 5.6% + 20.5%+ 2.9%
  • 10. Inventory of Active Listings Active Listings Single Family Year-Over-Year Change Condo/TIC/ Coop Year-Over-Year Change Mar-2018 390 +1.0% 652 +3.2% Apr-2018 426 +3.1% 701 +7.5% May-2018 399 -6.6% 720 +8.9% Jun-2018 424 +11.0% 710 +15.6% Jul-2018 457 +17.2% 650 +7.8% Aug-2018 478 +30.2% 660 +7.8% Sep-2018 576 +33.3% 835 +10.4% Oct-2018 524 +30.7% 812 +18.0% Nov-2018 439 +36.3% 683 +14.4% Dec-2018 298 +34.2% 466 +12.3% Jan-2019 375 +18.7% 609 +5.4% Feb-2019 343 -1.4% 552 -15.6% 12-Month Avg* 427 +16.4% 671 +7.9% Historical Inventory of Active Listings by Month The number of properties available for sale in active status at the end of a given month. * Active Listings for all properties from March 2018 through February 2019. This is not the average of the individual figures above. Current as of March 11, 2019. All data from the San Francisco MLS. Report © 2019 ShowingTime. | 10 351 624 348 654 343 552 Single Family Condo/TIC/Coop February 0 250 500 750 1,000 1,250 1,500 1-2005 1-2006 1-2007 1-2008 1-2009 1-2010 1-2011 1-2012 1-2013 1-2014 1-2015 1-2016 1-2017 1-2018 1-2019 Single Family Condo/TIC/Coop 2017 2018 2019 - 15.6%+ 4.8%- 1.4%- 0.9% 2017 2018 2019 - 5.9% + 15.8%
  • 11. % of Properties Sold Over List Price % of Properties Sold Over List Price Single Family Year-Over-Year Change Condo/TIC/ Coop Year-Over-Year Change Mar-2018 77.5% +3.9% 59.2% -4.5% Apr-2018 77.9% +0.8% 66.6% +7.2% May-2018 84.7% +7.4% 67.6% +10.8% Jun-2018 88.3% +10.4% 68.3% +16.6% Jul-2018 85.4% +4.9% 63.4% +1.0% Aug-2018 80.2% +2.3% 57.8% -4.8% Sep-2018 81.5% -5.1% 63.4% +19.4% Oct-2018 82.5% -1.6% 68.2% +2.4% Nov-2018 73.6% -8.9% 54.2% -7.0% Dec-2018 68.1% -7.0% 46.1% -15.3% Jan-2019 60.6% -14.0% 41.2% +22.6% Feb-2019 78.2% -2.7% 54.4% -7.6% 12-Month Avg 79.4% +0.1% 60.9% +3.6% Historical % of Properties Sold Over List Price by Month Percentage found when dividing the number of properties sold by properties sold over its original list price, not accounting for seller concessions. * % of Properties Sold Over List Price for all properties from March 2018 through February 2019. This is not the average of the individual figures above. Current as of March 11, 2019. All data from the San Francisco MLS. Report © 2019 ShowingTime. | 11 78.4% 57.3% 80.4% 58.9% 78.2% 54.4% Single Family Condo/TIC/Coop February 0.0% 20.0% 40.0% 60.0% 80.0% 100.0% 1-2005 1-2006 1-2007 1-2008 1-2009 1-2010 1-2011 1-2012 1-2013 1-2014 1-2015 1-2016 1-2017 1-2018 1-2019 Single Family Condo/TIC/Coop 70.5% 48.2% 75.7% 48.1% 69.9% 48.9% Single Family Condo/TIC/Coop Year to Date 2017 2018 2019 - 7.6%+ 2.8%- 2.7%+ 2.6% - 0.2%- 7.7%+ 7.4% + 1.7% 2017 2018 2019 2017 2018 2019 2017 2018 2019 + 1.2% - 8.1% - 13.6%- 1.7%
  • 12. % of List Price Received % of List Price Received Single Family Year-Over-Year Change Condo/TIC/ Coop Year-Over-Year Change Mar-2018 117.5% +4.5% 107.1% +2.1% Apr-2018 119.3% +3.4% 108.9% +3.6% May-2018 119.5% +3.6% 108.4% +2.8% Jun-2018 120.1% +2.8% 107.3% +1.4% Jul-2018 117.2% +0.1% 107.1% +1.0% Aug-2018 114.7% -0.6% 105.7% 0.0% Sep-2018 115.4% -0.8% 106.5% +1.6% Oct-2018 114.0% -1.4% 107.7% +1.0% Nov-2018 111.2% -3.7% 104.1% -0.4% Dec-2018 110.5% -3.3% 102.1% -1.6% Jan-2019 106.1% -5.5% 101.0% -0.7% Feb-2019 112.8% -2.6% 104.4% -0.7% 12-Month Avg* 115.5% +0.1% 106.4% +1.2% Historical % of List Price Received by Month Percentage found when dividing a property’s sales price by its most recent list price, then taking the average for all properties sold in a given month, not accounting for seller concessions. * % of List Price Received for all properties from March 2018 through February 2019. This is not the average of the individual figures above. Current as of March 11, 2019. All data from the San Francisco MLS. Report © 2019 ShowingTime. | 12 113.8% 103.9% 115.8% 105.1% 112.8% 104.4% Single Family Condo/TIC/Coop February 110.8% 102.6% 114.1% 103.7% 109.6% 103.0% Single Family Condo/TIC/Coop Year to Date 90.0% 100.0% 110.0% 120.0% 130.0% 1-2005 1-2006 1-2007 1-2008 1-2009 1-2010 1-2011 1-2012 1-2013 1-2014 1-2015 1-2016 1-2017 1-2018 1-2019 Single Family Condo/TIC/Coop 2017 2018 2019 - 0.7%+ 1.2%- 2.6%+ 1.8% 2017 2018 2019 + 1.1% - 1.9% 2017 2018 2019 - 0.7%+ 1.1%- 3.9%+ 3.0% 2017 2018 2019 - 0.9% - 2.2%
  • 13. Housing Affordability Ratio Affordability Ratio Single Family Year-Over-Year Change Condo/TIC/ Coop Year-Over-Year Change Mar-2018 29 -21.6% 46 -9.8% Apr-2018 29 -21.6% 45 -16.7% May-2018 30 -14.3% 44 -13.7% Jun-2018 30 -14.3% 48 -9.4% Jul-2018 30 -18.9% 49 -5.8% Aug-2018 31 -18.4% 45 -13.5% Sep-2018 31 -20.5% 47 -14.5% Oct-2018 28 -12.5% 41 -21.2% Nov-2018 32 -8.6% 43 -12.2% Dec-2018 33 -5.7% 48 -9.4% Jan-2019 36 -2.7% 54 +3.8% Feb-2019 33 +13.8% 50 -5.7% 12-Month Avg* 31 -7.3% 36 -4.4% Historical Housing Affordability Ratio by Month This index measures housing affordability for the region. For example, an index of 120 means the median household income is 120% of what is necessary to qualify for the median-priced home under prevailing interest rates. A higher number means greater affordability. * Affordability Ratio for all properties from March 2018 through February 2019. This is not the average of the individual figures above. Current as of March 11, 2019. All data from the San Francisco MLS. Report © 2019 ShowingTime. | 13 39 49 29 53 33 50 Single Family Condo/TIC/Coop February 20 40 60 80 100 1-2005 1-2006 1-2007 1-2008 1-2009 1-2010 1-2011 1-2012 1-2013 1-2014 1-2015 1-2016 1-2017 1-2018 1-2019 Single Family Condo/TIC/Coop 2017 2018 2019 - 5.7%+ 8.2%+ 13.8%- 25.6% 2017 2018 2019 + 2.6% - 12.5% 39 53 33 52 34 52 Single Family Condo/TIC/Coop Year to Date 2017 2018 2019 0.0%- 1.9%+ 3.0%- 15.4% 2017 2018 2019 - 7.1% - 5.4%
  • 14. Months Supply of Inventory Months Supply Single Family Year-Over-Year Change Condo/TIC/ Coop Year-Over-Year Change Mar-2018 2.0 -4.8% 2.6 -3.7% Apr-2018 2.2 0.0% 2.8 0.0% May-2018 2.1 -8.7% 2.8 0.0% Jun-2018 2.2 +4.8% 2.8 +7.7% Jul-2018 2.4 +14.3% 2.5 -3.8% Aug-2018 2.6 +30.0% 2.6 0.0% Sep-2018 3.1 +34.8% 3.3 +3.1% Oct-2018 2.8 +33.3% 3.2 +14.3% Nov-2018 2.4 +41.2% 2.7 +8.0% Dec-2018 1.6 +33.3% 1.9 +11.8% Jan-2019 2.0 +17.6% 2.5 +4.2% Feb-2019 1.9 +5.6% 2.3 -14.8% 12-Month Avg* 2.3 +16.2% 2.7 +2.3% Historical Months Supply of Inventory by Month The inventory of homes for sale at the end of a given month, divided by the average monthly pending sales from the last 12 months. * Months Supply for all properties from March 2018 through February 2019. This is not the average of the individual figures above. Current as of March 11, 2019. All data from the San Francisco MLS. Report © 2019 ShowingTime. | 14 1.9 2.7 1.8 2.7 1.9 2.3 Single Family Condo/TIC/Coop February 0.0 2.0 4.0 6.0 8.0 10.0 1-2005 1-2006 1-2007 1-2008 1-2009 1-2010 1-2011 1-2012 1-2013 1-2014 1-2015 1-2016 1-2017 1-2018 1-2019 Single Family Condo/TIC/Coop 2017 2018 2019 - 14.8%0.0%+ 5.6%- 5.3% 2017 2018 2019 - 5.0% + 22.7%
  • 15. All Properties Activity Overview Key metrics by report month and for year-to-date (YTD) starting from the first of the year. Key Metrics Historical Sparkbars 2-2018 2-2019 Percent Change YTD 2018 YTD 2019 Percent Change Current as of March 11, 2019. All data from the San Francisco MLS. Report © 2019 ShowingTime. | 15 Months Supply 2.3 2.1 - 8.7% -- -- -- Affordability Ratio 37 37 0.0% % of List Price Received 108.8% 107.8% - 0.9% 107.5% 38 58.0% - 0.3% - 1.5% 39 + 2.6% 105.9% % of Properties Sold Over List Price 66.3% 64.1% - 3.3% 58.2% Active Listings 1,002 895 - 10.7% -- Avg. Sales Price $1,556,478 $1,571,394 + 1.0% $1,532,787 Days on Market 32 36 + 12.5% 38 $1,250,000 - 0.8% - 2.0% 41 + 7.9% $1,502,610 -- -- Sold Listings 309 270 - 12.6% 553 483 - 12.7% Median Sales Price $1,301,000 $1,272,000 - 2.2% $1,260,000 - 22.9% Pending Sales 382 364 - 4.7% 649 575 - 11.4% New Listings 563 357 - 36.6% 1,118 862 2-2016 2-2017 2-2018 2-2019 2-2016 2-2017 2-2018 2-2019 2-2016 2-2017 2-2018 2-2019 2-2016 2-2017 2-2018 2-2019 2-2016 2-2017 2-2018 2-2019 2-2016 2-2017 2-2018 2-2019 2-2016 2-2017 2-2018 2-2019 2-2016 2-2017 2-2018 2-2019 2-2016 2-2017 2-2018 2-2019 2-2016 2-2017 2-2018 2-2019 2-2016 2-2017 2-2018 2-2019
  • 16. Activity by District SF District 1: Northwest (Sea Cliff, Lake, Jordan Park / Laurel Heights, Outer Richmond, Central Richmond, Inner Richmond, Lone Mountain) SF District 2: Central West (Outer Sunset, Central Sunset, Inner Sunset, Outer Parkside, Parkside, Inner Parkside, Golden Gate Heights) SF District 3: Southwest (Pine Lake Park, Lake Shore, Merced Manor, Stonestown, Lakeside, Merced Heights, Ingleside, Ingleside Heights, Oceanview) SF District 4: Twin Peaks W (Forest Hill (& Ext), W Portal, St Francis Wd, Balboa Terr, Mt Dav Manor, Ingleside Terr, Monterey Hts, Wstwd Pk & H'lnds, Shrwd Fst, Miraloma Pk, Dmnd Hts, Mdtwn Terr) SF District 5: Central (Haight Ashbury, Cole Vly / Prnssus Hts, Clarndn Hts, Corona Hts, Twin Pks, Glen Pk, Noe Vly, Eureka Vly / Dolores Hts, Mission Dolores, Duboce Trngl, Buena Vista / Ashbury Hts) SF District 6: Central North (Lower Pacific Heights, Anza Vista, Western Addition, North Panhandle, Alamo Square, Hayes Valley) SF District 7: North (Marina, Cow Hollow, Presidio Heights, Pacific Heights) SF District 8: Northeast (North Waterfront, North Beach, Russian Hill, Telegraph Hill, Nob Hill, Financial District / Barbary Coast, Downtown, Van Ness / Civic Center, Tenderloin) SF District 9: Central East (Yerba Buena, South Beach, South of Market, Mission Bay, Inner Mission, Potrero Hill, Central Waterfront / Dogpatch, Bernal Heights) SF District 10: Southeast (Outer Mission, Mission Terr, Excelsior, Portola, Bayview, Silver Terr, Hunters Pt, Candlestick Pt, Bayview Hts, Little Hollywood, Visitation Vly, Crocker Amazon) 2-2018 2-2019 + / – 2-2018 2-2019 + / – 2-2018 2-2019 + / – 2-2018 2-2019 + / – 2-2018 2-2019 + / – Single Family 1 SF District 1 32 26 -18.8% 9 11 +22.2% $1,925,000 $1,630,000 -15.3% 31 40 +29.0% 2.5 1.5 -40.0% 2 SF District 2 33 39 +18.2% 11 15 +36.4% $1,450,000 $1,605,000 +10.7% 6 20 +233.3% 1.0 1.2 +20.0% 3 SF District 3 20 23 +15.0% 6 7 +16.7% $1,025,500 $1,010,000 -1.5% 46 22 -52.2% 1.5 1.9 +26.7% 4 SF District 4 35 34 -2.9% 15 17 +13.3% $1,850,000 $1,520,000 -17.8% 14 29 +107.1% 1.4 1.2 -14.3% 5 SF District 5 63 51 -19.0% 20 13 -35.0% $2,925,500 $2,275,000 -22.2% 24 22 -8.3% 2.4 1.9 -20.8% 6 SF District 6 7 11 +57.1% 3 2 -33.3% $2,215,000 $2,450,000 +10.6% 33 5 -84.8% 2.1 3.1 +47.6% 7 SF District 7 31 29 -6.5% 5 6 +20.0% $4,900,000 $4,065,000 -17.0% 11 59 +436.4% 3.5 3.6 +2.9% 8 SF District 8 11 16 +45.5% 1 2 +100.0% $4,995,000 $3,087,500 -38.2% 72 50 -30.6% 4.1 7.0 +70.7% 9 SF District 9 48 49 +2.1% 14 12 -14.3% $1,626,250 $1,520,000 -6.5% 10 29 +190.0% 2.2 2.5 +13.6% 10 SF District 10 68 65 -4.4% 23 25 +8.7% $1,060,000 $965,000 -9.0% 29 32 +10.3% 1.6 1.8 +12.5% Condo/TIC/Coop 1 SF District 1 17 28 +64.7% 9 9 0.0% $1,185,000 $1,350,000 +13.9% 15 11 -26.7% 1.6 2.0 +25.0% 2 SF District 2 10 6 -40.0% 7 3 -57.1% $1,370,000 $1,175,000 -14.2% 16 30 +87.5% 2.9 1.4 -51.7% 3 SF District 3 10 11 +10.0% 2 2 0.0% $760,500 $1,022,500 +34.5% 94 75 -20.2% 3.8 3.9 +2.6% 4 SF District 4 10 10 0.0% 4 0 -100.0% $510,846 $0 -100.0% 89 0 -100.0% 2.8 2.0 -28.6% 5 SF District 5 76 50 -34.2% 26 19 -26.9% $1,462,500 $1,575,000 +7.7% 30 23 -23.3% 2.1 1.4 -33.3% 6 SF District 6 68 49 -27.9% 23 14 -39.1% $1,215,000 $1,200,000 -1.2% 42 28 -33.3% 2.6 2.3 -11.5% 7 SF District 7 64 61 -4.7% 15 19 +26.7% $1,650,000 $1,550,000 -6.1% 20 29 +45.0% 2.6 2.4 -7.7% 8 SF District 8 140 117 -16.4% 20 25 +25.0% $1,241,500 $800,000 -35.6% 48 76 +58.3% 3.4 2.8 -17.6% 9 SF District 9 239 198 -17.2% 85 66 -22.4% $979,000 $1,075,000 +9.8% 37 41 +10.8% 2.7 2.3 -14.8% 10 SF District 10 20 22 +10.0% 11 3 -72.7% $638,500 $845,000 +32.3% 48 34 -29.2% 2.3 3.8 +65.2% Key metrics by report month for the districts of San Fransisco. Current as of March 11, 2019. All data from the San Francisco MLS. Report © 2019 ShowingTime. | 16 Active Listings Sold Listings Median Sales Price Days on Market Months Supply