SlideShare une entreprise Scribd logo
1  sur  16
Monthly Indicators
September 2013

Monthly Snapshot
+ 29.0%

While children returned to classrooms in September, buyers continued to scour
the City for available housing stock and sellers closed transactions in fewer
days than any other month this year. San Francisco’s residential market remains
red hot going into the last quarter of 2013, while many regions throughout the
country are just now starting to thaw.
New Listings were down 12.0 percent for single family homes but increased 7.5
percent for Condo/TIC/Coop properties. Pending Sales increased 14.1 percent
for single family homes and 11.9 percent for Condo/TIC/Coop properties.
The Median Sales Price was up 29.0 percent to $935,000 for single family
homes and 6.8 percent to $829,044 for Condo/TIC/Coop properties. Months
Supply of Inventory decreased 28.6 percent for single family units and 23.3
percent for Condo/TIC/Coop units.
There's some evidence that it's not just first-time home buyers fueling the
recovery. Move-up buyers are also pulling their weight. Some baby-boomers
are ready to look for less space, nudging Junior out of the basement. The pizza
boxes and late-night video games get old, plus there's a fresh crop of buyers
looking for a bigger space to raise their own little darlings.

+ 6.8%

+ 14.7%

One-Year Change in
Median Sales Price
Single Family

One-Year Change in
Median Sales Price
Condo/TIC/Coop

One-Year Change in
Median Sales Price
All Property Types

Residential real estate activity in San Francisco County (Districts 1-10),
comprised of single-family properties, townhomes and condominiums.
Percent changes are calculated using rounded figures.

Single Family Activity Overview
Condo/TIC/Coop Activity Overview
New Listings
Pending Sales
Sold Listings
Median Sales Price
Average Sales Price
Days on Market Until Sale
Inventory of Active Listings
% of Properties Sold Over List Price
% of List Price Received
Housing Affordability Ratio
Months Supply of Inventory
All Properties Activity Overview
Activity by District

2
3
4
5
6
7
8
9
10
11
12
13
14
15
16

Current as of October 14, 2013. All data from the San Francisco MLS. Powered by 10K Research and Marketing.
Single Family Activity Overview
Key metrics by report month and for year-to-date (YTD) starting from the first of the year.

Key Metrics

Historical Sparkbars

9-2012

9-2011

9-2012

2,401

0.0%

210

+ 14.1%

1,941

1,995

+ 2.8%

180

+ 0.6%

1,897

1,918

+ 1.1%

$935,000

+ 29.0%

$738,000

$910,000

+ 23.3%

YTD 2012 YTD 2013

Percent Change

9-2013

9-2010

2,401

$725,000

9-2012

- 12.0%

179

9-2011

279

184

9-2010

Percent Change

317

New Listings

9-2013

9-2013

Pending Sales
Sold Listings
9-2010

9-2011

9-2012

9-2013

Median Sales Price
9-2010

9-2011

9-2012

9-2013

9-2010

9-2011

9-2012

9-2013

Average Sales Price

$936,072 $1,232,567 + 31.7% $1,046,074 $1,281,335 + 22.5%

Days on Market

46

36

- 35.7%

444

- 25.6%

--

--

--

78.9%

+ 14.8%

57.2%

76.5%

+ 33.7%

106.9%

110.0%

+ 2.9%

103.9%

110.3%

+ 6.2%

74

53

- 28.4%

73

55

- 24.7%

2.8

9-2012

56

68.7%

9-2011

- 34.8%

597

9-2010

30

2.0

- 28.6%

--

--

--

9-2013

Active Listings
9-2010

9-2011

9-2012

9-2013

9-2010

9-2011

9-2012

9-2013

% of Properties Sold Over List Price

% of List Price Received
9-2010

9-2011

9-2012

9-2013

Affordability Ratio
9-2010

9-2011

9-2012

9-2013

9-2010

9-2011

9-2012

9-2013

Months Supply

Current as of October 14, 2013. All data from the San Francisco MLS. Powered by 10K Research and Marketing. | Click for Cover Page | 2
Condo/TIC/Coop Activity Overview
Key metrics by report month and for year-to-date (YTD) starting from the first of the year.

Key Metrics

Historical Sparkbars

9-2012

244

+ 11.9%

2,403

2,537

+ 5.6%

224

- 1.8%

2,369

2,455

+ 3.6%

$829,044

+ 6.8%

$695,000

$820,000

+ 18.0%

$943,896

+ 5.1%

$789,817

$949,919

+ 20.3%

52

35

- 32.7%

65

41

- 36.9%

752

642

- 14.6%

--

--

--

53.1%

70.1%

+ 32.0%

42.7%

65.7%

+ 53.9%

102.2%

105.9%

+ 3.6%

101.2%

105.5%

+ 4.2%

70

60

- 14.3%

77

61

- 20.8%

3.0

9-2012

+ 8.3%

$898,376

9-2011

3,206

2.3

- 23.3%

--

--

--

YTD 2012 YTD 2013

Percent Change

9-2013

9-2010

2,960

$776,000

9-2012

+ 7.5%

228

9-2011

416

218

9-2010

Percent Change

387

New Listings

9-2013

9-2013

Pending Sales
Sold Listings
9-2010

9-2011

9-2012

9-2013

Median Sales Price
9-2010

9-2011

9-2012

9-2013

9-2010

9-2011

9-2012

9-2013

Average Sales Price
Days on Market
9-2010

9-2011

9-2012

9-2013

Active Listings
9-2010

9-2011

9-2012

9-2013

9-2010

9-2011

9-2012

9-2013

% of Properties Sold Over List Price

% of List Price Received
9-2010

9-2011

9-2012

9-2013

Affordability Ratio
9-2010

9-2011

9-2012

9-2013

9-2010

9-2011

9-2012

9-2013

Months Supply

Current as of October 14, 2013. All data from the San Francisco MLS. Powered by 10K Research and Marketing. | Click for Cover Page | 3
New Listings
A count of the properties that have been newly listed on the market in a given month.

Year to Date

September

- 12.9%

2011

2012

2013

2011

- 20.2%

- 12.0%

- 28.4%

- 5.6%

+ 7.5%

- 6.7%

Single Family

Condo/TIC/Coop

2012

2013

2011

2012

2013

- 15.3%

0.0%

- 13.8%

- 10.7%

+ 8.3%

Single Family

+36.1%

102

-12.8%

114

+2.7%

204

-17.7%

308

+1.3%

211

-18.2%

316

+2.9%

254

-12.1%

369

+12.5%

302

+15.3%

396

+15.1%

337

+30.1%

383

+2.4%

291

+12.4%

357

+6.9%

257

+0.8%

328

+21.9%

266

+4.7%

333

+6.4%

Sep-2013
2013

+27.6%

211

Aug-2013
2012

305

+22.3%

Jul-2013

2011

+11.2%

181

Jun-2013

279

287

Jan-2013

2,401

Oct-2012

May-2013

2,401

Year-Over-Year
Change

Apr-2013

317

Condo/TIC/
Coop

Dec-2012

2,836

Year-Over-Year
Change

Nov-2012

3,206
2,960

Single
Family

Mar-2013

416
387

New Listings

Feb-2013

410

397

3,314

279

-12.0%

416

+7.5%

12-Month Avg

248

+1.6%

320

+10.7%

Condo/TIC/Coop

Historical New Listings by Month

Single Family

700

Condo/TIC/Coop

600
500
400
300
200
100
0
1-2005

1-2006

1-2007

1-2008

1-2009

1-2010

1-2011

1-2012

1-2013

Current as of October 14, 2013. All data from the San Francisco MLS. Powered by 10K Research and Marketing. | Click for Cover Page | 4
Pending Sales
A count of the properties on which offers have been accepted in a given month.

Year to Date

September

Oct-2012

287

+27.0%

277

+37.8%

Nov-2012

252

+15.6%

271

+21.5%

170

-1.7%

203

+23.0%

Jan-2013

159

-6.5%

174

+6.7%

149

-21.6%

217

-0.9%

207

-10.0%

303

+9.0%

Apr-2013

242

+3.0%

310

-3.1%

May-2013

1,868

187

184

Year-Over-Year
Change

Mar-2013

195

1,941

Condo/TIC/
Coop

Feb-2013

218

Year-Over-Year
Change

Dec-2012

2,403

244
210

Single
Family

269

+10.2%

360

+13.9%

Pending Sales

1,995

2,537

1,987

Jun-2013

2013

2011

2012

2013

2011

2012

2013

2011

2012

2013

+ 7.7%

- 5.6%

+ 14.1%

- 0.5%

+ 16.6%

+ 11.9%

+ 7.1%

+ 3.9%

+ 2.8%

+ 11.1%

+ 20.9%

+ 5.6%

Single Family

Condo/TIC/Coop

Single Family

290

-7.6%

+11.1%

333

+16.4%

233

+3.6%

306

+5.9%

Sep-2013
2012

+16.0%

251

Aug-2013
2011

275

Jul-2013

210

+14.1%

244

+11.9%

12-Month Avg

225

+5.7%

274

+9.9%

Condo/TIC/Coop

Historical Pending Sales by Month

Single Family

400

Condo/TIC/Coop

300

200

100

0
1-2005

1-2006

1-2007

1-2008

1-2009

1-2010

1-2011

1-2012

1-2013

Current as of October 14, 2013. All data from the San Francisco MLS. Powered by 10K Research and Marketing. | Click for Cover Page | 5
Sold Listings
A count of the actual sales that closed in a given month.

Year to Date

September

+ 20.6%

2012

2013

2011

- 15.2%

+ 0.6%

+ 3.6%

+ 14.6%

- 1.8%

+ 5.4%

Single Family

Condo/TIC/Coop

2012

2013

2011

2012

2013

+ 4.8%

+ 1.1%

+ 11.0%

+ 20.0%

+ 3.6%

Single Family

-10.0%

251

+26.1%

161

+23.8%

155

-3.7%

129

-29.1%

195

+7.7%

207

-7.2%

282

+6.0%

222

+0.5%

303

+2.7%

248

+5.1%

379

+26.8%

267

-0.4%

275

-19.1%

273

+25.8%

341

+23.6%

231

-4.1%

301

-6.8%

Sep-2013
2011

208

Aug-2013
2013

+29.8%

Jul-2013

2012

+47.8%

270

Jun-2013

2011

275

+16.7%

May-2013

1,918

+26.9%

272

Apr-2013

1,897

255

Nov-2012

Mar-2013

1,810

1,974

Year-Over-Year
Change

Feb-2013

180

179

Condo/TIC/
Coop

Jan-2013

2,369

199

2,455

Year-Over-Year
Change

Oct-2012

224

Single
Family

Dec-2012

228
211

Sold Listings

180

+0.6%

224

-1.8%

12-Month Avg

221

+3.6%

271

+9.8%

Condo/TIC/Coop

Historical Sold Listings by Month

Single Family

400

Condo/TIC/Coop

300

200

100

0
1-2005

1-2006

1-2007

1-2008

1-2009

1-2010

1-2011

1-2012

1-2013

Current as of October 14, 2013. All data from the San Francisco MLS. Powered by 10K Research and Marketing. | Click for Cover Page | 6
Median Sales Price
Point at which half of the sales sold for more and half sold for less, not accounting for seller concessions, in a given month.

Year to Date

September

Year-Over-Year
Change

$830,000

+11.7%

$760,000

+17.9%

Nov-2012

$810,000

+20.0%

$775,000

+26.5%

Dec-2012

$836,250

+37.1%

$699,000

+11.8%

Jan-2013

$820,000

$829,044
$738,000

$725,000

Condo/TIC/
Coop

Oct-2012

$910,000

$776,000

Year-Over-Year
Change

$745,000

+17.3%

$765,000

+26.4%

Feb-2013

$935,000

Single
Family

$800,500

+26.1%

$750,000

+15.6%

Median Sales Price

$695,000

$695,000

$652,325

$629,000
$577,500

Mar-2013

2013

2011

- 8.1%

+ 11.1%

+ 29.0%

- 8.0%

+ 34.4%

+ 6.8%

- 7.3%

Single Family

Condo/TIC/Coop

2012

2013

2011

2012

2013

+ 6.2%

+ 23.3%

- 3.2%

+ 10.5%

+ 18.0%

Single Family

Condo/TIC/Coop

Historical Median Sales Price by Month

+31.6%

$845,250

+19.9%

$1,025,772

+31.8%

$830,000

+18.6%

$950,000

+21.8%

$780,000

+9.5%

$875,000

+13.9%

$850,000

+23.2%

$950,000

+24.2%

$810,000

+11.7%

Sep-2013
2012

$1,000,000

Aug-2013
2011

+31.1%

Jul-2013

2013

$822,500

Jun-2013

2012

+29.0%

May-2013

2011

$920,000

Apr-2013

$935,000

+29.0%

$829,044

+6.8%

12-Month Avg*

$886,000

+22.2%

$801,000

+18.0%

* Median Sales Price for all properties from October 2012 through September 2013. This is not
the average of the individual figures above.

Single Family

$1,100,000

Condo/TIC/Coop

$1,000,000

$900,000

$800,000

$700,000

$600,000

$500,000
1-2005

1-2006

1-2007

1-2008

1-2009

1-2010

1-2011

1-2012

1-2013

Current as of October 14, 2013. All data from the San Francisco MLS. Powered by 10K Research and Marketing. | Click for Cover Page | 7
Average Sales Price
Average sales price for all closed sales, not accounting for seller concessions, in a given month.

Year to Date

September

Average Sales
Price

$936,072

$943,896

$898,376

$854,045

$733,228

$1,296,224

+31.2%

$888,741

+26.8%

$1,114,319

+1.6%

$970,414

+23.7%

$1,388,972

+68.9%

$855,315

+3.6%

Jan-2013

$910,606

+15.4%

$836,342

+17.6%

Feb-2013

$789,817

Year-Over-Year
Change

Dec-2012
$949,919

$940,930

Condo/TIC/
Coop

Nov-2012
$1,046,074

Year-Over-Year
Change

Oct-2012

$1,281,335
$1,232,567

Single
Family

$1,166,453

+7.4%

$874,966

+18.3%

Mar-2013

2013

2011

- 6.8%

+ 9.6%

+ 31.7%

- 9.2%

+ 34.9%

+ 5.1%

- 5.8%

Single Family

Condo/TIC/Coop

2012

2013

2011

2012

2013

+ 11.2%

+ 22.5%

- 0.1%

+ 7.7%

+ 20.3%

Single Family

Condo/TIC/Coop

Historical Average Sales Price by Month

+28.7%

$975,623

+28.3%

$1,506,388

+33.7%

$980,008

+21.3%

$1,203,998

+3.8%

$933,686

+13.3%

$1,294,208

+9.6%

$1,018,542

+30.7%

$1,320,821

+33.5%

$931,307

+15.6%

Sep-2013
2012

$1,362,627

Aug-2013
2011

+29.0%

Jul-2013

2013

$953,615

Jun-2013

2012

+44.4%

May-2013

2011

$1,365,029

Apr-2013

$665,900

$1,232,567

+31.7%

$943,896

+5.1%

12-Month Avg*

$1,274,079

+24.2%

$939,142

+19.4%

* Average Sales Price for all properties from October 2012 through September 2013. This is not
the average of the individual figures above.

Single Family

$1,600,000

Condo/TIC/Coop

$1,400,000

$1,200,000

$1,000,000

$800,000

$600,000
1-2005

1-2006

1-2007

1-2008

1-2009

1-2010

1-2011

1-2012

1-2013

Current as of October 14, 2013. All data from the San Francisco MLS. Powered by 10K Research and Marketing. | Click for Cover Page | 8
Days on Market Until Sale
Average number of days between when a property is listed and when an offer is accepted in a given month.

Year to Date

September

-16.7%

55

-27.6%

42

-26.3%

51

-37.8%

48

-23.8%

61

-28.2%

49

-39.5%

64

-34.0%

Feb-2013

41

-34.9%

49

-47.9%

Mar-2013

39

-39.1%

42

-37.3%

Apr-2013

35

-35.2%

41

-41.4%

May-2013

31

-34.0%

36

-36.8%

Jun-2013

35

-40.7%

38

-33.3%

Jul-2013

33

-29.8%

39

-33.9%

Aug-2013

38

-22.4%

38

-29.6%

Sep-2013

56
41

36

35

2011

2012

2013

2011

2012

2013

2011

2012

2013

2011

2012

2013

+ 10.2%

- 29.2%

- 34.8%

- 9.0%

- 35.8%

- 32.7%

+ 14.0%

- 13.8%

- 35.7%

+ 3.9%

- 18.8%

- 36.9%

Condo/TIC/Coop

45

Dec-2012

65

46

Single Family

Year-Over-Year
Change

Jan-2013

65

30

Condo/TIC/
Coop

Nov-2012

52

Year-Over-Year
Change

Oct-2012

80

81
65

Single
Family

30

-34.8%

35

-32.7%

12-Month Avg*

38

-31.8%

44

-34.6%

Days on Market

Single Family

Condo/TIC/Coop

Historical Days on Market Until Sale by Month

* Days on Market for all properties from October 2012 through September 2013. This is not the
average of the individual figures above.

Single Family

120

Condo/TIC/Coop

100

80

60

40

20
1-2005

1-2006

1-2007

1-2008

1-2009

1-2010

1-2011

1-2012

1-2013

Current as of October 14, 2013. All data from the San Francisco MLS. Powered by 10K Research and Marketing. | Click for Cover Page | 9
Inventory of Active Listings
The number of properties available for sale in active status at the end of a given month.

September

Single
Family

Year-Over-Year
Change

Condo/TIC/
Coop

Year-Over-Year
Change

Oct-2012

544

-34.9%

716

-31.2%

Nov-2012

440

-34.2%

602

-29.9%

Dec-2012

313

-36.8%

410

-35.3%

Jan-2013

332

-37.8%

498

-31.0%

Feb-2013

375

-33.9%

573

-26.3%

Mar-2013

400

-31.7%

610

-19.9%

Apr-2013

437

-24.7%

654

-12.1%

May-2013

472

-14.2%

630

-16.7%

Jun-2013

455

-12.7%

643

-10.9%

Jul-2013

434

-14.2%

588

-12.4%

Aug-2013

430

-14.3%

549

-13.0%

Sep-2013

444

-25.6%

642

-14.6%

12-Month Avg*

423

-26.9%

593

-21.6%

Active Listings

1,104
885
752
642

597
444

2011

2012

2013

2011

2012

2013

- 11.0%

- 32.5%
Single Family

- 25.6%

- 21.6%

- 31.9%

- 14.6%

Condo/TIC/Coop

* Active Listings for all properties from October 2012 through September 2013. This is not the
average of the individual figures above.

Historical Inventory of Active Listings by Month

Single Family

1,600

Condo/TIC/Coop

1,400
1,200
1,000
800
600
400
200
1-2005

1-2006

1-2007

1-2008

1-2009

1-2010

1-2011

1-2012

1-2013

Current as of October 14, 2013. All data from the San Francisco MLS. Powered by 10K Research and Marketing. | Click for Cover Page | 10
% of Properties Sold Over List Price
Percentage found when dividing the number of properties sold by properties sold over its original list price, not accounting for seller
concessions.

September

Year to Date

57.2%

53.1%

Year-Over-Year
Change

65.5%

+51.3%

60.7%

+156.1%

66.5%

+38.3%

54.4%

+91.5%

Dec-2012

61.5%

+65.3%

46.2%

+95.8%

Jan-2013

65.7%

Condo/TIC/
Coop

Nov-2012

70.1%

68.7%

Year-Over-Year
Change

Oct-2012

76.5%

Single
Family

64.0%

+103.2%

39.4%

+62.8%

Feb-2013

78.9%

% of Properties
Sold Over List Price

72.7%

+78.6%

54.9%

+71.6%

Mar-2013

2012

2013

2011

2012

2013

2011

2012

2013

2011

2012

2013

- 2.8%

+ 64.7%

+ 14.8%

+ 24.8%

+ 164.2%

+ 32.0%

- 18.7%

+ 49.3%

+ 33.7%

- 1.7%

+ 87.3%

+ 53.9%

Single Family

Condo/TIC/Coop

Single Family

Condo/TIC/Coop

Historical % of Properties Sold Over List Price by Month

79.7%

+29.6%

67.3%

+77.1%

78.2%

+33.7%

67.8%

+41.8%

80.1%

+24.0%

72.4%

+50.2%

78.8%

+24.9%

73.3%

+71.3%

75.3%

+14.1%

66.1%

+45.3%

Sep-2013
2011

+52.4%

Aug-2013

20.1%

63.1%

Jul-2013

22.8%

+61.4%

Jun-2013

42.7%

38.3%

74.9%

Apr-2013
May-2013

41.7%

78.9%

+14.8%

70.1%

+32.0%

12-Month Avg

73.3%

+37.1%

62.8%

+60.1%

* % of Properties Sold Over List Price for all properties from October 2012 through September
2013. This is not the average of the individual figures above.

Single Family

100.0%

Condo/TIC/Coop

80.0%

60.0%

40.0%

20.0%

0.0%
1-2005

1-2006

1-2007

1-2008

1-2009

1-2010

1-2011

1-2012

1-2013

Current as of October 14, 2013. All data from the San Francisco MLS. Powered by 10K Research and Marketing. | Click for Cover Page | 11
% of List Price Received
Percentage found when dividing a property’s sales price by its most recent list price, then taking the average for all properties sold in a given
month, not accounting for seller concessions.

September

Year to Date

2012

2013

2011

2012

2013

2011

2012

2013

2011

2012

2013

+ 0.3%

+ 6.1%

+ 2.9%

+ 0.1%

+ 4.0%

+ 3.6%

- 1.2%

+ 4.0%

+ 6.2%

- 0.1%

+ 3.0%

+ 4.2%

Single Family

Single Family

Condo/TIC/Coop

Condo/TIC/Coop

Historical % of List Price Received by Month

103.6%

+5.0%

+5.3%

102.5%

+4.0%

104.7%

+4.0%

101.6%

+3.3%

106.1%

+6.7%

101.2%

+2.5%

108.4%

+8.0%

103.8%

+4.3%

109.9%

+8.0%

104.9%

+4.2%

111.7%

+7.8%

105.7%

+4.9%

111.5%

+6.3%

105.9%

+3.9%

112.5%

+7.3%

107.1%

+5.6%

109.9%

+4.2%

106.8%

+5.1%

110.2%

+4.2%

105.5%

+3.4%

Sep-2013
2011

+4.4%

Aug-2013

105.5%

106.4%

Jul-2013

98.3% 101.2%

105.2%

Jun-2013

110.3%

Nov-2012

May-2013

99.9%

103.9%

Oct-2012

Apr-2013

105.9%

Year-Over-Year
Change

Mar-2013

98.3%

102.2%

Condo/TIC/
Coop

Feb-2013

110.0%

Year-Over-Year
Change

Jan-2013

106.9%

Single
Family

Dec-2012

100.8%

% of List Price
Received

110.0%

+2.9%

105.9%

+3.6%

12-Month Avg*

109.0%

+5.7%

104.8%

+4.1%

* % of List Price Received for all properties from October 2012 through September 2013. This is
not the average of the individual figures above.

Single Family

115.0%

Condo/TIC/Coop

110.0%

105.0%

100.0%

95.0%
1-2005

1-2006

1-2007

1-2008

1-2009

1-2010

1-2011

1-2012

1-2013

Current as of October 14, 2013. All data from the San Francisco MLS. Powered by 10K Research and Marketing. | Click for Cover Page | 12
Housing Affordability Ratio
This index measures housing affordability for the region. An index of 120 means the median household income is 120% of what is necessary to
qualify for the median-priced home under prevailing interest rates. A higher number means greater affordability.

Year to Date

September

71

-7.8%

-9.5%

70

-13.6%

66

-19.5%

78

-2.5%

Jan-2013

74

-6.3%

72

-13.3%

67

-16.3%

71

-9.0%

59

-16.9%

65

-18.8%

55

-19.1%

65

-11.0%

52

-22.4%

63

-14.9%

Jun-2013

52

-22.4%

63

-13.7%

Jul-2013

57

-17.4%

58

-24.7%

Aug-2013

52

-24.6%

60

-17.8%

Sep-2013

61
55

60
53

2011

2012

2013

2011

2012

2013

2011

2012

2013

2011

2012

2013

+ 16.7%

- 3.9%

- 28.4%

+ 14.7%

- 18.6%

- 14.3%

+ 14.3%

+ 1.4%

- 24.7%

+ 9.7%

- 2.5%

- 20.8%

Single Family

Condo/TIC/Coop

-3.0%

67

May-2013

77

70

Single Family

65

Nov-2012

Feb-2013

73

72

Oct-2012

Mar-2013

74

Condo/TIC/
Coop

Apr-2013

77

Year-Over-Year
Change

Dec-2012

79

86

Single
Family

53

-28.4%

60

-14.3%

12-Month Avg*

60

-26.6%

72

-21.5%

Affordability Ratio

Condo/TIC/Coop

Historical Housing Affordability Ratio by Month

Year-Over-Year
Change

* Affordability Ratio for all properties from October 2012 through September 2013. This is not the
average of the individual figures above.

Single Family

90

Condo/TIC/Coop

80

70

60

50

40

30
1-2005

1-2006

1-2007

1-2008

1-2009

1-2010

1-2011

1-2012

1-2013

Current as of October 14, 2013. All data from the San Francisco MLS. Powered by 10K Research and Marketing. | Click for Cover Page | 13
Months Supply of Inventory
The inventory of homes for sale at the end of a given month, divided by the average monthly pending sales from the last 12 months.

September

Single
Family

Year-Over-Year
Change

Condo/TIC/
Coop

Year-Over-Year
Change

Oct-2012

2.5

-37.5%

2.8

-42.9%

Nov-2012

2.0

-37.5%

2.3

-42.5%

Dec-2012

1.4

-41.7%

1.6

-46.7%

Jan-2013

1.5

-42.3%

1.9

-44.1%

Feb-2013

1.7

-37.0%

2.2

-38.9%

Mar-2013

1.9

-32.1%

2.3

-34.3%

Apr-2013

2.0

-25.9%

2.5

-24.2%

May-2013

2.2

-15.4%

2.3

-30.3%

Jun-2013

2.1

-16.0%

2.4

-22.6%

Jul-2013

2.0

-16.7%

2.2

-21.4%

Aug-2013

1.9

-17.4%

2.0

-23.1%

Sep-2013

2.0

-28.6%

2.3

-23.3%

12-Month Avg*

1.9

-29.9%

2.2

-33.5%

Months Supply

5.2
4.3
3.0

2.8

2.3

2.0

2011

2012

2013

2011

2012

2013

- 15.7%

- 34.9%
Single Family

- 28.6%

- 25.7%

- 42.3%
Condo/TIC/Coop

- 23.3%

* Months Supply for all properties from October 2012 through September 2013. This is not the
average of the individual figures above.

Historical Months Supply of Inventory by Month

Single Family

10.0

Condo/TIC/Coop

8.0

6.0

4.0

2.0

0.0
1-2005

1-2006

1-2007

1-2008

1-2009

1-2010

1-2011

1-2012

1-2013

Current as of October 14, 2013. All data from the San Francisco MLS. Powered by 10K Research and Marketing. | Click for Cover Page | 14
All Properties Activity Overview
Key metrics by report month and for year-to-date (YTD) starting from the first of the year.

Key Metrics

Historical Sparkbars

9-2012

9-2011

9-2012

5,607

+ 4.6%

454

+ 12.9%

4,344

4,532

+ 4.3%

404

- 0.7%

4,266

4,373

+ 2.5%

$860,000

+ 14.7%

$714,000

$850,000

+ 19.0%

YTD 2012 YTD 2013

Percent Change

9-2013

9-2010

5,361

$750,000

9-2012

- 1.3%

407

9-2011

695

402

9-2010

Percent Change

704

New Listings

9-2013

9-2013

Pending Sales
Sold Listings
9-2010

9-2011

9-2012

9-2013

Median Sales Price
9-2010

9-2011

9-2012

9-2013

9-2010

9-2011

9-2012

9-2013

Average Sales Price

$914,955 $1,072,512 + 17.2%

Days on Market

$903,735 $1,095,236 + 21.2%

49

39

- 36.1%

1,086

- 19.5%

--

--

--

74.0%

+ 23.3%

49.1%

70.4%

+ 43.4%

104.3%

107.7%

+ 3.3%

102.4%

107.6%

+ 5.1%

60

47

- 21.4%

60

46

- 23.9%

2.9

9-2012

61

60.0%

9-2011

- 34.7%

1,349

9-2010

32

2.2

- 24.1%

--

--

--

9-2013

Active Listings
9-2010

9-2011

9-2012

9-2013

9-2010

9-2011

9-2012

9-2013

% of Properties Sold Over List Price

% of List Price Received
9-2010

9-2011

9-2012

9-2013

Affordability Ratio
9-2010

9-2011

9-2012

9-2013

9-2010

9-2011

9-2012

9-2013

Months Supply

Current as of October 14, 2013. All data from the San Francisco MLS. Powered by 10K Research and Marketing. | Click for Cover Page | 15
Activity by District
Key metrics by report month for the districts of San Fransisco.

SF District 1:

Northwest (Sea Cliff, Lake, Jordan Park / Laurel Heights, Outer Richmond, Central Richmond, Inner Richmond, Lone Mountain)

SF District 2:

Central West (Outer Sunset, Central Sunset, Inner Sunset, Outer Parkside, Parkside, Inner Parkside, Golden Gate Heights)

SF District 3:

Southwest (Pine Lake Park, Lake Shore, Merced Manor, Stonestown, Lakeside, Merced Heights, Ingleside, Ingleside Heights, Oceanview)

SF District 4:

Twin Peaks W (Forest Hill (& Ext), W Portal, St Francis Wd, Balboa Terr, Mt Dav Manor, Ingleside Terr, Monterey Hts, Wstwd Pk & H'lnds, Shrwd Fst, Miraloma Pk, Dmnd Hts, Mdtwn Terr)

SF District 5:

Central (Haight Ashbury, Cole Vly / Prnssus Hts, Clarndn Hts, Corona Hts, Twin Pks, Glen Pk, Noe Vly, Eureka Vly / Dolores Hts, Mission Dolores, Duboce Trngl, Buena Vista / Ashbury Hts)

SF District 6:

Central North (Lower Pacific Heights, Anza Vista, Western Addition, North Panhandle, Alamo Square, Hayes Valley)

SF District 7:

North (Marina, Cow Hollow, Presidio Heights, Pacific Heights)

SF District 8:

Northeast (North Waterfront, North Beach, Russian Hill, Telegraph Hill, Nob Hill, Financial District / Barbary Coast, Downtown, Van Ness / Civic Center, Tenderloin)

SF District 9:

Central East (Yerba Buena, South Beach, South of Market, Mission Bay, Inner Mission, Potrero Hill, Central Waterfront / Dogpatch, Bernal Heights)

SF District 10:

Southeast (Outer Mission, Mission Terr, Excelsior, Portola, Bayview, Silver Terr, Hunters Pt, Candlestick Pt, Bayview Hts, Little Hollywood, Visitation Vly, Crocker Amazon)

Active Listings

Sold Listings

9-2012

9-2013

+/–

9-2012

9-2013

Median Sales Price
+/–

9-2012

Days on Market

9-2013

+/–

9-2012

9-2013

Months Supply
+/–

9-2012

9-2013

+/–

Single Family
1

SF District 1

46

38

-17.4%

11

13

+18.2%

$1,165,000

$908,000

-22.1%

45

36

-20.2%

2.6

2.0

-22.2%

2

SF District 2

82

86

+4.9%

24

40

+66.7%

$832,750

$860,250

+3.3%

35

30

-13.1%

2.5

2.2

-12.5%

3

SF District 3

39

34

-12.8%

20

12

-40.0%

$585,000

$767,500

+31.2%

31

22

-28.7%

2.4

2.3

-5.1%

4

SF District 4

79

55

-30.4%

26

22

-15.4%

$865,000

$1,300,000

+50.3%

31

31

-1.0%

3.0

1.9

-35.0%

5

SF District 5

79

50

-36.7%

59

23

-61.0%

$1,390,000

$1,545,000

+11.2%

26

31

+19.4%

2.5

1.5

-39.1%

6

SF District 6

21

9

-57.1%

27

4

-85.2%

$1,827,500

$1,190,000

-34.9%

52

39

-25.5%

6.5

2.2

-66.7%

7

SF District 7

49

29

-40.8%

19

7

-63.2%

$2,550,000

$5,250,000

+105.9%

35

16

-55.1%

5.1

2.5

-51.0%

8

SF District 8

13

9

-30.8%

40

0

-100.0%

$1,765,000

$0

-100.0%

83

0

-100.0%

5.7

3.7

-34.9%

9

SF District 9

41

37

-9.8%

104

23

-77.9%

$829,000

$1,050,000

+26.7%

43

24

-45.1%

2.1

1.6

-23.4%

148

97

-34.5%

67

36

-46.3%

$483,500

$660,000

+36.5%

66

33

-49.8%

2.8

1.9

-29.6%

+6.5%

82

22

-72.9%

2.9

2.1

-26.2%

10 SF District 10
Condo/TIC/Coop
1

SF District 1

40

29

-27.5%

10

12

+20.0%

$697,000

$742,500

2

SF District 2

19

22

+15.8%

4

6

+50.0%

$774,000

$850,000

+9.8%

83

33

-59.7%

4.3

4.9

+13.6%

3

SF District 3

4

7

+75.0%

4

1

-75.0%

$325,000

$785,000

+141.5%

96

20

-79.2%

1.1

2.8

+152.1%

4

SF District 4

19

11

-42.1%

1

1

0.0%

$299,000

$475,000

+58.9%

85

29

-65.9%

4.5

2.2

-50.8%

5

SF District 5

114

71

-37.7%

35

40

+14.3%

$959,000

$1,127,500

+17.6%

41

30

-27.8%

3.2

1.7

-48.7%

6

SF District 6

54

77

+42.6%

25

26

+4.0%

$803,000

$814,500

+1.4%

57

35

-38.7%

2.1

2.7

+26.4%

7

SF District 7

89

66

-25.8%

16

20

+25.0%

$1,347,500

$1,300,500

-3.5%

26

38

+43.5%

3.4

2.0

-40.3%

8

SF District 8

140

137

-2.1%

37

28

-24.3%

$605,000

$792,500

+31.0%

56

34

-39.4%

2.9

3.1

+6.6%

9

SF District 9

243

203

-16.5%

89

85

-4.5%

$750,000

$750,000

0.0%

48

37

-23.5%

3.0

2.2

-28.0%

30

19

-36.7%

7

5

-28.6%

$350,000

$420,000

+20.0%

80

58

-27.5%

4.3

3.1

-29.0%

10 SF District 10

Current as of October 14, 2013. All data from the San Francisco MLS. Powered by 10K Research and Marketing. | Click for Cover Page | 16

Contenu connexe

Tendances

2013 Annual Historical Data
2013 Annual Historical Data2013 Annual Historical Data
2013 Annual Historical DataRonny Budiutama
 
San Francisco Market Focus July 2013
San Francisco Market Focus July 2013San Francisco Market Focus July 2013
San Francisco Market Focus July 2013Ronny Budiutama
 
San Francisco Market Focus Report July
San Francisco Market Focus Report JulySan Francisco Market Focus Report July
San Francisco Market Focus Report JulyRonny Budiutama
 
San Francisco Real Estate Housing Market December 2016
San Francisco Real Estate Housing Market December 2016San Francisco Real Estate Housing Market December 2016
San Francisco Real Estate Housing Market December 2016Ronny Budiutama
 
San Francisco Market Focus Report October 2018
San Francisco Market Focus Report October 2018San Francisco Market Focus Report October 2018
San Francisco Market Focus Report October 2018Ronny Budiutama
 
San Francisco Market Focus May 2017
San Francisco Market Focus May 2017San Francisco Market Focus May 2017
San Francisco Market Focus May 2017Ronny Budiutama
 
San Francisco Market Focus April 2017
San Francisco Market Focus April 2017San Francisco Market Focus April 2017
San Francisco Market Focus April 2017Ronny Budiutama
 
San Francisco Market Focus June 2017
San Francisco Market Focus June 2017San Francisco Market Focus June 2017
San Francisco Market Focus June 2017Ronny Budiutama
 
San Francisco Market Report September 2021
San Francisco Market Report September 2021San Francisco Market Report September 2021
San Francisco Market Report September 2021Ronny Budiutama
 
San Francisco Market Report For July 2021
San Francisco Market Report For July 2021San Francisco Market Report For July 2021
San Francisco Market Report For July 2021Ronny Budiutama
 
San Francisco Market Report August 2021
San Francisco Market Report August 2021San Francisco Market Report August 2021
San Francisco Market Report August 2021Ronny Budiutama
 
San Francisco Market Report October 2021
San Francisco Market Report October 2021San Francisco Market Report October 2021
San Francisco Market Report October 2021Ronny Budiutama
 
San Francisco Market Focus Report May
San Francisco Market Focus Report MaySan Francisco Market Focus Report May
San Francisco Market Focus Report MayRonny Budiutama
 
San Francisco Market Report February 2021
San Francisco Market Report February 2021San Francisco Market Report February 2021
San Francisco Market Report February 2021Ronny Budiutama
 
San Francisco Market Report December 2021
San Francisco Market Report December 2021San Francisco Market Report December 2021
San Francisco Market Report December 2021Ronny Budiutama
 
San Francisco Market Focus November 2017
San Francisco Market Focus November 2017San Francisco Market Focus November 2017
San Francisco Market Focus November 2017Ronny Budiutama
 
San Francisco Market Report November 2021
San Francisco Market Report November 2021San Francisco Market Report November 2021
San Francisco Market Report November 2021Ronny Budiutama
 
San Francisco Market Report June 2021
San Francisco Market Report June 2021San Francisco Market Report June 2021
San Francisco Market Report June 2021Ronny Budiutama
 
San Francisco Market Report May 2021
San Francisco Market Report May 2021San Francisco Market Report May 2021
San Francisco Market Report May 2021Ronny Budiutama
 
San Francisco Market Report April 2021
San Francisco Market Report April 2021San Francisco Market Report April 2021
San Francisco Market Report April 2021Ronny Budiutama
 

Tendances (20)

2013 Annual Historical Data
2013 Annual Historical Data2013 Annual Historical Data
2013 Annual Historical Data
 
San Francisco Market Focus July 2013
San Francisco Market Focus July 2013San Francisco Market Focus July 2013
San Francisco Market Focus July 2013
 
San Francisco Market Focus Report July
San Francisco Market Focus Report JulySan Francisco Market Focus Report July
San Francisco Market Focus Report July
 
San Francisco Real Estate Housing Market December 2016
San Francisco Real Estate Housing Market December 2016San Francisco Real Estate Housing Market December 2016
San Francisco Real Estate Housing Market December 2016
 
San Francisco Market Focus Report October 2018
San Francisco Market Focus Report October 2018San Francisco Market Focus Report October 2018
San Francisco Market Focus Report October 2018
 
San Francisco Market Focus May 2017
San Francisco Market Focus May 2017San Francisco Market Focus May 2017
San Francisco Market Focus May 2017
 
San Francisco Market Focus April 2017
San Francisco Market Focus April 2017San Francisco Market Focus April 2017
San Francisco Market Focus April 2017
 
San Francisco Market Focus June 2017
San Francisco Market Focus June 2017San Francisco Market Focus June 2017
San Francisco Market Focus June 2017
 
San Francisco Market Report September 2021
San Francisco Market Report September 2021San Francisco Market Report September 2021
San Francisco Market Report September 2021
 
San Francisco Market Report For July 2021
San Francisco Market Report For July 2021San Francisco Market Report For July 2021
San Francisco Market Report For July 2021
 
San Francisco Market Report August 2021
San Francisco Market Report August 2021San Francisco Market Report August 2021
San Francisco Market Report August 2021
 
San Francisco Market Report October 2021
San Francisco Market Report October 2021San Francisco Market Report October 2021
San Francisco Market Report October 2021
 
San Francisco Market Focus Report May
San Francisco Market Focus Report MaySan Francisco Market Focus Report May
San Francisco Market Focus Report May
 
San Francisco Market Report February 2021
San Francisco Market Report February 2021San Francisco Market Report February 2021
San Francisco Market Report February 2021
 
San Francisco Market Report December 2021
San Francisco Market Report December 2021San Francisco Market Report December 2021
San Francisco Market Report December 2021
 
San Francisco Market Focus November 2017
San Francisco Market Focus November 2017San Francisco Market Focus November 2017
San Francisco Market Focus November 2017
 
San Francisco Market Report November 2021
San Francisco Market Report November 2021San Francisco Market Report November 2021
San Francisco Market Report November 2021
 
San Francisco Market Report June 2021
San Francisco Market Report June 2021San Francisco Market Report June 2021
San Francisco Market Report June 2021
 
San Francisco Market Report May 2021
San Francisco Market Report May 2021San Francisco Market Report May 2021
San Francisco Market Report May 2021
 
San Francisco Market Report April 2021
San Francisco Market Report April 2021San Francisco Market Report April 2021
San Francisco Market Report April 2021
 

Similaire à San Francisco Market Focus September 2013

San Francisco Market Focus October 2013
San Francisco Market Focus October 2013San Francisco Market Focus October 2013
San Francisco Market Focus October 2013Ronny Budiutama
 
San Francisco Market Focus May 2013
San Francisco Market Focus May 2013San Francisco Market Focus May 2013
San Francisco Market Focus May 2013Ronny Budiutama
 
San Francisco Market Focus Jan 2014
San Francisco Market Focus Jan 2014 San Francisco Market Focus Jan 2014
San Francisco Market Focus Jan 2014 Ronny Budiutama
 
San Francisco Market Focus September 2014
San Francisco Market Focus September 2014San Francisco Market Focus September 2014
San Francisco Market Focus September 2014Ronny Budiutama
 
San Francisco Market Focus October 2014
San Francisco Market Focus October 2014San Francisco Market Focus October 2014
San Francisco Market Focus October 2014Ronny Budiutama
 
San Francisco Market Focus July 2015
San Francisco Market Focus July 2015San Francisco Market Focus July 2015
San Francisco Market Focus July 2015Ronny Budiutama
 
San Francisco Real Estate Market Report August 2014
San Francisco Real Estate Market Report August 2014San Francisco Real Estate Market Report August 2014
San Francisco Real Estate Market Report August 2014Ronny Budiutama
 
June 2013's Monthly Indicators report - Boston Real Estate Market Trends
June 2013's Monthly Indicators report - Boston Real Estate Market TrendsJune 2013's Monthly Indicators report - Boston Real Estate Market Trends
June 2013's Monthly Indicators report - Boston Real Estate Market TrendsUnit Realty Group
 
San Francisco Market Focus September 2015
San Francisco Market Focus September 2015San Francisco Market Focus September 2015
San Francisco Market Focus September 2015Ronny Budiutama
 
San Francisco Market Focus June 2015
San Francisco Market Focus June 2015San Francisco Market Focus June 2015
San Francisco Market Focus June 2015Ronny Budiutama
 
San Francisco Market Focus December 2015
San Francisco Market Focus December 2015San Francisco Market Focus December 2015
San Francisco Market Focus December 2015Ronny Budiutama
 
San Francisco Market Focus July 2014
San Francisco Market Focus July 2014San Francisco Market Focus July 2014
San Francisco Market Focus July 2014Ronny Budiutama
 
San Francisco Market Focus April 2015
San Francisco Market Focus April 2015San Francisco Market Focus April 2015
San Francisco Market Focus April 2015Ronny Budiutama
 
San Francisco Market Focus June 2016
San Francisco Market Focus June 2016San Francisco Market Focus June 2016
San Francisco Market Focus June 2016Ronny Budiutama
 
San Francisco market report September 2020
San Francisco market report September 2020San Francisco market report September 2020
San Francisco market report September 2020Ronny Budiutama
 
April 2013's Monthly Indicators report - Boston Real Estate Market Trends
April 2013's Monthly Indicators report - Boston Real Estate Market TrendsApril 2013's Monthly Indicators report - Boston Real Estate Market Trends
April 2013's Monthly Indicators report - Boston Real Estate Market TrendsUnit Realty Group
 
San Francisco Market Data November 2014
San Francisco Market Data November 2014San Francisco Market Data November 2014
San Francisco Market Data November 2014Ronny Budiutama
 
San Francisco Market Focus October 2016
San Francisco Market Focus October 2016San Francisco Market Focus October 2016
San Francisco Market Focus October 2016Ronny Budiutama
 
San Francisco Market Focus October 2015
San Francisco Market Focus October 2015San Francisco Market Focus October 2015
San Francisco Market Focus October 2015Ronny Budiutama
 
Georgia Association of Realtors Stats for December 2013
Georgia Association of Realtors Stats for December 2013Georgia Association of Realtors Stats for December 2013
Georgia Association of Realtors Stats for December 2013Sandra Watkins
 

Similaire à San Francisco Market Focus September 2013 (20)

San Francisco Market Focus October 2013
San Francisco Market Focus October 2013San Francisco Market Focus October 2013
San Francisco Market Focus October 2013
 
San Francisco Market Focus May 2013
San Francisco Market Focus May 2013San Francisco Market Focus May 2013
San Francisco Market Focus May 2013
 
San Francisco Market Focus Jan 2014
San Francisco Market Focus Jan 2014 San Francisco Market Focus Jan 2014
San Francisco Market Focus Jan 2014
 
San Francisco Market Focus September 2014
San Francisco Market Focus September 2014San Francisco Market Focus September 2014
San Francisco Market Focus September 2014
 
San Francisco Market Focus October 2014
San Francisco Market Focus October 2014San Francisco Market Focus October 2014
San Francisco Market Focus October 2014
 
San Francisco Market Focus July 2015
San Francisco Market Focus July 2015San Francisco Market Focus July 2015
San Francisco Market Focus July 2015
 
San Francisco Real Estate Market Report August 2014
San Francisco Real Estate Market Report August 2014San Francisco Real Estate Market Report August 2014
San Francisco Real Estate Market Report August 2014
 
June 2013's Monthly Indicators report - Boston Real Estate Market Trends
June 2013's Monthly Indicators report - Boston Real Estate Market TrendsJune 2013's Monthly Indicators report - Boston Real Estate Market Trends
June 2013's Monthly Indicators report - Boston Real Estate Market Trends
 
San Francisco Market Focus September 2015
San Francisco Market Focus September 2015San Francisco Market Focus September 2015
San Francisco Market Focus September 2015
 
San Francisco Market Focus June 2015
San Francisco Market Focus June 2015San Francisco Market Focus June 2015
San Francisco Market Focus June 2015
 
San Francisco Market Focus December 2015
San Francisco Market Focus December 2015San Francisco Market Focus December 2015
San Francisco Market Focus December 2015
 
San Francisco Market Focus July 2014
San Francisco Market Focus July 2014San Francisco Market Focus July 2014
San Francisco Market Focus July 2014
 
San Francisco Market Focus April 2015
San Francisco Market Focus April 2015San Francisco Market Focus April 2015
San Francisco Market Focus April 2015
 
San Francisco Market Focus June 2016
San Francisco Market Focus June 2016San Francisco Market Focus June 2016
San Francisco Market Focus June 2016
 
San Francisco market report September 2020
San Francisco market report September 2020San Francisco market report September 2020
San Francisco market report September 2020
 
April 2013's Monthly Indicators report - Boston Real Estate Market Trends
April 2013's Monthly Indicators report - Boston Real Estate Market TrendsApril 2013's Monthly Indicators report - Boston Real Estate Market Trends
April 2013's Monthly Indicators report - Boston Real Estate Market Trends
 
San Francisco Market Data November 2014
San Francisco Market Data November 2014San Francisco Market Data November 2014
San Francisco Market Data November 2014
 
San Francisco Market Focus October 2016
San Francisco Market Focus October 2016San Francisco Market Focus October 2016
San Francisco Market Focus October 2016
 
San Francisco Market Focus October 2015
San Francisco Market Focus October 2015San Francisco Market Focus October 2015
San Francisco Market Focus October 2015
 
Georgia Association of Realtors Stats for December 2013
Georgia Association of Realtors Stats for December 2013Georgia Association of Realtors Stats for December 2013
Georgia Association of Realtors Stats for December 2013
 

Plus de Ronny Budiutama

San Francisco January 2024 Market Report
San Francisco January 2024 Market ReportSan Francisco January 2024 Market Report
San Francisco January 2024 Market ReportRonny Budiutama
 
San Francisco December 2023 Market Report
San Francisco December 2023 Market ReportSan Francisco December 2023 Market Report
San Francisco December 2023 Market ReportRonny Budiutama
 
San Francisco November 2023 Market Report
San Francisco November 2023 Market ReportSan Francisco November 2023 Market Report
San Francisco November 2023 Market ReportRonny Budiutama
 
2023 Annual San Francisco Housing Market
2023 Annual San Francisco Housing Market2023 Annual San Francisco Housing Market
2023 Annual San Francisco Housing MarketRonny Budiutama
 
October 2023 Report: San Francisco Real Estate Market Insights
October 2023 Report: San Francisco Real Estate Market InsightsOctober 2023 Report: San Francisco Real Estate Market Insights
October 2023 Report: San Francisco Real Estate Market InsightsRonny Budiutama
 
CA Weekly MLS Market Data Report - August 2023
CA Weekly MLS Market Data Report - August 2023CA Weekly MLS Market Data Report - August 2023
CA Weekly MLS Market Data Report - August 2023Ronny Budiutama
 
San Francisco Market Report July 2023.pdf
San Francisco Market Report July 2023.pdfSan Francisco Market Report July 2023.pdf
San Francisco Market Report July 2023.pdfRonny Budiutama
 
San Francisco May 2023 Market Report.pdf
San Francisco May 2023 Market Report.pdfSan Francisco May 2023 Market Report.pdf
San Francisco May 2023 Market Report.pdfRonny Budiutama
 
San Francisco June 2023 Market Report.pdf
San Francisco June 2023 Market Report.pdfSan Francisco June 2023 Market Report.pdf
San Francisco June 2023 Market Report.pdfRonny Budiutama
 
San Francisco Market Report March 2023.pdf
San Francisco Market Report March 2023.pdfSan Francisco Market Report March 2023.pdf
San Francisco Market Report March 2023.pdfRonny Budiutama
 
San Francisco Market Report February 2023
San Francisco Market Report February 2023San Francisco Market Report February 2023
San Francisco Market Report February 2023Ronny Budiutama
 
San Francisco Market Report January 2023.pdf
San Francisco Market Report January 2023.pdfSan Francisco Market Report January 2023.pdf
San Francisco Market Report January 2023.pdfRonny Budiutama
 
Annual Report on the San Francisco County Housing Market.pdf
Annual Report on the San Francisco County Housing Market.pdfAnnual Report on the San Francisco County Housing Market.pdf
Annual Report on the San Francisco County Housing Market.pdfRonny Budiutama
 
San Francisco Market Report December 2022.pdf
San Francisco Market Report December 2022.pdfSan Francisco Market Report December 2022.pdf
San Francisco Market Report December 2022.pdfRonny Budiutama
 
San Francisco Market Report November 2022.pdf
San Francisco Market Report November 2022.pdfSan Francisco Market Report November 2022.pdf
San Francisco Market Report November 2022.pdfRonny Budiutama
 
San Francisco Market Report October 2022.pdf
San Francisco Market Report October 2022.pdfSan Francisco Market Report October 2022.pdf
San Francisco Market Report October 2022.pdfRonny Budiutama
 
San Francisco Market Report September 2022.pdf
San Francisco Market Report September 2022.pdfSan Francisco Market Report September 2022.pdf
San Francisco Market Report September 2022.pdfRonny Budiutama
 
San Francisco Market Report August 2022.pdf
San Francisco Market Report August 2022.pdfSan Francisco Market Report August 2022.pdf
San Francisco Market Report August 2022.pdfRonny Budiutama
 
San Francisco Market Report July 2022.pdf
San Francisco Market Report July 2022.pdfSan Francisco Market Report July 2022.pdf
San Francisco Market Report July 2022.pdfRonny Budiutama
 
San Francisco Market Report June 2022.pdf
San Francisco Market Report June 2022.pdfSan Francisco Market Report June 2022.pdf
San Francisco Market Report June 2022.pdfRonny Budiutama
 

Plus de Ronny Budiutama (20)

San Francisco January 2024 Market Report
San Francisco January 2024 Market ReportSan Francisco January 2024 Market Report
San Francisco January 2024 Market Report
 
San Francisco December 2023 Market Report
San Francisco December 2023 Market ReportSan Francisco December 2023 Market Report
San Francisco December 2023 Market Report
 
San Francisco November 2023 Market Report
San Francisco November 2023 Market ReportSan Francisco November 2023 Market Report
San Francisco November 2023 Market Report
 
2023 Annual San Francisco Housing Market
2023 Annual San Francisco Housing Market2023 Annual San Francisco Housing Market
2023 Annual San Francisco Housing Market
 
October 2023 Report: San Francisco Real Estate Market Insights
October 2023 Report: San Francisco Real Estate Market InsightsOctober 2023 Report: San Francisco Real Estate Market Insights
October 2023 Report: San Francisco Real Estate Market Insights
 
CA Weekly MLS Market Data Report - August 2023
CA Weekly MLS Market Data Report - August 2023CA Weekly MLS Market Data Report - August 2023
CA Weekly MLS Market Data Report - August 2023
 
San Francisco Market Report July 2023.pdf
San Francisco Market Report July 2023.pdfSan Francisco Market Report July 2023.pdf
San Francisco Market Report July 2023.pdf
 
San Francisco May 2023 Market Report.pdf
San Francisco May 2023 Market Report.pdfSan Francisco May 2023 Market Report.pdf
San Francisco May 2023 Market Report.pdf
 
San Francisco June 2023 Market Report.pdf
San Francisco June 2023 Market Report.pdfSan Francisco June 2023 Market Report.pdf
San Francisco June 2023 Market Report.pdf
 
San Francisco Market Report March 2023.pdf
San Francisco Market Report March 2023.pdfSan Francisco Market Report March 2023.pdf
San Francisco Market Report March 2023.pdf
 
San Francisco Market Report February 2023
San Francisco Market Report February 2023San Francisco Market Report February 2023
San Francisco Market Report February 2023
 
San Francisco Market Report January 2023.pdf
San Francisco Market Report January 2023.pdfSan Francisco Market Report January 2023.pdf
San Francisco Market Report January 2023.pdf
 
Annual Report on the San Francisco County Housing Market.pdf
Annual Report on the San Francisco County Housing Market.pdfAnnual Report on the San Francisco County Housing Market.pdf
Annual Report on the San Francisco County Housing Market.pdf
 
San Francisco Market Report December 2022.pdf
San Francisco Market Report December 2022.pdfSan Francisco Market Report December 2022.pdf
San Francisco Market Report December 2022.pdf
 
San Francisco Market Report November 2022.pdf
San Francisco Market Report November 2022.pdfSan Francisco Market Report November 2022.pdf
San Francisco Market Report November 2022.pdf
 
San Francisco Market Report October 2022.pdf
San Francisco Market Report October 2022.pdfSan Francisco Market Report October 2022.pdf
San Francisco Market Report October 2022.pdf
 
San Francisco Market Report September 2022.pdf
San Francisco Market Report September 2022.pdfSan Francisco Market Report September 2022.pdf
San Francisco Market Report September 2022.pdf
 
San Francisco Market Report August 2022.pdf
San Francisco Market Report August 2022.pdfSan Francisco Market Report August 2022.pdf
San Francisco Market Report August 2022.pdf
 
San Francisco Market Report July 2022.pdf
San Francisco Market Report July 2022.pdfSan Francisco Market Report July 2022.pdf
San Francisco Market Report July 2022.pdf
 
San Francisco Market Report June 2022.pdf
San Francisco Market Report June 2022.pdfSan Francisco Market Report June 2022.pdf
San Francisco Market Report June 2022.pdf
 

Dernier

8447779800, Low rate Call girls in Uttam Nagar Delhi NCR
8447779800, Low rate Call girls in Uttam Nagar Delhi NCR8447779800, Low rate Call girls in Uttam Nagar Delhi NCR
8447779800, Low rate Call girls in Uttam Nagar Delhi NCRashishs7044
 
Call US-88OO1O2216 Call Girls In Mahipalpur Female Escort Service
Call US-88OO1O2216 Call Girls In Mahipalpur Female Escort ServiceCall US-88OO1O2216 Call Girls In Mahipalpur Female Escort Service
Call US-88OO1O2216 Call Girls In Mahipalpur Female Escort Servicecallgirls2057
 
Market Sizes Sample Report - 2024 Edition
Market Sizes Sample Report - 2024 EditionMarket Sizes Sample Report - 2024 Edition
Market Sizes Sample Report - 2024 EditionMintel Group
 
International Business Environments and Operations 16th Global Edition test b...
International Business Environments and Operations 16th Global Edition test b...International Business Environments and Operations 16th Global Edition test b...
International Business Environments and Operations 16th Global Edition test b...ssuserf63bd7
 
Call Us 📲8800102216📞 Call Girls In DLF City Gurgaon
Call Us 📲8800102216📞 Call Girls In DLF City GurgaonCall Us 📲8800102216📞 Call Girls In DLF City Gurgaon
Call Us 📲8800102216📞 Call Girls In DLF City Gurgaoncallgirls2057
 
8447779800, Low rate Call girls in New Ashok Nagar Delhi NCR
8447779800, Low rate Call girls in New Ashok Nagar Delhi NCR8447779800, Low rate Call girls in New Ashok Nagar Delhi NCR
8447779800, Low rate Call girls in New Ashok Nagar Delhi NCRashishs7044
 
Memorándum de Entendimiento (MoU) entre Codelco y SQM
Memorándum de Entendimiento (MoU) entre Codelco y SQMMemorándum de Entendimiento (MoU) entre Codelco y SQM
Memorándum de Entendimiento (MoU) entre Codelco y SQMVoces Mineras
 
Innovation Conference 5th March 2024.pdf
Innovation Conference 5th March 2024.pdfInnovation Conference 5th March 2024.pdf
Innovation Conference 5th March 2024.pdfrichard876048
 
Buy gmail accounts.pdf Buy Old Gmail Accounts
Buy gmail accounts.pdf Buy Old Gmail AccountsBuy gmail accounts.pdf Buy Old Gmail Accounts
Buy gmail accounts.pdf Buy Old Gmail AccountsBuy Verified Accounts
 
TriStar Gold Corporate Presentation - April 2024
TriStar Gold Corporate Presentation - April 2024TriStar Gold Corporate Presentation - April 2024
TriStar Gold Corporate Presentation - April 2024Adnet Communications
 
(Best) ENJOY Call Girls in Faridabad Ex | 8377087607
(Best) ENJOY Call Girls in Faridabad Ex | 8377087607(Best) ENJOY Call Girls in Faridabad Ex | 8377087607
(Best) ENJOY Call Girls in Faridabad Ex | 8377087607dollysharma2066
 
Horngren’s Financial & Managerial Accounting, 7th edition by Miller-Nobles so...
Horngren’s Financial & Managerial Accounting, 7th edition by Miller-Nobles so...Horngren’s Financial & Managerial Accounting, 7th edition by Miller-Nobles so...
Horngren’s Financial & Managerial Accounting, 7th edition by Miller-Nobles so...ssuserf63bd7
 
1911 Gold Corporate Presentation Apr 2024.pdf
1911 Gold Corporate Presentation Apr 2024.pdf1911 Gold Corporate Presentation Apr 2024.pdf
1911 Gold Corporate Presentation Apr 2024.pdfShaun Heinrichs
 
Annual General Meeting Presentation Slides
Annual General Meeting Presentation SlidesAnnual General Meeting Presentation Slides
Annual General Meeting Presentation SlidesKeppelCorporation
 
8447779800, Low rate Call girls in Kotla Mubarakpur Delhi NCR
8447779800, Low rate Call girls in Kotla Mubarakpur Delhi NCR8447779800, Low rate Call girls in Kotla Mubarakpur Delhi NCR
8447779800, Low rate Call girls in Kotla Mubarakpur Delhi NCRashishs7044
 
Ten Organizational Design Models to align structure and operations to busines...
Ten Organizational Design Models to align structure and operations to busines...Ten Organizational Design Models to align structure and operations to busines...
Ten Organizational Design Models to align structure and operations to busines...Seta Wicaksana
 
Traction part 2 - EOS Model JAX Bridges.
Traction part 2 - EOS Model JAX Bridges.Traction part 2 - EOS Model JAX Bridges.
Traction part 2 - EOS Model JAX Bridges.Anamaria Contreras
 
Cybersecurity Awareness Training Presentation v2024.03
Cybersecurity Awareness Training Presentation v2024.03Cybersecurity Awareness Training Presentation v2024.03
Cybersecurity Awareness Training Presentation v2024.03DallasHaselhorst
 
Cyber Security Training in Office Environment
Cyber Security Training in Office EnvironmentCyber Security Training in Office Environment
Cyber Security Training in Office Environmentelijahj01012
 

Dernier (20)

8447779800, Low rate Call girls in Uttam Nagar Delhi NCR
8447779800, Low rate Call girls in Uttam Nagar Delhi NCR8447779800, Low rate Call girls in Uttam Nagar Delhi NCR
8447779800, Low rate Call girls in Uttam Nagar Delhi NCR
 
Call US-88OO1O2216 Call Girls In Mahipalpur Female Escort Service
Call US-88OO1O2216 Call Girls In Mahipalpur Female Escort ServiceCall US-88OO1O2216 Call Girls In Mahipalpur Female Escort Service
Call US-88OO1O2216 Call Girls In Mahipalpur Female Escort Service
 
Market Sizes Sample Report - 2024 Edition
Market Sizes Sample Report - 2024 EditionMarket Sizes Sample Report - 2024 Edition
Market Sizes Sample Report - 2024 Edition
 
International Business Environments and Operations 16th Global Edition test b...
International Business Environments and Operations 16th Global Edition test b...International Business Environments and Operations 16th Global Edition test b...
International Business Environments and Operations 16th Global Edition test b...
 
Call Us 📲8800102216📞 Call Girls In DLF City Gurgaon
Call Us 📲8800102216📞 Call Girls In DLF City GurgaonCall Us 📲8800102216📞 Call Girls In DLF City Gurgaon
Call Us 📲8800102216📞 Call Girls In DLF City Gurgaon
 
8447779800, Low rate Call girls in New Ashok Nagar Delhi NCR
8447779800, Low rate Call girls in New Ashok Nagar Delhi NCR8447779800, Low rate Call girls in New Ashok Nagar Delhi NCR
8447779800, Low rate Call girls in New Ashok Nagar Delhi NCR
 
Memorándum de Entendimiento (MoU) entre Codelco y SQM
Memorándum de Entendimiento (MoU) entre Codelco y SQMMemorándum de Entendimiento (MoU) entre Codelco y SQM
Memorándum de Entendimiento (MoU) entre Codelco y SQM
 
Innovation Conference 5th March 2024.pdf
Innovation Conference 5th March 2024.pdfInnovation Conference 5th March 2024.pdf
Innovation Conference 5th March 2024.pdf
 
Buy gmail accounts.pdf Buy Old Gmail Accounts
Buy gmail accounts.pdf Buy Old Gmail AccountsBuy gmail accounts.pdf Buy Old Gmail Accounts
Buy gmail accounts.pdf Buy Old Gmail Accounts
 
TriStar Gold Corporate Presentation - April 2024
TriStar Gold Corporate Presentation - April 2024TriStar Gold Corporate Presentation - April 2024
TriStar Gold Corporate Presentation - April 2024
 
(Best) ENJOY Call Girls in Faridabad Ex | 8377087607
(Best) ENJOY Call Girls in Faridabad Ex | 8377087607(Best) ENJOY Call Girls in Faridabad Ex | 8377087607
(Best) ENJOY Call Girls in Faridabad Ex | 8377087607
 
Horngren’s Financial & Managerial Accounting, 7th edition by Miller-Nobles so...
Horngren’s Financial & Managerial Accounting, 7th edition by Miller-Nobles so...Horngren’s Financial & Managerial Accounting, 7th edition by Miller-Nobles so...
Horngren’s Financial & Managerial Accounting, 7th edition by Miller-Nobles so...
 
1911 Gold Corporate Presentation Apr 2024.pdf
1911 Gold Corporate Presentation Apr 2024.pdf1911 Gold Corporate Presentation Apr 2024.pdf
1911 Gold Corporate Presentation Apr 2024.pdf
 
Annual General Meeting Presentation Slides
Annual General Meeting Presentation SlidesAnnual General Meeting Presentation Slides
Annual General Meeting Presentation Slides
 
8447779800, Low rate Call girls in Kotla Mubarakpur Delhi NCR
8447779800, Low rate Call girls in Kotla Mubarakpur Delhi NCR8447779800, Low rate Call girls in Kotla Mubarakpur Delhi NCR
8447779800, Low rate Call girls in Kotla Mubarakpur Delhi NCR
 
Ten Organizational Design Models to align structure and operations to busines...
Ten Organizational Design Models to align structure and operations to busines...Ten Organizational Design Models to align structure and operations to busines...
Ten Organizational Design Models to align structure and operations to busines...
 
Japan IT Week 2024 Brochure by 47Billion (English)
Japan IT Week 2024 Brochure by 47Billion (English)Japan IT Week 2024 Brochure by 47Billion (English)
Japan IT Week 2024 Brochure by 47Billion (English)
 
Traction part 2 - EOS Model JAX Bridges.
Traction part 2 - EOS Model JAX Bridges.Traction part 2 - EOS Model JAX Bridges.
Traction part 2 - EOS Model JAX Bridges.
 
Cybersecurity Awareness Training Presentation v2024.03
Cybersecurity Awareness Training Presentation v2024.03Cybersecurity Awareness Training Presentation v2024.03
Cybersecurity Awareness Training Presentation v2024.03
 
Cyber Security Training in Office Environment
Cyber Security Training in Office EnvironmentCyber Security Training in Office Environment
Cyber Security Training in Office Environment
 

San Francisco Market Focus September 2013

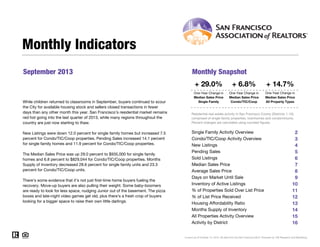
  • 1. Monthly Indicators September 2013 Monthly Snapshot + 29.0% While children returned to classrooms in September, buyers continued to scour the City for available housing stock and sellers closed transactions in fewer days than any other month this year. San Francisco’s residential market remains red hot going into the last quarter of 2013, while many regions throughout the country are just now starting to thaw. New Listings were down 12.0 percent for single family homes but increased 7.5 percent for Condo/TIC/Coop properties. Pending Sales increased 14.1 percent for single family homes and 11.9 percent for Condo/TIC/Coop properties. The Median Sales Price was up 29.0 percent to $935,000 for single family homes and 6.8 percent to $829,044 for Condo/TIC/Coop properties. Months Supply of Inventory decreased 28.6 percent for single family units and 23.3 percent for Condo/TIC/Coop units. There's some evidence that it's not just first-time home buyers fueling the recovery. Move-up buyers are also pulling their weight. Some baby-boomers are ready to look for less space, nudging Junior out of the basement. The pizza boxes and late-night video games get old, plus there's a fresh crop of buyers looking for a bigger space to raise their own little darlings. + 6.8% + 14.7% One-Year Change in Median Sales Price Single Family One-Year Change in Median Sales Price Condo/TIC/Coop One-Year Change in Median Sales Price All Property Types Residential real estate activity in San Francisco County (Districts 1-10), comprised of single-family properties, townhomes and condominiums. Percent changes are calculated using rounded figures. Single Family Activity Overview Condo/TIC/Coop Activity Overview New Listings Pending Sales Sold Listings Median Sales Price Average Sales Price Days on Market Until Sale Inventory of Active Listings % of Properties Sold Over List Price % of List Price Received Housing Affordability Ratio Months Supply of Inventory All Properties Activity Overview Activity by District 2 3 4 5 6 7 8 9 10 11 12 13 14 15 16 Current as of October 14, 2013. All data from the San Francisco MLS. Powered by 10K Research and Marketing.
  • 2. Single Family Activity Overview Key metrics by report month and for year-to-date (YTD) starting from the first of the year. Key Metrics Historical Sparkbars 9-2012 9-2011 9-2012 2,401 0.0% 210 + 14.1% 1,941 1,995 + 2.8% 180 + 0.6% 1,897 1,918 + 1.1% $935,000 + 29.0% $738,000 $910,000 + 23.3% YTD 2012 YTD 2013 Percent Change 9-2013 9-2010 2,401 $725,000 9-2012 - 12.0% 179 9-2011 279 184 9-2010 Percent Change 317 New Listings 9-2013 9-2013 Pending Sales Sold Listings 9-2010 9-2011 9-2012 9-2013 Median Sales Price 9-2010 9-2011 9-2012 9-2013 9-2010 9-2011 9-2012 9-2013 Average Sales Price $936,072 $1,232,567 + 31.7% $1,046,074 $1,281,335 + 22.5% Days on Market 46 36 - 35.7% 444 - 25.6% -- -- -- 78.9% + 14.8% 57.2% 76.5% + 33.7% 106.9% 110.0% + 2.9% 103.9% 110.3% + 6.2% 74 53 - 28.4% 73 55 - 24.7% 2.8 9-2012 56 68.7% 9-2011 - 34.8% 597 9-2010 30 2.0 - 28.6% -- -- -- 9-2013 Active Listings 9-2010 9-2011 9-2012 9-2013 9-2010 9-2011 9-2012 9-2013 % of Properties Sold Over List Price % of List Price Received 9-2010 9-2011 9-2012 9-2013 Affordability Ratio 9-2010 9-2011 9-2012 9-2013 9-2010 9-2011 9-2012 9-2013 Months Supply Current as of October 14, 2013. All data from the San Francisco MLS. Powered by 10K Research and Marketing. | Click for Cover Page | 2
  • 3. Condo/TIC/Coop Activity Overview Key metrics by report month and for year-to-date (YTD) starting from the first of the year. Key Metrics Historical Sparkbars 9-2012 244 + 11.9% 2,403 2,537 + 5.6% 224 - 1.8% 2,369 2,455 + 3.6% $829,044 + 6.8% $695,000 $820,000 + 18.0% $943,896 + 5.1% $789,817 $949,919 + 20.3% 52 35 - 32.7% 65 41 - 36.9% 752 642 - 14.6% -- -- -- 53.1% 70.1% + 32.0% 42.7% 65.7% + 53.9% 102.2% 105.9% + 3.6% 101.2% 105.5% + 4.2% 70 60 - 14.3% 77 61 - 20.8% 3.0 9-2012 + 8.3% $898,376 9-2011 3,206 2.3 - 23.3% -- -- -- YTD 2012 YTD 2013 Percent Change 9-2013 9-2010 2,960 $776,000 9-2012 + 7.5% 228 9-2011 416 218 9-2010 Percent Change 387 New Listings 9-2013 9-2013 Pending Sales Sold Listings 9-2010 9-2011 9-2012 9-2013 Median Sales Price 9-2010 9-2011 9-2012 9-2013 9-2010 9-2011 9-2012 9-2013 Average Sales Price Days on Market 9-2010 9-2011 9-2012 9-2013 Active Listings 9-2010 9-2011 9-2012 9-2013 9-2010 9-2011 9-2012 9-2013 % of Properties Sold Over List Price % of List Price Received 9-2010 9-2011 9-2012 9-2013 Affordability Ratio 9-2010 9-2011 9-2012 9-2013 9-2010 9-2011 9-2012 9-2013 Months Supply Current as of October 14, 2013. All data from the San Francisco MLS. Powered by 10K Research and Marketing. | Click for Cover Page | 3
  • 4. New Listings A count of the properties that have been newly listed on the market in a given month. Year to Date September - 12.9% 2011 2012 2013 2011 - 20.2% - 12.0% - 28.4% - 5.6% + 7.5% - 6.7% Single Family Condo/TIC/Coop 2012 2013 2011 2012 2013 - 15.3% 0.0% - 13.8% - 10.7% + 8.3% Single Family +36.1% 102 -12.8% 114 +2.7% 204 -17.7% 308 +1.3% 211 -18.2% 316 +2.9% 254 -12.1% 369 +12.5% 302 +15.3% 396 +15.1% 337 +30.1% 383 +2.4% 291 +12.4% 357 +6.9% 257 +0.8% 328 +21.9% 266 +4.7% 333 +6.4% Sep-2013 2013 +27.6% 211 Aug-2013 2012 305 +22.3% Jul-2013 2011 +11.2% 181 Jun-2013 279 287 Jan-2013 2,401 Oct-2012 May-2013 2,401 Year-Over-Year Change Apr-2013 317 Condo/TIC/ Coop Dec-2012 2,836 Year-Over-Year Change Nov-2012 3,206 2,960 Single Family Mar-2013 416 387 New Listings Feb-2013 410 397 3,314 279 -12.0% 416 +7.5% 12-Month Avg 248 +1.6% 320 +10.7% Condo/TIC/Coop Historical New Listings by Month Single Family 700 Condo/TIC/Coop 600 500 400 300 200 100 0 1-2005 1-2006 1-2007 1-2008 1-2009 1-2010 1-2011 1-2012 1-2013 Current as of October 14, 2013. All data from the San Francisco MLS. Powered by 10K Research and Marketing. | Click for Cover Page | 4
  • 5. Pending Sales A count of the properties on which offers have been accepted in a given month. Year to Date September Oct-2012 287 +27.0% 277 +37.8% Nov-2012 252 +15.6% 271 +21.5% 170 -1.7% 203 +23.0% Jan-2013 159 -6.5% 174 +6.7% 149 -21.6% 217 -0.9% 207 -10.0% 303 +9.0% Apr-2013 242 +3.0% 310 -3.1% May-2013 1,868 187 184 Year-Over-Year Change Mar-2013 195 1,941 Condo/TIC/ Coop Feb-2013 218 Year-Over-Year Change Dec-2012 2,403 244 210 Single Family 269 +10.2% 360 +13.9% Pending Sales 1,995 2,537 1,987 Jun-2013 2013 2011 2012 2013 2011 2012 2013 2011 2012 2013 + 7.7% - 5.6% + 14.1% - 0.5% + 16.6% + 11.9% + 7.1% + 3.9% + 2.8% + 11.1% + 20.9% + 5.6% Single Family Condo/TIC/Coop Single Family 290 -7.6% +11.1% 333 +16.4% 233 +3.6% 306 +5.9% Sep-2013 2012 +16.0% 251 Aug-2013 2011 275 Jul-2013 210 +14.1% 244 +11.9% 12-Month Avg 225 +5.7% 274 +9.9% Condo/TIC/Coop Historical Pending Sales by Month Single Family 400 Condo/TIC/Coop 300 200 100 0 1-2005 1-2006 1-2007 1-2008 1-2009 1-2010 1-2011 1-2012 1-2013 Current as of October 14, 2013. All data from the San Francisco MLS. Powered by 10K Research and Marketing. | Click for Cover Page | 5
  • 6. Sold Listings A count of the actual sales that closed in a given month. Year to Date September + 20.6% 2012 2013 2011 - 15.2% + 0.6% + 3.6% + 14.6% - 1.8% + 5.4% Single Family Condo/TIC/Coop 2012 2013 2011 2012 2013 + 4.8% + 1.1% + 11.0% + 20.0% + 3.6% Single Family -10.0% 251 +26.1% 161 +23.8% 155 -3.7% 129 -29.1% 195 +7.7% 207 -7.2% 282 +6.0% 222 +0.5% 303 +2.7% 248 +5.1% 379 +26.8% 267 -0.4% 275 -19.1% 273 +25.8% 341 +23.6% 231 -4.1% 301 -6.8% Sep-2013 2011 208 Aug-2013 2013 +29.8% Jul-2013 2012 +47.8% 270 Jun-2013 2011 275 +16.7% May-2013 1,918 +26.9% 272 Apr-2013 1,897 255 Nov-2012 Mar-2013 1,810 1,974 Year-Over-Year Change Feb-2013 180 179 Condo/TIC/ Coop Jan-2013 2,369 199 2,455 Year-Over-Year Change Oct-2012 224 Single Family Dec-2012 228 211 Sold Listings 180 +0.6% 224 -1.8% 12-Month Avg 221 +3.6% 271 +9.8% Condo/TIC/Coop Historical Sold Listings by Month Single Family 400 Condo/TIC/Coop 300 200 100 0 1-2005 1-2006 1-2007 1-2008 1-2009 1-2010 1-2011 1-2012 1-2013 Current as of October 14, 2013. All data from the San Francisco MLS. Powered by 10K Research and Marketing. | Click for Cover Page | 6
  • 7. Median Sales Price Point at which half of the sales sold for more and half sold for less, not accounting for seller concessions, in a given month. Year to Date September Year-Over-Year Change $830,000 +11.7% $760,000 +17.9% Nov-2012 $810,000 +20.0% $775,000 +26.5% Dec-2012 $836,250 +37.1% $699,000 +11.8% Jan-2013 $820,000 $829,044 $738,000 $725,000 Condo/TIC/ Coop Oct-2012 $910,000 $776,000 Year-Over-Year Change $745,000 +17.3% $765,000 +26.4% Feb-2013 $935,000 Single Family $800,500 +26.1% $750,000 +15.6% Median Sales Price $695,000 $695,000 $652,325 $629,000 $577,500 Mar-2013 2013 2011 - 8.1% + 11.1% + 29.0% - 8.0% + 34.4% + 6.8% - 7.3% Single Family Condo/TIC/Coop 2012 2013 2011 2012 2013 + 6.2% + 23.3% - 3.2% + 10.5% + 18.0% Single Family Condo/TIC/Coop Historical Median Sales Price by Month +31.6% $845,250 +19.9% $1,025,772 +31.8% $830,000 +18.6% $950,000 +21.8% $780,000 +9.5% $875,000 +13.9% $850,000 +23.2% $950,000 +24.2% $810,000 +11.7% Sep-2013 2012 $1,000,000 Aug-2013 2011 +31.1% Jul-2013 2013 $822,500 Jun-2013 2012 +29.0% May-2013 2011 $920,000 Apr-2013 $935,000 +29.0% $829,044 +6.8% 12-Month Avg* $886,000 +22.2% $801,000 +18.0% * Median Sales Price for all properties from October 2012 through September 2013. This is not the average of the individual figures above. Single Family $1,100,000 Condo/TIC/Coop $1,000,000 $900,000 $800,000 $700,000 $600,000 $500,000 1-2005 1-2006 1-2007 1-2008 1-2009 1-2010 1-2011 1-2012 1-2013 Current as of October 14, 2013. All data from the San Francisco MLS. Powered by 10K Research and Marketing. | Click for Cover Page | 7
  • 8. Average Sales Price Average sales price for all closed sales, not accounting for seller concessions, in a given month. Year to Date September Average Sales Price $936,072 $943,896 $898,376 $854,045 $733,228 $1,296,224 +31.2% $888,741 +26.8% $1,114,319 +1.6% $970,414 +23.7% $1,388,972 +68.9% $855,315 +3.6% Jan-2013 $910,606 +15.4% $836,342 +17.6% Feb-2013 $789,817 Year-Over-Year Change Dec-2012 $949,919 $940,930 Condo/TIC/ Coop Nov-2012 $1,046,074 Year-Over-Year Change Oct-2012 $1,281,335 $1,232,567 Single Family $1,166,453 +7.4% $874,966 +18.3% Mar-2013 2013 2011 - 6.8% + 9.6% + 31.7% - 9.2% + 34.9% + 5.1% - 5.8% Single Family Condo/TIC/Coop 2012 2013 2011 2012 2013 + 11.2% + 22.5% - 0.1% + 7.7% + 20.3% Single Family Condo/TIC/Coop Historical Average Sales Price by Month +28.7% $975,623 +28.3% $1,506,388 +33.7% $980,008 +21.3% $1,203,998 +3.8% $933,686 +13.3% $1,294,208 +9.6% $1,018,542 +30.7% $1,320,821 +33.5% $931,307 +15.6% Sep-2013 2012 $1,362,627 Aug-2013 2011 +29.0% Jul-2013 2013 $953,615 Jun-2013 2012 +44.4% May-2013 2011 $1,365,029 Apr-2013 $665,900 $1,232,567 +31.7% $943,896 +5.1% 12-Month Avg* $1,274,079 +24.2% $939,142 +19.4% * Average Sales Price for all properties from October 2012 through September 2013. This is not the average of the individual figures above. Single Family $1,600,000 Condo/TIC/Coop $1,400,000 $1,200,000 $1,000,000 $800,000 $600,000 1-2005 1-2006 1-2007 1-2008 1-2009 1-2010 1-2011 1-2012 1-2013 Current as of October 14, 2013. All data from the San Francisco MLS. Powered by 10K Research and Marketing. | Click for Cover Page | 8
  • 9. Days on Market Until Sale Average number of days between when a property is listed and when an offer is accepted in a given month. Year to Date September -16.7% 55 -27.6% 42 -26.3% 51 -37.8% 48 -23.8% 61 -28.2% 49 -39.5% 64 -34.0% Feb-2013 41 -34.9% 49 -47.9% Mar-2013 39 -39.1% 42 -37.3% Apr-2013 35 -35.2% 41 -41.4% May-2013 31 -34.0% 36 -36.8% Jun-2013 35 -40.7% 38 -33.3% Jul-2013 33 -29.8% 39 -33.9% Aug-2013 38 -22.4% 38 -29.6% Sep-2013 56 41 36 35 2011 2012 2013 2011 2012 2013 2011 2012 2013 2011 2012 2013 + 10.2% - 29.2% - 34.8% - 9.0% - 35.8% - 32.7% + 14.0% - 13.8% - 35.7% + 3.9% - 18.8% - 36.9% Condo/TIC/Coop 45 Dec-2012 65 46 Single Family Year-Over-Year Change Jan-2013 65 30 Condo/TIC/ Coop Nov-2012 52 Year-Over-Year Change Oct-2012 80 81 65 Single Family 30 -34.8% 35 -32.7% 12-Month Avg* 38 -31.8% 44 -34.6% Days on Market Single Family Condo/TIC/Coop Historical Days on Market Until Sale by Month * Days on Market for all properties from October 2012 through September 2013. This is not the average of the individual figures above. Single Family 120 Condo/TIC/Coop 100 80 60 40 20 1-2005 1-2006 1-2007 1-2008 1-2009 1-2010 1-2011 1-2012 1-2013 Current as of October 14, 2013. All data from the San Francisco MLS. Powered by 10K Research and Marketing. | Click for Cover Page | 9
  • 10. Inventory of Active Listings The number of properties available for sale in active status at the end of a given month. September Single Family Year-Over-Year Change Condo/TIC/ Coop Year-Over-Year Change Oct-2012 544 -34.9% 716 -31.2% Nov-2012 440 -34.2% 602 -29.9% Dec-2012 313 -36.8% 410 -35.3% Jan-2013 332 -37.8% 498 -31.0% Feb-2013 375 -33.9% 573 -26.3% Mar-2013 400 -31.7% 610 -19.9% Apr-2013 437 -24.7% 654 -12.1% May-2013 472 -14.2% 630 -16.7% Jun-2013 455 -12.7% 643 -10.9% Jul-2013 434 -14.2% 588 -12.4% Aug-2013 430 -14.3% 549 -13.0% Sep-2013 444 -25.6% 642 -14.6% 12-Month Avg* 423 -26.9% 593 -21.6% Active Listings 1,104 885 752 642 597 444 2011 2012 2013 2011 2012 2013 - 11.0% - 32.5% Single Family - 25.6% - 21.6% - 31.9% - 14.6% Condo/TIC/Coop * Active Listings for all properties from October 2012 through September 2013. This is not the average of the individual figures above. Historical Inventory of Active Listings by Month Single Family 1,600 Condo/TIC/Coop 1,400 1,200 1,000 800 600 400 200 1-2005 1-2006 1-2007 1-2008 1-2009 1-2010 1-2011 1-2012 1-2013 Current as of October 14, 2013. All data from the San Francisco MLS. Powered by 10K Research and Marketing. | Click for Cover Page | 10
  • 11. % of Properties Sold Over List Price Percentage found when dividing the number of properties sold by properties sold over its original list price, not accounting for seller concessions. September Year to Date 57.2% 53.1% Year-Over-Year Change 65.5% +51.3% 60.7% +156.1% 66.5% +38.3% 54.4% +91.5% Dec-2012 61.5% +65.3% 46.2% +95.8% Jan-2013 65.7% Condo/TIC/ Coop Nov-2012 70.1% 68.7% Year-Over-Year Change Oct-2012 76.5% Single Family 64.0% +103.2% 39.4% +62.8% Feb-2013 78.9% % of Properties Sold Over List Price 72.7% +78.6% 54.9% +71.6% Mar-2013 2012 2013 2011 2012 2013 2011 2012 2013 2011 2012 2013 - 2.8% + 64.7% + 14.8% + 24.8% + 164.2% + 32.0% - 18.7% + 49.3% + 33.7% - 1.7% + 87.3% + 53.9% Single Family Condo/TIC/Coop Single Family Condo/TIC/Coop Historical % of Properties Sold Over List Price by Month 79.7% +29.6% 67.3% +77.1% 78.2% +33.7% 67.8% +41.8% 80.1% +24.0% 72.4% +50.2% 78.8% +24.9% 73.3% +71.3% 75.3% +14.1% 66.1% +45.3% Sep-2013 2011 +52.4% Aug-2013 20.1% 63.1% Jul-2013 22.8% +61.4% Jun-2013 42.7% 38.3% 74.9% Apr-2013 May-2013 41.7% 78.9% +14.8% 70.1% +32.0% 12-Month Avg 73.3% +37.1% 62.8% +60.1% * % of Properties Sold Over List Price for all properties from October 2012 through September 2013. This is not the average of the individual figures above. Single Family 100.0% Condo/TIC/Coop 80.0% 60.0% 40.0% 20.0% 0.0% 1-2005 1-2006 1-2007 1-2008 1-2009 1-2010 1-2011 1-2012 1-2013 Current as of October 14, 2013. All data from the San Francisco MLS. Powered by 10K Research and Marketing. | Click for Cover Page | 11
  • 12. % of List Price Received Percentage found when dividing a property’s sales price by its most recent list price, then taking the average for all properties sold in a given month, not accounting for seller concessions. September Year to Date 2012 2013 2011 2012 2013 2011 2012 2013 2011 2012 2013 + 0.3% + 6.1% + 2.9% + 0.1% + 4.0% + 3.6% - 1.2% + 4.0% + 6.2% - 0.1% + 3.0% + 4.2% Single Family Single Family Condo/TIC/Coop Condo/TIC/Coop Historical % of List Price Received by Month 103.6% +5.0% +5.3% 102.5% +4.0% 104.7% +4.0% 101.6% +3.3% 106.1% +6.7% 101.2% +2.5% 108.4% +8.0% 103.8% +4.3% 109.9% +8.0% 104.9% +4.2% 111.7% +7.8% 105.7% +4.9% 111.5% +6.3% 105.9% +3.9% 112.5% +7.3% 107.1% +5.6% 109.9% +4.2% 106.8% +5.1% 110.2% +4.2% 105.5% +3.4% Sep-2013 2011 +4.4% Aug-2013 105.5% 106.4% Jul-2013 98.3% 101.2% 105.2% Jun-2013 110.3% Nov-2012 May-2013 99.9% 103.9% Oct-2012 Apr-2013 105.9% Year-Over-Year Change Mar-2013 98.3% 102.2% Condo/TIC/ Coop Feb-2013 110.0% Year-Over-Year Change Jan-2013 106.9% Single Family Dec-2012 100.8% % of List Price Received 110.0% +2.9% 105.9% +3.6% 12-Month Avg* 109.0% +5.7% 104.8% +4.1% * % of List Price Received for all properties from October 2012 through September 2013. This is not the average of the individual figures above. Single Family 115.0% Condo/TIC/Coop 110.0% 105.0% 100.0% 95.0% 1-2005 1-2006 1-2007 1-2008 1-2009 1-2010 1-2011 1-2012 1-2013 Current as of October 14, 2013. All data from the San Francisco MLS. Powered by 10K Research and Marketing. | Click for Cover Page | 12
  • 13. Housing Affordability Ratio This index measures housing affordability for the region. An index of 120 means the median household income is 120% of what is necessary to qualify for the median-priced home under prevailing interest rates. A higher number means greater affordability. Year to Date September 71 -7.8% -9.5% 70 -13.6% 66 -19.5% 78 -2.5% Jan-2013 74 -6.3% 72 -13.3% 67 -16.3% 71 -9.0% 59 -16.9% 65 -18.8% 55 -19.1% 65 -11.0% 52 -22.4% 63 -14.9% Jun-2013 52 -22.4% 63 -13.7% Jul-2013 57 -17.4% 58 -24.7% Aug-2013 52 -24.6% 60 -17.8% Sep-2013 61 55 60 53 2011 2012 2013 2011 2012 2013 2011 2012 2013 2011 2012 2013 + 16.7% - 3.9% - 28.4% + 14.7% - 18.6% - 14.3% + 14.3% + 1.4% - 24.7% + 9.7% - 2.5% - 20.8% Single Family Condo/TIC/Coop -3.0% 67 May-2013 77 70 Single Family 65 Nov-2012 Feb-2013 73 72 Oct-2012 Mar-2013 74 Condo/TIC/ Coop Apr-2013 77 Year-Over-Year Change Dec-2012 79 86 Single Family 53 -28.4% 60 -14.3% 12-Month Avg* 60 -26.6% 72 -21.5% Affordability Ratio Condo/TIC/Coop Historical Housing Affordability Ratio by Month Year-Over-Year Change * Affordability Ratio for all properties from October 2012 through September 2013. This is not the average of the individual figures above. Single Family 90 Condo/TIC/Coop 80 70 60 50 40 30 1-2005 1-2006 1-2007 1-2008 1-2009 1-2010 1-2011 1-2012 1-2013 Current as of October 14, 2013. All data from the San Francisco MLS. Powered by 10K Research and Marketing. | Click for Cover Page | 13
  • 14. Months Supply of Inventory The inventory of homes for sale at the end of a given month, divided by the average monthly pending sales from the last 12 months. September Single Family Year-Over-Year Change Condo/TIC/ Coop Year-Over-Year Change Oct-2012 2.5 -37.5% 2.8 -42.9% Nov-2012 2.0 -37.5% 2.3 -42.5% Dec-2012 1.4 -41.7% 1.6 -46.7% Jan-2013 1.5 -42.3% 1.9 -44.1% Feb-2013 1.7 -37.0% 2.2 -38.9% Mar-2013 1.9 -32.1% 2.3 -34.3% Apr-2013 2.0 -25.9% 2.5 -24.2% May-2013 2.2 -15.4% 2.3 -30.3% Jun-2013 2.1 -16.0% 2.4 -22.6% Jul-2013 2.0 -16.7% 2.2 -21.4% Aug-2013 1.9 -17.4% 2.0 -23.1% Sep-2013 2.0 -28.6% 2.3 -23.3% 12-Month Avg* 1.9 -29.9% 2.2 -33.5% Months Supply 5.2 4.3 3.0 2.8 2.3 2.0 2011 2012 2013 2011 2012 2013 - 15.7% - 34.9% Single Family - 28.6% - 25.7% - 42.3% Condo/TIC/Coop - 23.3% * Months Supply for all properties from October 2012 through September 2013. This is not the average of the individual figures above. Historical Months Supply of Inventory by Month Single Family 10.0 Condo/TIC/Coop 8.0 6.0 4.0 2.0 0.0 1-2005 1-2006 1-2007 1-2008 1-2009 1-2010 1-2011 1-2012 1-2013 Current as of October 14, 2013. All data from the San Francisco MLS. Powered by 10K Research and Marketing. | Click for Cover Page | 14
  • 15. All Properties Activity Overview Key metrics by report month and for year-to-date (YTD) starting from the first of the year. Key Metrics Historical Sparkbars 9-2012 9-2011 9-2012 5,607 + 4.6% 454 + 12.9% 4,344 4,532 + 4.3% 404 - 0.7% 4,266 4,373 + 2.5% $860,000 + 14.7% $714,000 $850,000 + 19.0% YTD 2012 YTD 2013 Percent Change 9-2013 9-2010 5,361 $750,000 9-2012 - 1.3% 407 9-2011 695 402 9-2010 Percent Change 704 New Listings 9-2013 9-2013 Pending Sales Sold Listings 9-2010 9-2011 9-2012 9-2013 Median Sales Price 9-2010 9-2011 9-2012 9-2013 9-2010 9-2011 9-2012 9-2013 Average Sales Price $914,955 $1,072,512 + 17.2% Days on Market $903,735 $1,095,236 + 21.2% 49 39 - 36.1% 1,086 - 19.5% -- -- -- 74.0% + 23.3% 49.1% 70.4% + 43.4% 104.3% 107.7% + 3.3% 102.4% 107.6% + 5.1% 60 47 - 21.4% 60 46 - 23.9% 2.9 9-2012 61 60.0% 9-2011 - 34.7% 1,349 9-2010 32 2.2 - 24.1% -- -- -- 9-2013 Active Listings 9-2010 9-2011 9-2012 9-2013 9-2010 9-2011 9-2012 9-2013 % of Properties Sold Over List Price % of List Price Received 9-2010 9-2011 9-2012 9-2013 Affordability Ratio 9-2010 9-2011 9-2012 9-2013 9-2010 9-2011 9-2012 9-2013 Months Supply Current as of October 14, 2013. All data from the San Francisco MLS. Powered by 10K Research and Marketing. | Click for Cover Page | 15
  • 16. Activity by District Key metrics by report month for the districts of San Fransisco. SF District 1: Northwest (Sea Cliff, Lake, Jordan Park / Laurel Heights, Outer Richmond, Central Richmond, Inner Richmond, Lone Mountain) SF District 2: Central West (Outer Sunset, Central Sunset, Inner Sunset, Outer Parkside, Parkside, Inner Parkside, Golden Gate Heights) SF District 3: Southwest (Pine Lake Park, Lake Shore, Merced Manor, Stonestown, Lakeside, Merced Heights, Ingleside, Ingleside Heights, Oceanview) SF District 4: Twin Peaks W (Forest Hill (& Ext), W Portal, St Francis Wd, Balboa Terr, Mt Dav Manor, Ingleside Terr, Monterey Hts, Wstwd Pk & H'lnds, Shrwd Fst, Miraloma Pk, Dmnd Hts, Mdtwn Terr) SF District 5: Central (Haight Ashbury, Cole Vly / Prnssus Hts, Clarndn Hts, Corona Hts, Twin Pks, Glen Pk, Noe Vly, Eureka Vly / Dolores Hts, Mission Dolores, Duboce Trngl, Buena Vista / Ashbury Hts) SF District 6: Central North (Lower Pacific Heights, Anza Vista, Western Addition, North Panhandle, Alamo Square, Hayes Valley) SF District 7: North (Marina, Cow Hollow, Presidio Heights, Pacific Heights) SF District 8: Northeast (North Waterfront, North Beach, Russian Hill, Telegraph Hill, Nob Hill, Financial District / Barbary Coast, Downtown, Van Ness / Civic Center, Tenderloin) SF District 9: Central East (Yerba Buena, South Beach, South of Market, Mission Bay, Inner Mission, Potrero Hill, Central Waterfront / Dogpatch, Bernal Heights) SF District 10: Southeast (Outer Mission, Mission Terr, Excelsior, Portola, Bayview, Silver Terr, Hunters Pt, Candlestick Pt, Bayview Hts, Little Hollywood, Visitation Vly, Crocker Amazon) Active Listings Sold Listings 9-2012 9-2013 +/– 9-2012 9-2013 Median Sales Price +/– 9-2012 Days on Market 9-2013 +/– 9-2012 9-2013 Months Supply +/– 9-2012 9-2013 +/– Single Family 1 SF District 1 46 38 -17.4% 11 13 +18.2% $1,165,000 $908,000 -22.1% 45 36 -20.2% 2.6 2.0 -22.2% 2 SF District 2 82 86 +4.9% 24 40 +66.7% $832,750 $860,250 +3.3% 35 30 -13.1% 2.5 2.2 -12.5% 3 SF District 3 39 34 -12.8% 20 12 -40.0% $585,000 $767,500 +31.2% 31 22 -28.7% 2.4 2.3 -5.1% 4 SF District 4 79 55 -30.4% 26 22 -15.4% $865,000 $1,300,000 +50.3% 31 31 -1.0% 3.0 1.9 -35.0% 5 SF District 5 79 50 -36.7% 59 23 -61.0% $1,390,000 $1,545,000 +11.2% 26 31 +19.4% 2.5 1.5 -39.1% 6 SF District 6 21 9 -57.1% 27 4 -85.2% $1,827,500 $1,190,000 -34.9% 52 39 -25.5% 6.5 2.2 -66.7% 7 SF District 7 49 29 -40.8% 19 7 -63.2% $2,550,000 $5,250,000 +105.9% 35 16 -55.1% 5.1 2.5 -51.0% 8 SF District 8 13 9 -30.8% 40 0 -100.0% $1,765,000 $0 -100.0% 83 0 -100.0% 5.7 3.7 -34.9% 9 SF District 9 41 37 -9.8% 104 23 -77.9% $829,000 $1,050,000 +26.7% 43 24 -45.1% 2.1 1.6 -23.4% 148 97 -34.5% 67 36 -46.3% $483,500 $660,000 +36.5% 66 33 -49.8% 2.8 1.9 -29.6% +6.5% 82 22 -72.9% 2.9 2.1 -26.2% 10 SF District 10 Condo/TIC/Coop 1 SF District 1 40 29 -27.5% 10 12 +20.0% $697,000 $742,500 2 SF District 2 19 22 +15.8% 4 6 +50.0% $774,000 $850,000 +9.8% 83 33 -59.7% 4.3 4.9 +13.6% 3 SF District 3 4 7 +75.0% 4 1 -75.0% $325,000 $785,000 +141.5% 96 20 -79.2% 1.1 2.8 +152.1% 4 SF District 4 19 11 -42.1% 1 1 0.0% $299,000 $475,000 +58.9% 85 29 -65.9% 4.5 2.2 -50.8% 5 SF District 5 114 71 -37.7% 35 40 +14.3% $959,000 $1,127,500 +17.6% 41 30 -27.8% 3.2 1.7 -48.7% 6 SF District 6 54 77 +42.6% 25 26 +4.0% $803,000 $814,500 +1.4% 57 35 -38.7% 2.1 2.7 +26.4% 7 SF District 7 89 66 -25.8% 16 20 +25.0% $1,347,500 $1,300,500 -3.5% 26 38 +43.5% 3.4 2.0 -40.3% 8 SF District 8 140 137 -2.1% 37 28 -24.3% $605,000 $792,500 +31.0% 56 34 -39.4% 2.9 3.1 +6.6% 9 SF District 9 243 203 -16.5% 89 85 -4.5% $750,000 $750,000 0.0% 48 37 -23.5% 3.0 2.2 -28.0% 30 19 -36.7% 7 5 -28.6% $350,000 $420,000 +20.0% 80 58 -27.5% 4.3 3.1 -29.0% 10 SF District 10 Current as of October 14, 2013. All data from the San Francisco MLS. Powered by 10K Research and Marketing. | Click for Cover Page | 16