1. For All Media/Public Inquiries: For All TREB Member Inquiries:
(416) 443-8158 (416) 443-8152 Third Quarter 2012
Economic Indicators Almost 3.5 Million Square Feet Leased in Q3 2012 TorontoMLS
Real GDP Growth
1
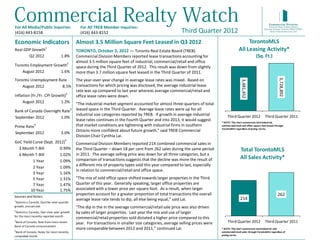
TORONTO, October 3, 2012 — Toronto Real Estate Board (TREB) All Leasing Activity*
Q2 2012 t 1.8% Commercial Division Members reported lease transactions accounting for (Sq. Ft.)
almost 3.5 million square feet of industrial, commercial/retail and office
Toronto Employment Growth2 space during the Third Quarter of 2012. This result was down from slightly
August 2012 t 1.6% more than 3.7 million square feet leased in the Third Quarter of 2011.
3,728,892
Toronto Unemployment Rate The year-over-year change in average lease rates was mixed. Based on
3,481,452
August 2012 u 8.5% transactions for which pricing was disclosed, the average industrial lease
rate was up compared to last year whereas average commercial/retail and
Inflation (Yr./Yr. CPI Growth)2 office lease rates were down.
August 2012 u 1.2% “The industrial market segment accounted for almost three-quarters of total
Bank of Canada Overnight Rate 3 leased space in the Third Quarter. Average lease rates were up for all
industrial size categories reported by TREB. If growth in average industrial
September 2012 q 1.0% Third Quarter 2012 Third Quarter 2011
lease rates continues in the Fourth Quarter and into 2013, it would suggest
* NOTE: This chart summarizes total industrial,
Prime Rate
4 that market conditions are tightening with industrial firms in southern commercial/retail and office square feet leased through
TorontoMLS regardless of pricing terms.
Ontario more confident about future growth,” said TREB Commercial
September 2012 q 3.0%
Division Chair Cynthia Lai.
GoC Yield Curve (Sept. 2012)4 Commercial Division Members reported 214 combined commercial sales in
3 Month T-Bill t 0.99% the Third Quarter – down 18 per cent from 262 sales during the same period Total TorontoMLS
6 Month T-Bill u 1.02% in 2011. The average selling price was down for all three categories, but a
comparison of transactions suggests that the decline was more the result of All Sales Activity*
1 Year u 1.09%
a different mix of property types sold this year compared to last, especially
2 Year u 1.09%
in relation to commercial/retail and office space.
3 Year u 1.16%
5 Year u 1.31% “The mix of sold office space shifted towards larger properties in the Third
7 Year u 1.47% Quarter of this year. Generally speaking, larger office properties are
10 Year u 1.75% associated with a lower price per square foot. As a result, when larger
properties account for a greater proportion of total transactions the overall 262
Sources and Notes:
1
average lease rate tends to dip, all else being equal,” said Lai. 214
Statistics Canada, Quarter-over-quarter
growth, annualized. “The dip in the in the average commercial/retail sale price was also driven
2
Statistics Canada, Year-over-year growth by sales of larger properties. Last year the mix and use of larger
for the most recently reported month
commercial/retail properties sold dictated a higher price compared to this
3
Bank of Canada, Rate from most recent year. For transactions in smaller size categories, average selling prices were Third Quarter 2012 Third Quarter 2011
Bank of Canada announcement
4
more comparable between 2012 and 2011,” continued Lai. * NOTE: This chart summarizes total industrial and
Bank of Canada, Rates for most recently commercial/retail sales through TorontoMLS regardless of
completed month pricing terms.
2. TREB Commercial Division
Total TorontoMLS Leasing Activity* TorontoMLS Average Lease Rates ($/Sq.Ft. Net)*
(Millions of Square Feet Leased) Third Quarter 2012 Third Quarter 2011
$25.00
4.0 3.73 $20.37
3.48
$20.00
Millions of Square Feet
3.0 2.76
2.56 Third Quarter 2012 $14.36
$15.00
Third Quarter 2011 $10.79 $10.95
2.0
$10.00
$5.05 $4.74
1.0 0.45 0.49 0.47 0.48 $5.00
0.0 $0.00
Total Industrial Commercial/Retail Office Industrial Commercial/Retail Office
* NOTE: This chart summarizes total industrial, commercial/retail and office square * NOTE: Average lease rates are reported only for those properties sold on a per
feet leased through TorontoMLS regardless of pricing terms. square foot net basis and for which the selling price was disclosed.
Source: TREB, Commercial Division Source: TREB, Commercial Division
Total TorontoMLS Sales Activity* TorontoMLS Average Sale Price ($/Sq. Ft.)*
(Number of Sales)
$250.00 $229.64
300 262 Third Quarter 2012 Third Quarter 2012
$189.70
$200.00
250 214 Third Quarter 2011 Third Quarter 2011
$146.05
200 $150.00
$116.11
150 124
101 94
$100.00 $70.18 $78.29
100 74
39 44 $50.00
50
0 $0.00
Total Industrial Commercial/Retail Office Industrial Commercial/Retail Office
* NOTE: This chart summarizes total industrial and commercial/retail sales through * NOTE: Average sale prices are reported only for those properties for which the
TorontoMLS regardless of pricing terms. selling price was disclosed.
Source: TREB, Commercial Division Source: TREB, Commercial Division
Commercial Realty Watch, Third Quarter 2012 2
3. TREB Commercial Division
SUMMARY OF INDUSTRIAL LEASING
ALL TREB AREAS
TRANSACTIONS COMPLETED ON A PER SQUARE FOOT NET BASIS, WITH PRICING DISCLOSED*
All Transactions 0 to 5,000 Square Feet 5,001 to 15,000 Square Feet 15,001 to 50,000 Square Feet 50,001 + Square Feet
# Trans. Sq. Ft. $/SF Net # Trans. Sq. Ft. $/SF Net # Trans. Sq. Ft. $/SF Net # Trans. Sq. Ft. $/SF Net # Trans. Sq. Ft. $/SF Net
TREB Total 173 1,339,922 $5.05 118 287,275 $6.16 35 283,240 $5.51 13 379,716 $4.56 7 389,691 $4.36
Halton Region 8 35,236 $5.57 6 15,183 $7.31 2 20,053 $4.26 0 - - 0 - -
Burlington 2 7,461 $7.34 2 7,461 $7.34 0 - - 0 - - 0 - -
Halton Hills 0 - - 0 - - 0 - - 0 - - 0 - -
Milton 0 - - 0 - - 0 - - 0 - - 0 - -
Oakville 6 27,775 $5.10 4 7,722 $7.28 2 20,053 $4.26 0 - - 0 - -
Peel Region 73 499,298 $5.15 52 135,755 $5.71 13 117,505 $5.56 6 137,698 $4.94 2 108,340 $4.27
Brampton 13 120,621 $4.94 10 19,035 $6.25 0 - - 2 48,465 $4.86 1 53,121 $4.55
Caledon 2 14,561 $5.01 1 1,680 $5.50 1 12,881 $4.95 0 - - 0 - -
Mississauga 58 364,116 $5.22 41 115,040 $5.62 12 104,624 $5.63 4 89,233 $4.99 1 55,219 $4.00
City of Toronto 45 393,123 $4.28 32 76,636 $5.53 7 50,828 $4.68 3 84,923 $4.42 3 180,736 $3.58
West 25 237,349 $4.35 16 40,191 $5.92 5 35,479 $4.88 2 56,829 $4.25 2 104,850 $3.63
Central 4 38,281 $4.92 3 10,187 $5.37 0 - - 1 28,094 $4.75 0 - -
East 16 117,493 $3.93 13 26,258 $4.99 2 15,349 $4.22 0 - - 1 75,886 $3.50
York Region 45 406,865 $5.62 26 54,301 $7.99 13 94,854 $6.17 4 157,095 $4.31 2 100,615 $5.87
Aurora 2 2,960 $6.12 2 2,960 $6.12 0 - - 0 - - 0 - -
E. Gwillimbury 0 - - 0 - - 0 - - 0 - - 0 - -
Georgina 0 - - 0 - - 0 - - 0 - - 0 - -
King 0 - - 0 - - 0 - - 0 - - 0 - -
Markham 15 149,484 $5.61 8 14,980 $9.28 5 34,489 $6.86 1 50,000 $3.00 1 50,015 $6.25
Newmarket 0 - - 0 - - 0 - - 0 - - 0 - -
Richmond Hill 1 3,095 $7.70 1 3,095 $7.70 0 - - 0 - - 0 - -
Vaughan 26 249,626 $5.58 14 31,566 $7.56 8 60,365 $5.77 3 107,095 $4.92 1 50,600 $5.50
Whitchurch-Stouffville 1 1,700 $8.25 1 1,700 $8.25 0 - - 0 - - 0 - -
Durham Region 0 - - 0 - - 0 - - 0 - - 0 - -
Ajax 0 - - 0 - - 0 - - 0 - - 0 - -
Brock 0 - - 0 - - 0 - - 0 - - 0 - -
Clarington 0 - - 0 - - 0 - - 0 - - 0 - -
Oshawa 0 - - 0 - - 0 - - 0 - - 0 - -
Pickering 0 - - 0 - - 0 - - 0 - - 0 - -
Scugog 0 - - 0 - - 0 - - 0 - - 0 - -
Uxbridge 0 - - 0 - - 0 - - 0 - - 0 - -
Whitby 0 - - 0 - - 0 - - 0 - - 0 - -
Dufferin County 2 5,400 $4.93 2 5,400 $4.93 0 - - 0 - - 0 - -
Orangeville 2 5,400 $4.93 2 5,400 $4.93 0 - - 0 - - 0 - -
Simcoe County 0 - - 0 - - 0 - - 0 - - 0 - -
Adjala-Tosorontio 0 - - 0 - - 0 - - 0 - - 0 - -
Bradford West Gwillimbury 0 - - 0 - - 0 - - 0 - - 0 - -
Essa 0 - - 0 - - 0 - - 0 - - 0 - -
Innisfil 0 - - 0 - - 0 - - 0 - - 0 - -
New Tecumseth 0 - - 0 - - 0 - - 0 - - 0 - -
*
NOTE: Figures in this table cover transactions completed on a per square foot net basis and for which pricing was disclosed during the reporting period. This differs from the chart summarizing square feet
leased on Page 2 of this report, which covers all leasing transactions in the TREB service area.
Commercial Realty Watch, Third Quarter 2012 3
4. TREB Commercial Division
SUMMARY OF INDUSTRIAL LEASING
CITY OF TORONTO
TRANSACTIONS COMPLETED ON A PER SQUARE FOOT NET BASIS, WITH PRICING DISCLOSED
All Transactions 0 to 5,000 Square Feet 5,001 to 15,000 Square Feet 15,001 to 50,000 Square Feet 50,001 + Square Feet
# Trans. Sq. Ft. $/SF Net # Trans. Sq. Ft. $/SF Net # Trans. Sq. Ft. $/SF Net # Trans. Sq. Ft. $/SF Net # Trans. Sq. Ft. $/SF Net
TREB Total 173 1,339,922 $5.05 118 287,275 $6.16 35 283,240 $5.51 13 379,716 $4.56 7 389,691 $4.36
City of Toronto 45 393,123 $4.28 32 76,636 $5.53 7 50,828 $4.68 3 84,923 $4.42 3 180,736 $3.58
Toronto West 25 237,349 $4.35 16 40,191 $5.92 5 35,479 $4.88 2 56,829 $4.25 2 104,850 $3.63
Toronto W01 0 - - 0 - - 0 - - 0 - - 0 - -
Toronto W02 0 - - 0 - - 0 - - 0 - - 0 - -
Toronto W03 0 - - 0 - - 0 - - 0 - - 0 - -
Toronto W04 1 5,375 $8.00 0 - - 1 5,375 $8.00 0 - - 0 - -
Toronto W05 12 111,616 $4.34 8 19,231 $5.66 2 19,182 $4.25 1 22,553 $3.50 1 50,650 $4.25
Toronto W06 0 - - 0 - - 0 - - 0 - - 0 - -
Toronto W07 0 - - 0 - - 0 - - 0 - - 0 - -
Toronto W08 2 8,703 $4.33 1 2,901 $4.50 1 5,802 $4.25 0 - - 0 - -
Toronto W09 0 - - 0 - - 0 - - 0 - - 0 - -
Toronto W10 10 111,655 $4.19 7 18,059 $6.42 1 5,120 $4.70 1 34,276 $4.75 1 54,200 $3.05
Toronto Central 4 38,281 $4.92 3 10,187 $5.37 0 - - 1 28,094 $4.75 0 - -
Toronto C01 0 - - 0 - - 0 - - 0 - - 0 - -
Toronto C02 0 - - 0 - - 0 - - 0 - - 0 - -
Toronto C03 0 - - 0 - - 0 - - 0 - - 0 - -
Toronto C04 0 - - 0 - - 0 - - 0 - - 0 - -
Toronto C06 0 - - 0 - - 0 - - 0 - - 0 - -
Toronto C07 0 - - 0 - - 0 - - 0 - - 0 - -
Toronto C08 0 - - 0 - - 0 - - 0 - - 0 - -
Toronto C09 0 - - 0 - - 0 - - 0 - - 0 - -
Toronto C10 0 - - 0 - - 0 - - 0 - - 0 - -
Toronto C11 1 28,094 $4.75 0 - - 0 - - 1 28,094 $4.75 0 - -
Toronto C12 0 - - 0 - - 0 - - 0 - - 0 - -
Toronto C13 2 7,780 $5.41 2 7,780 $5.41 0 - - 0 - - 0 - -
Toronto C14 0 - - 0 - - 0 - - 0 - - 0 - -
Toronto C15 1 2,407 $5.25 1 2,407 $5.25 0 - - 0 - - 0 - -
Toronto East 16 117,493 $3.93 13 26,258 $4.99 2 15,349 $4.22 0 - - 1 75,886 $3.50
Toronto E01 0 - - 0 - - 0 - - 0 - - 0 - -
Toronto E02 0 - - 0 - - 0 - - 0 - - 0 - -
Toronto E03 0 - - 0 - - 0 - - 0 - - 0 - -
Toronto E04 3 7,540 $4.75 3 7,540 $4.75 0 - - 0 - - 0 - -
Toronto E05 0 - - 0 - - 0 - - 0 - - 0 - -
Toronto E06 0 - - 0 - - 0 - - 0 - - 0 - -
Toronto E07 6 96,378 $3.71 3 5,143 $5.35 2 15,349 $4.22 0 - - 1 75,886 $3.50
Toronto E08 0 - - 0 - - 0 - - 0 - - 0 - -
Toronto E09 3 7,541 $4.60 3 7,541 $4.60 0 - - 0 - - 0 - -
Toronto E10 0 - - 0 - - 0 - - 0 - - 0 - -
Toronto E11 4 6,034 $5.47 4 6,034 $5.47 0 - - 0 - - 0 - -
*
NOTE: Figures in this table cover transactions completed on a per square foot net basis and for which pricing was disclosed during the reporting period. This differs from the chart summarizing square feet
leased on Page 2 of this report, which covers all leasing transactions in the TREB service area.
Commercial Realty Watch, Third Quarter 2012 4
5. TREB Commercial Division
SUMMARY OF COMMERCIAL/RETAIL LEASING
ALL TREB AREAS
TRANSACTIONS COMPLETED ON A PER SQUARE FOOT NET BASIS, WITH PRICING DISCLOSED
All Transactions 0 to 1,000 Square Feet 1,001 TO 2,500 Square Feet 2,501 TO 5,000 Square Feet 5,001+ Square Feet
# Trans. Sq. Ft. $/SF Net # Trans. Sq. Ft. $/SF Net # Trans. Sq. Ft. $/SF Net # Trans. Sq. Ft. $/SF Net # Trans. Sq. Ft. $/SF Net
TREB Total 108 235,105 $14.36 37 28,709 $25.13 55 86,738 $17.01 11 41,651 $14.34 5 78,007 $7.69
Halton Region 8 6,678 $22.53 7 5,607 $22.55 1 1,071 $22.41 0 - - 0 - -
Burlington 0 - - 0 - - 0 - - 0 - - 0 - -
Halton Hills 3 2,651 $16.75 2 1,580 $12.91 1 1,071 $22.41 0 - - 0 - -
Milton 0 - - 0 - - 0 - - 0 - - 0 - -
Oakville 5 4,027 $26.33 5 4,027 $26.33 0 - - 0 - - 0 - -
Peel Region 13 22,392 $17.35 4 3,162 $24.48 7 11,451 $13.77 2 7,779 $19.72 0 - -
Brampton 9 16,216 $18.76 2 1,472 $27.46 5 6,965 $15.84 2 7,779 $19.72 0 - -
Caledon 0 - - 0 - - 0 - - 0 - - 0 - -
Mississauga 4 6,176 $13.66 2 1,690 $21.89 2 4,486 $10.56 0 - - 0 - -
City of Toronto 47 120,096 $15.14 15 12,325 $29.01 23 34,885 $20.47 6 23,718 $16.06 3 49,168 $7.44
West 12 48,704 $8.60 5 4,488 $25.76 6 9,590 $16.27 0 - - 1 34,626 $4.25
Central 19 34,304 $25.86 5 3,717 $41.62 11 16,165 $23.29 2 8,458 $25.86 1 5,964 $23.00
East 16 37,088 $13.82 5 4,120 $21.18 6 9,130 $19.90 4 15,260 $10.62 1 8,578 $9.50
York Region 27 63,280 $11.74 7 4,846 $23.57 17 27,066 $13.97 1 2,529 $6.50 2 28,839 $8.12
Aurora 1 1,497 $22.00 0 - - 1 1,497 $22.00 0 - - 0 - -
E. Gwillimbury 0 - - 0 - - 0 - - 0 - - 0 - -
Georgina 2 2,422 $13.13 0 - - 2 2,422 $13.13 0 - - 0 - -
King 0 - - 0 - - 0 - - 0 - - 0 - -
Markham 9 13,088 $14.23 4 2,670 $28.67 4 7,889 $11.83 1 2,529 $6.50 0 - -
Newmarket 0 - - 0 - - 0 - - 0 - - 0 - -
Richmond Hill 1 568 $22.00 1 568 $22.00 0 - - 0 - - 0 - -
Vaughan 13 45,055 $10.48 1 958 $18.79 10 15,258 $14.43 0 - - 2 28,839 $8.12
Whitchurch-Stouffville 1 650 $11.08 1 650 $11.08 0 - - 0 - - 0 - -
Durham Region 10 19,793 $12.67 3 2,165 $16.76 5 10,003 $16.77 2 7,625 $6.13 0 - -
Ajax 2 3,315 $8.66 1 955 $14.00 1 2,360 $6.50 0 - - 0 - -
Brock 0 - - 0 - - 0 - - 0 - - 0 - -
Clarington 1 2,370 $11.00 0 - - 1 2,370 $11.00 0 - - 0 - -
Oshawa 1 1,773 $21.32 0 - - 1 1,773 $21.32 0 - - 0 - -
Pickering 0 - - 0 - - 0 - - 0 - - 0 - -
Scugog 2 4,035 $9.04 1 810 $17.19 0 - - 1 3,225 $7.00 0 - -
Uxbridge 0 - - 0 - - 0 - - 0 - - 0 - -
Whitby 4 8,300 $14.66 1 400 $22.50 2 3,500 $25.29 1 4,400 $5.50 0 - -
Dufferin County 1 1,200 $0.00 0 - - 1 1,200 $16.00 0 - - 0 - -
Orangeville 1 1,200 $0.00 0 - - 1 1,200 $16.00 0 - - 0 - -
Simcoe County 2 1,666 $14.41 1 604 $15.89 1 1,062 $13.56 0 - - 0 - -
Adjala-Tosorontio 0 - - 0 - - 0 - - 0 - - 0 - -
Bradford West Gwillimbury 0 - - 0 - - 0 - - 0 - - 0 - -
Essa 0 - - 0 - - 0 - - 0 - - 0 - -
Innisfil 0 - - 0 - - 0 - - 0 - - 0 - -
New Tecumseth 2 1,666 $14.41 1 604 $15.89 1 1,062 $13.56 0 - - 0 - -
*
NOTE: Figures in this table cover transactions completed on a per square foot net basis and for which pricing was disclosed during the reporting period. This differs from the chart summarizing square feet
leased on Page 2 of this report, which covers all leasing transactions in the TREB service area.
Commercial Realty Watch, Third Quarter 2012 5
6. TREB Commercial Division
SUMMARY OF COMMERCIAL LEASING
CITY OF TORONTO
TRANSACTIONS COMPLETED ON A PER SQUARE FOOT NET BASIS, WITH PRICING DISCLOSED
All Transactions 0 to 1,000 Square Feet 1,001 TO 2,500 Square Feet 2,501 TO 5,000 Square Feet 5,001+ Square Feet
# Trans. Sq. Ft. $/SF Net # Trans. Sq. Ft. $/SF Net # Trans. Sq. Ft. $/SF Net # Trans. Sq. Ft. $/SF Net # Trans. Sq. Ft. $/SF Net
TREB Total 108 235,105 $14.36 37 28,709 $25.13 55 86,738 $17.01 11 41,651 $14.34 5 78,007 $7.69
City of Toronto 47 120,096 $15.14 15 12,325 $29.01 23 34,885 $20.47 6 23,718 $16.06 3 49,168 $7.44
Toronto West 12 48,704 $8.60 5 4,488 $25.76 6 9,590 $16.27 0 - - 1 34,626 $4.25
Toronto W01 0 - - 0 - - 0 - - 0 - - 0 - -
Toronto W02 3 4,027 $16.84 1 987 $23.71 2 3,040 $14.61 0 - - 0 - -
Toronto W03 1 1,000 $19.20 1 1,000 $19.20 0 - - 0 - - 0 - -
Toronto W04 1 34,626 $4.25 0 - - 0 - - 0 - - 1 34,626 $4.25
Toronto W05 2 1,910 $16.02 1 850 $14.12 1 1,060 $17.55 0 - - 0 - -
Toronto W06 1 1,400 $20.57 0 - - 1 1,400 $20.57 0 - - 0 - -
Toronto W07 1 755 $55.63 1 755 $55.63 0 - - 0 - - 0 - -
Toronto W08 2 2,496 $22.36 1 896 $21.21 1 1,600 $23.00 0 - - 0 - -
Toronto W09 1 2,490 $11.00 0 - - 1 2,490 $11.00 0 - - 0 - -
Toronto W10 0 - - 0 - - 0 - - 0 - - 0 - -
Toronto Central 19 34,304 $25.86 5 3,717 $41.62 11 16,165 $23.29 2 8,458 $25.86 1 5,964 $23.00
Toronto C01 6 13,068 $29.64 1 450 $45.47 3 4,160 $35.63 2 8,458 $25.86 0 - -
Toronto C02 4 9,098 $26.73 1 875 $35.66 2 2,259 $33.13 0 - - 1 5,964 $23.00
Toronto C03 4 7,189 $13.53 0 - - 4 7,189 $13.53 0 - - 0 - -
Toronto C04 1 1,000 $48.00 1 1,000 $48.00 0 - - 0 - - 0 - -
Toronto C06 1 1,357 $15.48 0 - - 1 1,357 $15.48 0 - - 0 - -
Toronto C07 1 1,200 $29.37 0 - - 1 1,200 $29.37 0 - - 0 - -
Toronto C08 0 - - 0 - - 0 - - 0 - - 0 - -
Toronto C09 0 - - 0 - - 0 - - 0 - - 0 - -
Toronto C10 0 - - 0 - - 0 - - 0 - - 0 - -
Toronto C11 1 955 $30.00 1 955 $30.00 0 - - 0 - - 0 - -
Toronto C12 0 - - 0 - - 0 - - 0 - - 0 - -
Toronto C13 0 - - 0 - - 0 - - 0 - - 0 - -
Toronto C14 1 437 $60.41 1 437 $60.41 0 - - 0 - - 0 - -
Toronto C15 0 - - 0 - - 0 - - 0 - - 0 - -
Toronto East 16 37,088 $13.82 5 4,120 $21.18 6 9,130 $19.90 4 15,260 $10.62 1 8,578 $9.50
Toronto E01 1 1,300 $30.00 0 - - 1 1,300 $30.00 0 - - 0 - -
Toronto E02 4 5,330 $28.79 2 1,200 $38.38 2 4,130 $26.00 0 - - 0 - -
Toronto E03 2 4,370 $15.19 1 1,000 $22.20 0 - - 1 3,370 $13.11 0 - -
Toronto E04 4 18,142 $9.64 1 986 $12.00 0 - - 2 8,578 $9.50 1 8,578 $9.50
Toronto E05 0 - - 0 - - 0 - - 0 - - 0 - -
Toronto E06 0 - - 0 - - 0 - - 0 - - 0 - -
Toronto E07 1 934 $7.71 1 934 $7.71 0 - - 0 - - 0 - -
Toronto E08 0 - - 0 - - 0 - - 0 - - 0 - -
Toronto E09 2 2,420 $9.30 0 - - 2 2,420 $9.30 0 - - 0 - -
Toronto E10 1 1,280 $10.00 0 - - 1 1,280 $10.00 0 - - 0 - -
Toronto E11 1 3,312 $11.00 0 - - 0 - - 1 3,312 $11.00 0 - -
*
NOTE: Figures in this table cover transactions completed on a per square foot net basis and for which pricing was disclosed during the reporting period. This differs from the chart summarizing square feet
leased on Page 2 of this report, which covers all leasing transactions in the TREB service area.
Commercial Realty Watch, Third Quarter 2012 6
7. TREB Commercial Division
SUMMARY OF OFFICE LEASING
ALL TREB AREAS
TRANSACTIONS COMPLETED ON A PER SQUARE FOOT NET BASIS, WITH PRICING DISCLOSED
All Transactions 0 to 1,000 Square Feet 1,001 TO 2,500 Square Feet 2,501 TO 5,000 Square Feet 5,001+ Square Feet
# Trans. Sq. Ft. $/SF Net # Trans. Sq. Ft. $/SF Net # Trans. Sq. Ft. $/SF Net # Trans. Sq. Ft. $/SF Net # Trans. Sq. Ft. $/SF Net
TREB Total 109 300,511 $10.79 51 32,748 $14.52 33 53,242 $12.05 16 54,155 $10.83 9 160,366 $9.59
Halton Region 11 16,878 $13.83 4 1,312 $13.41 4 5,840 $11.90 3 9,726 $15.05 0 - -
Burlington 2 5,481 $11.99 0 - - 0 - - 2 5,481 $11.99 0 - -
Halton Hills 5 3,712 $11.85 4 1,312 $13.41 1 2,400 $11.00 0 - - 0 - -
Milton 1 1,168 $12.00 0 - - 1 1,168 $12.00 0 - - 0 - -
Oakville 3 6,517 $16.83 0 - - 2 2,272 $12.79 1 4,245 $19.00 0 - -
Peel Region 24 37,950 $9.38 10 6,330 $9.99 10 18,246 $10.36 4 13,374 $7.75 0 - -
Brampton 4 2,998 $8.80 3 1,731 $8.66 1 1,267 $9.00 0 - - 0 - -
Caledon 0 - - 0 - - 0 - - 0 - - 0 - -
Mississauga 20 34,952 $9.43 7 4,599 $10.50 9 16,979 $10.46 4 13,374 $7.75 0 - -
City of Toronto 37 148,406 $10.91 24 14,834 $18.12 6 9,214 $18.52 4 14,307 $13.38 3 110,051 $8.97
West 15 115,022 $9.11 10 6,981 $12.97 1 1,373 $11.36 2 5,877 $17.39 2 100,791 $8.33
Central 16 29,582 $16.85 9 5,251 $24.51 4 6,641 $19.92 2 8,430 $10.59 1 9,260 $16.00
East 6 3,802 $19.02 5 2,602 $19.03 1 1,200 $19.00 0 - - 0 - -
York Region 35 91,866 $10.94 13 10,272 $12.26 12 18,693 $10.70 4 12,586 $10.30 6 50,315 $10.93
Aurora 2 4,060 $11.29 0 - - 2 4,060 $11.29 0 - - 0 - -
E. Gwillimbury 0 - - 0 - - 0 - - 0 - - 0 - -
Georgina 0 - - 0 - - 0 - - 0 - - 0 - -
King 0 - - 0 - - 0 - - 0 - - 0 - -
Markham 13 40,005 $9.36 4 3,065 $10.71 3 4,310 $9.41 3 9,505 $10.80 3 23,125 $8.58
Newmarket 1 8,591 $10.00 0 - - 0 - - 0 - - 1 8,591 $10.00
Richmond Hill 10 11,610 $10.50 5 4,109 $10.78 5 7,501 $10.34 0 - - 0 - -
Vaughan 9 27,600 $13.67 4 3,098 $15.75 2 2,822 $12.76 1 3,081 $8.75 2 18,599 $14.28
Whitchurch-Stouffville 0 - - 0 - - 0 - - 0 - - 0 - -
Durham Region 2 5,411 $5.19 0 - - 1 1,249 $10.00 1 4,162 $3.75 0 - -
Ajax 1 1,249 $10.00 0 - - 1 1,249 $10.00 0 - - 0 - -
Brock 0 - - 0 - - 0 - - 0 - - 0 - -
Clarington 0 - - 0 - - 0 - - 0 - - 0 - -
Oshawa 0 - - 0 - - 0 - - 0 - - 0 - -
Pickering 1 4,162 $3.75 0 - - 0 - - 1 4,162 $3.75 0 - -
Scugog 0 - - 0 - - 0 - - 0 - - 0 - -
Uxbridge 0 - - 0 - - 0 - - 0 - - 0 - -
Whitby 0 - - 0 - - 0 - - 0 - - 0 - -
Dufferin County 0 - - 0 - - 0 - - 0 - - 0 - -
Orangeville 0 - - 0 - - 0 - - 0 - - 0 - -
Simcoe County 0 - - 0 - - 0 - - 0 - - 0 - -
Adjala-Tosorontio 0 - - 0 - - 0 - - 0 - - 0 - -
Bradford West Gwillimbury 0 - - 0 - - 0 - - 0 - - 0 - -
Essa 0 - - 0 - - 0 - - 0 - - 0 - -
Innisfil 0 - - 0 - - 0 - - 0 - - 0 - -
New Tecumseth 0 - - 0 - - 0 - - 0 - - 0 - -
*
NOTE: Figures in this table cover transactions completed on a per square foot net basis and for which pricing was disclosed during the reporting period. This differs from the chart summarizing square feet
leased on Page 2 of this report, which covers all leasing transactions in the TREB service area.
Commercial Realty Watch, Third Quarter 2012 7
8. TREB Commercial Division
SUMMARY OF OFFICE LEASING
CITY OF TORONTO
TRANSACTIONS COMPLETED ON A PER SQUARE FOOT NET BASIS, WITH PRICING DISCLOSED
All Transactions 0 to 1,000 Square Feet 1,001 TO 2,500 Square Feet 2,501 TO 5,000 Square Feet 5,001+ Square Feet
# Trans. Sq. Ft. $/SF Net # Trans. Sq. Ft. $/SF Net # Trans. Sq. Ft. $/SF Net # Trans. Sq. Ft. $/SF Net # Trans. Sq. Ft. $/SF Net
TREB Total 109 300,511 $10.79 51 32,748 $14.52 33 53,242 $12.05 16 54,155 $10.83 9 160,366 $9.59
City of Toronto 37 148,406 $10.91 24 14,834 $18.12 6 9,214 $18.52 4 14,307 $13.38 3 110,051 $8.97
Toronto West 15 115,022 $9.11 10 6,981 $12.97 1 1,373 $11.36 2 5,877 $17.39 2 100,791 $8.33
Toronto W01 1 2,677 $26.22 0 - - 0 - - 1 2,677 $26.22 0 - -
Toronto W02 0 - - 0 - - 0 - - 0 - - 0 - -
Toronto W03 1 400 $13.50 1 400 $13.50 0 - - 0 - - 0 - -
Toronto W04 4 2,888 $11.49 4 2,888 $11.49 0 - - 0 - - 0 - -
Toronto W05 6 16,172 $5.81 4 3,008 $13.29 1 1,373 $11.36 0 - - 1 11,791 $3.25
Toronto W06 1 685 $17.52 1 685 $17.52 0 - - 0 - - 0 - -
Toronto W07 0 - - 0 - - 0 - - 0 - - 0 - -
Toronto W08 2 92,200 $9.03 0 - - 0 - - 1 3,200 $10.00 1 89,000 $9.00
Toronto W09 0 - - 0 - - 0 - - 0 - - 0 - -
Toronto W10 0 - - 0 - - 0 - - 0 - - 0 - -
Toronto Central 16 29,582 $16.85 9 5,251 $24.51 4 6,641 $19.92 2 8,430 $10.59 1 9,260 $16.00
Toronto C01 3 2,420 $29.26 2 770 $46.75 1 1,650 $21.09 0 - - 0 - -
Toronto C02 4 16,316 $17.65 1 557 $29.08 1 1,869 $26.50 1 4,630 $16.00 1 9,260 $16.00
Toronto C03 0 - - 0 - - 0 - - 0 - - 0 - -
Toronto C04 0 - - 0 - - 0 - - 0 - - 0 - -
Toronto C06 0 - - 0 - - 0 - - 0 - - 0 - -
Toronto C07 2 2,195 $19.68 1 500 $27.60 1 1,695 $17.35 0 - - 0 - -
Toronto C08 0 - - 0 - - 0 - - 0 - - 0 - -
Toronto C09 0 - - 0 - - 0 - - 0 - - 0 - -
Toronto C10 1 900 $16.67 1 900 $16.67 0 - - 0 - - 0 - -
Toronto C11 0 - - 0 - - 0 - - 0 - - 0 - -
Toronto C12 0 - - 0 - - 0 - - 0 - - 0 - -
Toronto C13 1 1,427 $13.00 0 - - 1 1,427 $13.00 0 - - 0 - -
Toronto C14 2 1,081 $29.67 2 1,081 $29.67 0 - - 0 - - 0 - -
Toronto C15 3 5,243 $5.87 2 1,443 $10.81 0 - - 1 3,800 $4.00 0 - -
Toronto East 6 3,802 $19.02 5 2,602 $19.03 1 1,200 $19.00 0 - - 0 - -
Toronto E01 1 1,200 $19.00 0 - - 1 1,200 $19.00 0 - - 0 - -
Toronto E02 0 - - 0 - - 0 - - 0 - - 0 - -
Toronto E03 2 1,522 $22.86 2 1,522 $22.86 0 - - 0 - - 0 - -
Toronto E04 1 550 $5.50 1 550 $5.50 0 - - 0 - - 0 - -
Toronto E05 0 - - 0 - - 0 - - 0 - - 0 - -
Toronto E06 0 - - 0 - - 0 - - 0 - - 0 - -
Toronto E07 1 250 $24.00 1 250 $24.00 0 - - 0 - - 0 - -
Toronto E08 0 - - 0 - - 0 - - 0 - - 0 - -
Toronto E09 1 280 $20.36 1 280 $20.36 0 - - 0 - - 0 - -
Toronto E10 0 - - 0 - - 0 - - 0 - - 0 - -
Toronto E11 0 - - 0 - - 0 - - 0 - - 0 - -
*
NOTE: Figures in this table cover transactions completed on a per square foot net basis and for which pricing was disclosed during the reporting period. This differs from the chart summarizing square feet
leased on Page 2 of this report, which covers all leasing transactions in the TREB service area.
Commercial Realty Watch, Third Quarter 2012 8
9. TREB Commercial Division
SUMMARY OF INDUSTRIAL SALES
ALL TREB AREAS
TRANSACTIONS COMPLETED WITH PRICING DISCLOSED
All Transactions 0 to 5,000 Square Feet 5,001 to 15,000 Square Feet 15,001 to 50,000 Square Feet 50,001 + Square Feet
# Trans. Sq. Ft. $/SF # Trans. Sq. Ft. $/SF # Trans. Sq. Ft. $/SF # Trans. Sq. Ft. $/SF # Trans. Sq. Ft. $/SF
TREB Total 101 1,907,356 $70.18 54 105,651 $156.13 17 148,482 $110.36 19 509,769 $101.86 11 1,143,454 $43.14
Halton Region 3 97,496 $75.75 1 1,260 $206.35 0 - - 1 24,270 $122.58 1 71,966 $57.67
Burlington 0 - - 0 - - 0 - - 0 - - 0 - -
Halton Hills 0 - - 0 - - 0 - - 0 - - 0 - -
Milton 0 - - 0 - - 0 - - 0 - - 0 - -
Oakville 3 97,496 $75.75 1 1,260 $206.35 0 - - 1 24,270 $122.58 1 71,966 $57.67
Peel Region 25 433,023 $108.75 13 28,151 $159.76 3 31,527 $111.81 7 227,918 $117.67 2 145,427 $84.21
Brampton 9 189,379 $89.50 6 9,024 $166.48 0 - - 1 34,928 $91.62 2 145,427 $84.21
Caledon 1 11,200 $80.36 0 - - 1 11,200 $80.36 0 - - 0 - -
Mississauga 15 232,444 $125.79 7 19,127 $156.58 2 20,327 $129.14 6 192,990 $122.39 0 - -
City of Toronto 33 887,266 $59.15 13 27,303 $142.12 9 64,718 $116.61 6 129,008 $91.93 5 666,237 $43.82
West 15 433,830 $70.03 2 6,000 $160.00 6 43,855 $125.16 4 91,688 $91.12 3 292,287 $53.29
Central 0 - - 0 - - 0 - - 0 - - 0 - -
East 18 453,436 $48.75 11 21,303 $137.09 3 20,863 $98.64 2 37,320 $93.92 2 373,950 $36.43
York Region 26 130,200 $136.43 21 40,005 $170.83 2 19,448 $140.12 3 70,747 $115.96 0 - -
Aurora 5 37,665 $104.08 4 7,388 $170.55 0 - - 1 30,277 $87.86 0 - -
E. Gwillimbury 0 - - 0 - - 0 - - 0 - - 0 - -
Georgina 0 - - 0 - - 0 - - 0 - - 0 - -
King 0 - - 0 - - 0 - - 0 - - 0 - -
Markham 5 8,365 $166.89 5 8,365 $166.89 0 - - 0 - - 0 - -
Newmarket 2 3,467 $175.94 2 3,467 $175.94 0 - - 0 - - 0 - -
Richmond Hill 3 6,285 $194.91 3 6,285 $194.91 0 - - 0 - - 0 - -
Vaughan 11 74,418 $142.60 7 14,500 $161.59 2 19,448 $140.12 2 40,470 $136.98 0 - -
Whitchurch-Stouffville 0 - - 0 - - 0 - - 0 - - 0 - -
Durham Region 12 320,265 $27.39 5 7,032 $106.44 3 32,789 $78.99 1 20,620 $82.44 3 259,824 $14.38
Ajax 1 20,620 $82.44 0 - - 0 - - 1 20,620 $82.44 0 - -
Brock 1 12,387 $77.90 0 - - 1 12,387 $77.90 0 - - 0 - -
Clarington 1 1,495 $105.69 1 1,495 $105.69 0 - - 0 - - 0 - -
Oshawa 2 6,877 $85.79 1 1,475 $111.86 1 5,402 $78.67 0 - - 0 - -
Pickering 1 942 $87.58 1 942 $87.58 0 - - 0 - - 0 - -
Scugog 2 200,376 $7.59 0 - - 0 - - 0 - - 2 200,376 $7.59
Uxbridge 0 - - 0 - - 0 - - 0 - - 0 - -
Whitby 4 77,568 $48.45 2 3,120 $109.94 1 15,000 $80.00 0 - - 1 59,448 $37.26
Dufferin County 1 1,900 $0.00 1 1,900 $144.74 0 - - 0 - - 0 - -
Orangeville 1 1,900 $0.00 1 1,900 $144.74 0 - - 0 - - 0 - -
Simcoe County 1 37,206 $9.86 0 - - 0 - - 1 37,206 $9.86 0 - -
Adjala-Tosorontio 0 - - 0 - - 0 - - 0 - - 0 - -
Bradford West Gwillimbury 0 - - 0 - - 0 - - 0 - - 0 - -
Essa 0 - - 0 - - 0 - - 0 - - 0 - -
Innisfil 0 - - 0 - - 0 - - 0 - - 0 - -
New Tecumseth 1 37,206 $9.86 0 - - 0 - - 1 37,206 $9.86 0 - -
*
NOTE: Figures in this table cover transactions for which pricing was disclosed during the reporting period. This differs from the chart summarizing sales on Page 2 of this report, which covers all sale transactions
in the TREB service area.
Commercial Realty Watch, Third Quarter 2012 9
10. TREB Commercial Division
SUMMARY OF INDUSTRIAL SALES - CONDOMINIUM BREAKOUT
ALL TREB AREAS
TRANSACTIONS COMPLETED WITH PRICING DISCLOSED
All Transactions 0 to 5,000 Square Feet 5,001 to 15,000 Square Feet 15,001 to 50,000 Square Feet 50,001 + Square Feet
# Trans. Sq. Ft. $/SF # Trans. Sq. Ft. $/SF # Trans. Sq. Ft. $/SF # Trans. Sq. Ft. $/SF # Trans. Sq. Ft. $/SF
TREB Total 47 103,752 $139.08 43 77,524 $149.89 4 26,228 $117.62 0 - - 0 - -
Halton Region 1 1,260 $206.35 1 1,260 $206.35 0 - - 0 - - 0 - -
Burlington 0 - - 0 - - 0 - - 0 - - 0 - -
Halton Hills 0 - - 0 - - 0 - - 0 - - 0 - -
Milton 0 - - 0 - - 0 - - 0 - - 0 - -
Oakville 1 1,260 $206.35 1 1,260 $206.35 0 - - 0 - - 0 - -
Peel Region 8 13,937 $156.63 8 13,937 $156.63 0 - - 0 - - 0 - -
Brampton 4 5,566 $150.90 4 5,566 $150.90 0 - - 0 - - 0 - -
Caledon 0 - - 0 - - 0 - - 0 - - 0 - -
Mississauga 4 8,371 $160.43 4 8,371 $160.43 0 - - 0 - - 0 - -
City of Toronto 14 42,701 $115.56 11 22,203 $113.70 3 20,498 $117.57 0 - - 0 - -
West 3 17,450 $115.19 1 3,000 $101.67 2 14,450 $117.99 0 - - 0 - -
Central 0 - - 0 - - 0 - - 0 - - 0 - -
East 11 25,251 $115.81 10 19,203 $115.58 1 6,048 $116.57 0 - - 0 - -
York Region 19 38,722 $167.97 18 32,992 $176.68 1 5,730 $117.80 0 - - 0 - -
Aurora 4 7,388 $170.55 4 7,388 $170.55 0 - - 0 - - 0 - -
E. Gwillimbury 0 - - 0 - - 0 - - 0 - - 0 - -
Georgina 0 - - 0 - - 0 - - 0 - - 0 - -
King 0 - - 0 - - 0 - - 0 - - 0 - -
Markham 5 8,365 $166.89 5 8,365 $166.89 0 - - 0 - - 0 - -
Newmarket 2 3,467 $175.94 2 3,467 $175.94 0 - - 0 - - 0 - -
Richmond Hill 2 4,600 $196.74 2 4,600 $196.74 0 - - 0 - - 0 - -
Vaughan 6 14,902 $156.56 5 9,172 $180.77 1 5,730 $117.80 0 - - 0 - -
Whitchurch-Stouffville 0 - - 0 - - 0 - - 0 - - 0 - -
Durham Region 4 5,232 $104.84 4 5,232 $104.84 0 - - 0 - - 0 - -
Ajax 0 - - 0 - - 0 - - 0 - - 0 - -
Brock 0 - - 0 - - 0 - - 0 - - 0 - -
Clarington 1 1,495 $105.69 1 1,495 $105.69 0 - - 0 - - 0 - -
Oshawa 1 1,475 $111.86 1 1,475 $111.86 0 - - 0 - - 0 - -
Pickering 1 942 $87.58 1 942 $87.58 0 - - 0 - - 0 - -
Scugog 0 - - 0 - - 0 - - 0 - - 0 - -
Uxbridge 0 - - 0 - - 0 - - 0 - - 0 - -
Whitby 1 1,320 $108.33 1 1,320 $108.33 0 - - 0 - - 0 - -
Dufferin County 1 1,900 $0.00 1 1,900 $144.74 0 - - 0 - - 0 - -
Orangeville 1 1,900 $0.00 1 1,900 $144.74 0 - - 0 - - 0 - -
Simcoe County 0 - - 0 - - 0 - - 0 - - 0 - -
Adjala-Tosorontio 0 - - 0 - - 0 - - 0 - - 0 - -
Bradford West Gwillimbury 0 - - 0 - - 0 - - 0 - - 0 - -
Essa 0 - - 0 - - 0 - - 0 - - 0 - -
Innisfil 0 - - 0 - - 0 - - 0 - - 0 - -
New Tecumseth 0 - - 0 - - 0 - - 0 - - 0 - -
*
NOTE: Figures in this table cover transactions for which pricing was disclosed during the reporting period. This differs from the chart summarizing sales on Page 2 of this report, which covers all sale transactions
in the TREB service area.
Commercial Realty Watch, Third Quarter 2012 10
11. TREB Commercial Division
SUMMARY OF INDUSTRIAL SALES - OTHER TYPES BREAKOUT
ALL TREB AREAS
TRANSACTIONS COMPLETED WITH PRICING DISCLOSED
All Transactions 0 to 5,000 Square Feet 5,001 to 15,000 Square Feet 15,001 to 50,000 Square Feet 50,001 + Square Feet
# Trans. Sq. Ft. $/SF # Trans. Sq. Ft. $/SF # Trans. Sq. Ft. $/SF # Trans. Sq. Ft. $/SF # Trans. Sq. Ft. $/SF
TREB Total 54 1,803,604 $66.22 11 28,127 $173.34 13 122,254 $108.81 19 509,769 $101.86 11 1,143,454 $43.14
Halton Region 2 96,236 $74.04 0 - - 0 - - 1 24,270 $122.58 1 71,966 $57.67
Burlington 0 - - 0 - - 0 - - 0 - - 0 - -
Halton Hills 0 - - 0 - - 0 - - 0 - - 0 - -
Milton 0 - - 0 - - 0 - - 0 - - 0 - -
Oakville 2 96,236 $74.04 0 - - 0 - - 1 24,270 $122.58 1 71,966 $57.67
Peel Region 17 419,086 $107.15 5 14,214 $162.83 3 31,527 $111.81 7 227,918 $117.67 2 145,427 $84.21
Brampton 5 183,813 $87.64 2 3,458 $191.57 0 - - 1 34,928 $91.62 2 145,427 $84.21
Caledon 1 11,200 $80.36 0 - - 1 11,200 $80.36 0 - - 0 - -
Mississauga 11 224,073 $124.50 3 10,756 $153.59 2 20,327 $129.14 6 192,990 $122.39 0 - -
City of Toronto 19 844,565 $56.30 2 5,100 $265.88 6 44,220 $116.17 6 129,008 $91.93 5 666,237 $43.82
West 12 416,380 $68.13 1 3,000 $218.33 4 29,405 $128.69 4 91,688 $91.12 3 292,287 $53.29
Central 0 - - 0 - - 0 - - 0 - - 0 - -
East 7 428,185 $44.80 1 2,100 $333.81 2 14,815 $91.33 2 37,320 $93.92 2 373,950 $36.43
York Region 7 91,478 $123.07 3 7,013 $143.31 1 13,718 $149.44 3 70,747 $115.96 0 - -
Aurora 1 30,277 $87.86 0 - - 0 - - 1 30,277 $87.86 0 - -
E. Gwillimbury 0 - - 0 - - 0 - - 0 - - 0 - -
Georgina 0 - - 0 - - 0 - - 0 - - 0 - -
King 0 - - 0 - - 0 - - 0 - - 0 - -
Markham 0 - - 0 - - 0 - - 0 - - 0 - -
Newmarket 0 - - 0 - - 0 - - 0 - - 0 - -
Richmond Hill 1 1,685 $189.91 1 1,685 $189.91 0 - - 0 - - 0 - -
Vaughan 5 59,516 $139.10 2 5,328 $128.57 1 13,718 $149.44 2 40,470 $136.98 0 - -
Whitchurch-Stouffville 0 - - 0 - - 0 - - 0 - - 0 - -
Durham Region 8 315,033 $26.11 1 1,800 $111.11 3 32,789 $78.99 1 20,620 $82.44 3 259,824 $14.38
Ajax 1 20,620 $82.44 0 - - 0 - - 1 20,620 $82.44 0 - -
Brock 1 12,387 $77.90 0 - - 1 12,387 $77.90 0 - - 0 - -
Clarington 0 - - 0 - - 0 - - 0 - - 0 - -
Oshawa 1 5,402 $78.67 0 - - 1 5,402 $78.67 0 - - 0 - -
Pickering 0 - - 0 - - 0 - - 0 - - 0 - -
Scugog 2 200,376 $7.59 0 - - 0 - - 0 - - 2 200,376 $7.59
Uxbridge 0 - - 0 - - 0 - - 0 - - 0 - -
Whitby 3 76,248 $47.41 1 1,800 $111.11 1 15,000 $80.00 0 - - 1 59,448 $37.26
Dufferin County 0 - - 0 - - 0 - - 0 - - 0 - -
Orangeville 0 - - 0 - - 0 - - 0 - - 0 - -
Simcoe County 1 37,206 $9.86 0 - - 0 - - 1 37,206 $9.86 0 - -
Adjala-Tosorontio 0 - - 0 - - 0 - - 0 - - 0 - -
Bradford West Gwillimbury 0 - - 0 - - 0 - - 0 - - 0 - -
Essa 0 - - 0 - - 0 - - 0 - - 0 - -
Innisfil 0 - - 0 - - 0 - - 0 - - 0 - -
New Tecumseth 1 37,206 $9.86 0 - - 0 - - 1 37,206 $9.86 0 - -
*
NOTE: Figures in this table cover transactions for which pricing was disclosed during the reporting period. This differs from the chart summarizing sales on Page 2 of this report, which covers all sale transactions
in the TREB service area.
Commercial Realty Watch, Third Quarter 2012 11