Debug tool
•
1 j'aime•1,341 vues

A IBM® Debug Tool for z/OS® permite examinar, monitorar e controlar a execução de programas C, C++, COBOL e PL/I. Esse programa sofisticado fornece múltiplos pontos de interrupção condicionais e não condicionais, depuração em modo de etapas e a capacidade de monitorar e atualizar variáveis e armazenamento. A Debug Tool é uma ferramenta de depuração de nível de origem interativa para aplicativos compilados em uma variedade de ambientes de desenvolvimento.

Recommandé
Contenu connexe
Tendances
Tendances (20)
En vedette
Similaire à Debug tool
Similaire à Debug tool (20)
Dernier
Dernier (20)
Debug tool
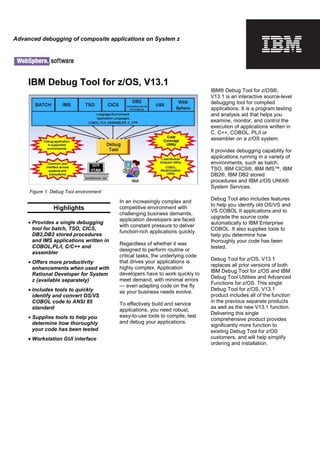
- 1. IBM Debug Tool for z/OS, V13.1 Highlights • Provides a single debugging tool for batch, TSO, CICS, DB2,DB2 stored procedures and IMS applications written in COBOL,PL/I, C/C++ and assembler • Offers more productivity enhancements when used with Rational Developer for System z (available separately) • Includes tools to quickly identify and convert OS/VS COBOL code to ANSI 85 standard • Supplies tools to help you determine how thoroughly your code has been tested • Workstation GUI interface In an increasingly complex and competitive environment with challenging business demands, application developers are faced with constant pressure to deliver function-rich applications quickly. Regardless of whether it was designed to perform routine or critical tasks, the underlying code that drives your applications is highly complex. Application developers have to work quickly to meet demand, with minimal errors — even adapting code on the fly as your business needs evolve. To effectively build and service applications, you need robust, easy-to-use tools to compile, test and debug your applications. IBM® Debug Tool for z/OS®, V13.1 is an interactive source-level debugging tool for compiled applications. It is a program testing and analysis aid that helps you examine, monitor, and control the execution of applications written in C, C++, COBOL, PL/I or assembler on a z/OS system. It provides debugging capability for applications running in a variety of environments, such as batch, TSO, IBM CICS®, IBM IMS™, IBM DB2®, IBM DB2 stored procedures and IBM z/OS UNIX® System Services. Debug Tool also includes features to help you identify old OS/VS and VS COBOL II applications and to upgrade the source code automatically to IBM Enterprise COBOL. It also supplies tools to help you determine how thoroughly your code has been tested. Debug Tool for z/OS, V13.1 replaces all prior versions of both IBM Debug Tool for z/OS and IBM Debug Tool Utilities and Advanced Functions for z/OS. This single Debug Tool for z/OS, V13.1 product includes all of the function in the previous separate products as well as the new V13.1 function. Delivering this single comprehensive product provides significantly more function to existing Debug Tool for z/OS customers, and will help simplify ordering and installation. Advanced debugging of composite applications on System z Figure 1: Debug Tool environment
- 2. 2 Debug Tool is tightly integrated with IBM Rational® Developer for System z® and other tools in the IBM portfolio of problem determination tools, so that you can develop, test and debug traditional and SOA applications from the same user interface. Data at your fingertips Debug Tool provides an interactive, full-screen, IBM 3270 system-based terminal interface with four windows that enable single-step debugging, dynamic patching and breakpoints: • The Monitor window displays the status of items you select, variables and registers. You can view, monitor and alter application variables or storage in real-time. • The Source window displays the program code, highlighting the statement being run. In the prefix area of this window, you can enter commands to set, display and remove breakpoints. • The Log window records and displays your interactions with Debug Tool and can show program output. The information you see in this window is included in the log file. • The Memory window (swappable with the Log window) helps you display and scroll through sections of memory. You can update memory by typing over existing data with new data. The Memory window also keeps track of addresses for easier navigation. Debug Tool gives you great flexibility to choose how to display monitored variables and lets you update large or small variables directly in the monitor window. For COBOL character variables displayed using the automonitor command, Debug Tool displays values in character format regardless of whether the string contains unprintable characters. You can change these values by typing over them in the Monitor window. In the automonitor section of the Monitor window, you can display the value of a variable in the variable’s declared data type and displaying the user register names in assembler AUTOMONITOR output, when possible. Control debugging environment With Debug Tool, you can choose how you view and manage the process of debugging your applications. Using the full-screen interface, you can interactively debug almost any application as it runs — including batch applications. You can start Debug Tool when an application starts or during an abend. Alternatively, you can write applications so that they start the tool automatically — at specified times — interrupting the running of the application. Figure 2: Rational Developer for System z works with Debug Tool to help mainframe developers be more productive.
- 3. 3 Using the setup utility, you can create a setup file that contains the program information you need — including file allocations, runtime options, program parameters and application name — to run your application and start Debug Tool. Setup files can save you time when you are debugging a program that you have to restart multiple times. You can create several setup files for each program. Each setup file can store information about starting and running your program under different circumstances. IBM Language Environment® user exits can be linked with the application or with a private copy of a Common Execution Environment (CEE) runtime load module. Review source while you debug Debug Tool enables you to focus on a particular problem area by checking your application for errors one line at a time. By using single-step debugging — and setting dynamic breakpoints — you can monitor, interrupt and continue the flow of the application to identify errors easily. A basic breakpoint indicates a stopping point in your program. For example, you can use a breakpoint to stop on a particular line of code. Breakpoints can also contain instructions, calculations and application changes. For example, you can set a breakpoint to have Debug Tool display the contents of a variable when the debugging process reaches a particular line of code. You can also use a breakpoint to patch the flow of the program dynamically. You can set breakpoints in an application to monitor variables for changes, and watch for specified exceptions and conditions while an application runs. You can set, change and remove breakpoints as you debug the application. This means that you don’t have to know where you want to set a breakpoint before you start debugging. In CICS, Debug Tool supports “pattern matching breakpoints” that use the program or compile unit names specified in CADP or DTCN profiles to start Debug Tool and provides commands to enable and disable the breakpoints. You can also debug applications written in a mix of COBOL, C, C++ or PL/I languages without leaving the tool. You can also include assembler programs in this mix and, using the disassembly view, you can debug programs compiled with the NOTEST compiler option or applications that include other languages. For each programming language you can use a set of interpreted commands to specify actions to be taken. These commands are subsets of the languages — so they’re easy to learn, and you can modify the flow of your application while you are debugging it. You can use the commands to dynamically patch (or alter) the value of variables and structures and to control the flow of an application. SOA development and debugging Debug Tool supports debugging of monolithic, composite, and SOA applications. Customers creating new Web services — whether newly written or refactored using existing application assets that use Rational Developer for System z — can immediately debug them using the Debug Tool plug-in provided. DESCRIBE CHANNEL and LIST CONTAINER commands can display CICS channels and containers, including containers that hold state information for Web services. Users can display the information, even if it is not being referenced by the application program being debugged. Debug Tool now provides support for invoking the z/OS XML parser to parse complete XML 1.0 or 1.1 documents in memory. If the document is syntactically valid, the XML is formatted and shown in the Debug Tool log. Otherwise, diagnostic information is provided to help identify the syntax error. Enhanced debugging capabilities Debug Tool provides a rich set of commands, tools and utilities to help you to debug your programs. When used with the setup utility in Debug Tool, these can help to: Prepare your high-level language and programs for debugging by converting, compiling (or assembling) and linking your COBOL, PL/I, C/C++ and assembler source code. -Conduct analysis on your test cases to determine how thoroughly they validate your programs. In complex applications, it’s easy to forget how you reached a particular point in your program. Debug Tool commands enable you to replay statements that have already run. If you compile your program with the IBM COBOL for OS/390® and VM compiler, or the Enterprise COBOL for z/OS compiler, you can review the values of variables and replay the statements while debugging. For programs compiled with the COBOL for OS/390 and VM compiler, the Enterprise COBOL for z/OS compiler, or the Enterprise PL/I for z/OS compiler, you can automatically monitor the values of variables referenced at the current statement. When the automonitor function is active, any variables that are referenced by the current statement are automatically selected for
- 4. 4 monitoring. You can view these variables in the monitor window. Move to Enterprise COBOL to reuse and extend existing code Previously, to create faster, more efficient applications, you had to sacrifice debugging support. With Debug Tool you can debug Enterprise COBOL for z/OS applications that have been compiled with standard or full- optimization compiler options. You can also analyze your load modules to help you identify candidate OS/VS COBOL programs for conversion and then to convert these OS/VS COBOL applications to Enterprise COBOL for z/OS. You can then compile and debug these applications to extend the life of your existing code. Debug Tool software also provides coverage tools that enable you to conduct analysis on your test cases and determine how thoroughly they exercise your programs. Combine with other development tools to optimize applications Debug Tool shares a number of side files with IBM Fault Analyzer, making it easier for you to test and manage abends in new and existing applications. For example, the IDILANGX file produced by Fault Analyzer can be used by Debug Tool to debug assembler programs, and you can create a readable listing from a Fault Analyzer side file or a SYSDEBUG file generated by the COBOL compiler. You can also use the Interactive System Productivity Facility (ISPF) panels in Debug Tool to invoke File Manager Base, DB2 or IMS functions and a user exit enables you to specify a TEST run-time option string in the DB2, IMS or batch environments. Debug in many environments IBM Debug Tool can help you debug an application while it runs in a host environment, such as a batch application, TSO, ISPF, CICS, IMS or DB2 (including IBM DB2 stored procedures) environments. Debug Tool can help you debug almost any application and almost any host language, including COBOL, PL/I, C/C++ and Assembler applications running on z/OS systems. With Debug Tool, you can compile and link your COBOL, PL/I, C and C++ programs, and assemble and link Assembler programs — as well as pre-process and compile your CICS and DB2 programs. IBM Rational Developer for System z works with Debug Tool, to give your developers a fully integrated development, test and debugging environment for all applications running on z/OS, whether traditional, SOA or Web- based. A CICS utility transaction (CADP or DTCN) enables you to control debugging in the CICS environment. For example, you can debug based on a specific program or transaction name, while other CICS-specific capabilities enable you to specify the span of a debug session or view — or edit CICS storage and diagnose storage violations. Display and alteration of 64-bit general purpose registers in assembler expressions is provided on hardware that supports 64-bit addressing. Debug Tool correctly displays data items according to type, including three floating-point data types: binary (IEEE), decimal and hexadecimal. Figure 3: Formatted XML structure using List Storage command
- 5. 5 New in V13.1 • A new method for gathering code coverage is added for the generation, viewing, and reporting of code coverage using the Debug Tool mainframe interface (MFI) as the engine. This support is provided for applications written in Enterprise COBOL and Enterprise PLI that are compiled with the TEST compile option and its suboption SEPARATE. This is enabled via the new EQAOPTS CCPROGSELECTDSN, CCOUTPUTDSN and CCOUTPUTDSNALLOC commands. • Debug Tool is enhanced to provide the automatic start of IMS message processing program (MPP) regions and dynamic routing of transactions. This allows a developer to dynamically start an MPP region, route a transaction to that MPP region and at the end of the transaction shutdown the MPP region created for the developer thus reducing system resources. • To help with the ease of use of the MFI mode of Debug Tool for some users, an option is added that enables breakpoints, the current line, and the line with found text to be identified by a character indicator. This feature is enabled via a new EQAOPTS ALTDISP command. • Supports Enterprise COBOL for z/OS, V5.1; Enterprise PL/I for z/OS, V4.4; CICS TS V5.1; DB2 V11; IMS V13; z/OS, V2.1; and C/C++ V2.1. • Debug Tool now supports JCL for Batch Debugging in the DTSP plug-in. This facility is used to instrument JCL to initiate a debug session from the DTSP plug-in. • Support is added for an IMS transaction that is associated with a generic ID. A new feature is added to the consolidated Language Environment user exit (EQAD3CXT) to search a new cross-reference table for the user ID of a user who wants to debug a IMS transaction that is started from the web and is associated with a generic ID. This enables Debug Tool to debug these transactions that use a generic ID. The user ID from the cross-reference table is used to find the user's Debug Tool user exit data set (userid.DBGTOOL.EQAUOPT S), which specifies the TEST runtime parameters and the display device address. A new option is added to the Debug Tool Utilities ISPF panel, "C IMS Transaction and User ID Cross Reference Table" to allow each user to update the new cross reference table. • Support is added for tracing load modules loaded by an application. New commands TRACE LOAD and LIST TRACE LOAD are added for Debug Tool's MFI mode. This set of commands allows the user to get a trace of load modules loaded by the application. Start the trace by issuing TRACE LOAD START. Use LIST TRACE LOAD to display the trace. The trace includes load modules known to Debug Tool at the time the TRACE LOAD START command is entered and all that are loaded while the trace is active. End the trace by issuing TRACE LOAD END. Note that when the trace is ended, all trace information is deleted. • Support is added for terminating an idle Debug Tool session that uses the Terminal Interface Manager. Debug Tool supports a time-out option (via the new EQAOPTS SESSIONTIMEOU T command), which allows the system programmer to establish a maximum wait time for debug sessions using a dedicated terminal or the Terminal Interface Manager. If the debug session exceeds the specified time limit without any user interaction, the session will be terminated with either a QUIT or QUIT DEBUG. • Enhanced Debug Tool Coverage Utility 'Create HTML Targeted Coverage Report' allows the user to select from a list of COBOL Program-IDs, ignore changes to non- executable code, and produce a summary of the targeted lines with selectable HTML links. • Adds IMS information to start and stop messages generated by the EQAOPTS STARTSTOPMSG command. • Adds EQAOPTS STARTSTOPMSGDSN command and a new Debug Tool Utilities option 'Non-CICS Debug Session Start and Stop Message Viewer' to collect and view Debug Tool debugger session start and stop information. • Enhanced delay debug mode with a new EQAOPTS DLAYDBGCND command to control CONDITION trapping. In addition, a new EQAOPTS DLAYDBGXRF command is added so that delay debug mode can use the 'IMS Transaction and User ID Cross Reference Table'. Further, NOTEST is now handled in delay debug mode. • A confirmation message is added to Debug Tool Utilities option 6 'Debug Tool User Exit Data Set' to indicate that the updates have been saved into the EQAUOPTS data set. • The ON and AT OCCURRENCE commands are enhanced for Enterprise PL/I to support qualifying data. • Commands are added, LIST LDD and CLEAR LDD, that display and remove LDD commands known to Debug Tool, and LIST CC and CC (START and STOP) that tell the Debug Tool debugger to gather and display code coverage data. • Other customer-requested capabilities and usability improvements to enhance the debugging session.
- 6. 6 Part of a leading-edge family of z/OS tools Debug Tool for z/OS is part of the IBM Problem Determination family of products. These include IBM Application Performance Analyzer for z/OS, IBM Debug Tool for z/OS, IBM Fault Analyzer for z/OS, IBM File Manager for z/OS, and IBM Workload Simulator for OS/390 and z/OS. Designed to help you maximize your investment in IBM System z products, these products are a robust suite of integrated development tools that enable you to improve IT operational efficiency and transform applications to achieve greater business flexibility. The IBM Problem Determination tools help application developers to improve application delivery throughout the application life cycle. You can use these tools to help increase productivity and IT effectiveness across source code debugging, application ABEND analysis, data management and application performance analysis. The IBM Problem Determination tools do much more than support traditional applications. They include capabilities that enable you to build SOA applications. They are tightly integrated with other tools in the IBM problem determination tools portfolio, as well as other tool sets. The tools also continue to support and make the most of the latest subsystem levels. These capabilities help make IBM problem determination tools an excellent choice for your business. For more information To learn more about IBM problem determination tools, contact your IBM representative or IBM Business Partner, or visit the following Web sites: IBM Problem Determination Tools family: ibm.com/software/awdtools/ deployment/ IBM Application Performance Analyzer for z/OS: ibm.com/software/awdtools/apa/ IBM Debug Tool for z/OS: ibm.com/software/awdtools/ debug tool/ IBM Fault Analyzer for z/OS: ibm.com/software/awdtools/ faultanalyzer IBM File Manager for z/OS: ibm.com/software/awdtools/ filemanager IBM Workload Simulator for z/OS and OS/390: ibm.com/software/awdtools/ workloadsimulator © Copyright IBM Corporation 2013 IBM Corporation 555 Bailey Ave San Jose, CA 95141, U.S.A. Produced in the U.S.A. October 2013 All Rights Reserved IBM, the IBM logo, ibm.com, and WebSphere are trademarks of IBM Corporation, registered in many jurisdictions worldwide. A current list of IBM trademarks is available on the Web at “Copyright and trademark information” at ibm.com/legal/copytrade.shtml . Java and all Java-based trademarks and logos are trademarks of Sun Microsystems, Inc, in the United States, other countries, or both. Microsoft and Windows are trademarks of Microsoft Corporation, in the United States, other countries, or both. UNIX is a registered trademark of The Open Group in the United States and other countries Other company, product and service names may be trademarks or service marks of others. References in this publication to IBM products or services do not imply that IBM intends to make them available in all countries in which IBM operates. The IBM home page on the internet can be found at ibm.com IBM Debug Tool for z/OS, V13.1, at a glance Hardware requirements • Any hardware configuration capable of running IBM z/OS Software requirements • IBM z/OS, V1.12 (5694-A01) or later • Depending on the functions used in the product, other related products may be required. See the product Web site, listed below, for more detailed software requirements