1.
What
is
Research360?
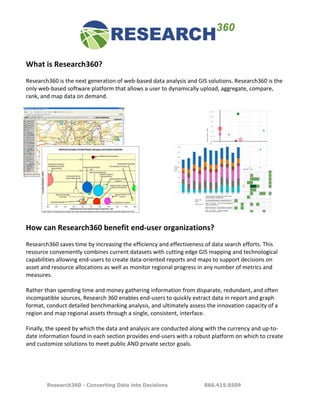
Research360
is
the
next
generation
of
web-‐based
data
analysis
and
GIS
solutions.
Research360
is
the
only
web-‐based
software
platform
that
allows
a
user
to
dynamically
upload,
aggregate,
compare,
rank,
and
map
data
on
demand.
How
can
Research360
benefit
end-‐user
organizations?
Research360
saves
time
by
increasing
the
efficiency
and
effectiveness
of
data
search
efforts.
This
resource
conveniently
combines
current
datasets
with
cutting
edge
GIS
mapping
and
technological
capabilities
allowing
end-‐users
to
create
data-‐oriented
reports
and
maps
to
support
decisions
on
asset
and
resource
allocations
as
well
as
monitor
regional
progress
in
any
number
of
metrics
and
measures.
Rather
than
spending
time
and
money
gathering
information
from
disparate,
redundant,
and
often
incompatible
sources,
Research
360
enables
end-‐users
to
quickly
extract
data
in
report
and
graph
format,
conduct
detailed
benchmarking
analysis,
and
ultimately
assess
the
innovation
capacity
of
a
region
and
map
regional
assets
through
a
single,
consistent,
interface.
Finally,
the
speed
by
which
the
data
and
analysis
are
conducted
along
with
the
currency
and
up-‐to-‐
date
information
found
in
each
section
provides
end-‐users
with
a
robust
platform
on
which
to
create
and
customize
solutions
to
meet
public
AND
private
sector
goals.
Research360 - Converting Data into Decisions 866.419.8509
2. What
are
some
of
the
immediate
returns
on
investment
from
the
Research360
solution?
• Asset
mapping
and
benchmarking
capabilities
for
gap
and
SWOT
analysis,
as
well
as
a
functional
inventory
of
hard
and
soft
drivers
of
innovation
and
economic
capacity
building
• Trends
and
real-‐time
impact
analysis
of
critical
inputs
to
the
economy,
the
workforce,
and
the
sustainability
of
competitiveness
among
regional,
state
and
federal
investments
• Determination
of
federal
and
state
resource
allocation
plans
and
increased
collaboration
and
alignment
among
various
stakeholders,
and
organizations
through
fact-‐driven
analysis
• Identification
of
new
targets
of
opportunity
across
technological,
scientific,
and
industry
sectors
leading
to
consistent
growth
in
jobs
and
entrepreneurial
outcomes
• Streamlining
the
use
of
internal
data
to
assist
researchers
and
decision
makers
• Creating
a
network
of
shared
business
intelligence
through
our
unique
SHARE
technology
allows
regional
and
state
agencies
to
unlock
the
power
of
data
• Regional,
State
or
National
networks
of
users
are
able
to
leverage
a
cost
effective
data
dissemination
tool
through
a
consistent,
easy
to
use
software
solution
Patents
Economic
Forecast
Research360 - Converting Data into Decisions 866.419.8509
3. Features
and
Functionality
• Upload
data
appended
to
standard
geographies
to
create
reports
and
thematic
maps
–
from
pie-‐charts
to
hot-‐maps
• HTML
export
of
reports
(users
can
then
link
the
url
as
public
access
data)
• Select
Geographies
by
market
capture
• SHARE
data,
report
formats,
and
map
templates
with
other
Research360
users
in
a
customized
network
• Custom
Chart
creation
from
all
datasets
thru
our
just-‐in-‐time
DataDashboard
• Compare
dissimilar
geographies
including
radius
versus
drive
time
or
radius
versus
standard
geographies
• Create
Weighted
indices
• Merge
Radius
or
Drive
time
boundaries
• State
name
appended
to
geography
selections
• Map
customization
including
increased
thematic
ranges
and
defining
thematic
ranges
by:
Equal
Value,
Equal
Class
Counts,
Class
Percent,
Means
and
Standard
Deviations,
Individual
Values
• Save
Reports
by
Project/Geography
• Create
Custom
Reports
that
combine
standard
data
and
your
uploaded
data
• Additional
map
options:
Google
Earth,
Google
Maps,
Virtual
Earth,
Yahoo
Maps
• 3D
mapping
available
from
Virtual
Earth
• Save
Map
Templates
by
Project
• Save
or
Export
Maps
as:
GIF,
JPG,
TIF,
PNG,
WMF,
or
EMF
file
formats
• Thematic
Mapping
available
for
large
areas
(i.e.
multiple
states)
up
to
the
entire
U.S.
at
any
geography
level
• Multi-‐user
Admin
controls
for
managing
access
to
uploaded
data
and
for
sharing
report
and
map
templates
• Rank
geography
options
with
a
“sort
by
data
variable”
feature
within
HTML
outputs
• Innovation
Datasets
–
now
available
for
thematic
mapping
and
custom
reports
across
datasets
• PopStats
–
the
only
demographic
database
with
Quarterly
Updates
• 500
mile
radius
and
4
hour
travel
time
geographies
available
• additional
features
and
functionality
available
upon
request
Research360 - Converting Data into Decisions 866.419.8509
4.
Research
Package
Descriptions
All
Packages
include
the
PRO
version
of
Research360,
D&B
Business
Location
data,
and
NAICS
Business
Summary
data
Research360
Advantage
–
Workforce
and
Industry
Data
Enhance
your
workforce
and
training
related
decisions
with
our
Industry
and
Occupation/Wage
data
modules.
Adding
to
the
data
and
technical
features
available
in
Research360
Professional,
Advantage
offers
current
and
projected
industry
cluster
data
including
location
quotient,
wage
and
occupation
growth
statistics
providing
users
with
an
economic
barometer
for
their
region.
In
addition,
occupation
levels
by
standard
occupation
code
help
determine
the
future
workforce
needs
of
emerging
businesses
and
industries.
Armed
with
this
information,
a
region
will
be
able
to
design
more
effective
regional
workforce
development
initiatives
and
a
superior
workforce
delivery
system.
Research360
InnovationEconomy
–
Federal/State
Funding,
Patents
and
VC
Our
Research360/
Innovation360
package
incorporates
key
datasets
to
our
Professional
solution
by
including
ten
years
worth
of
all
federal
funding
(R&D,
Economic
and
Workforce,
Community
and
Infrastructure,
Small
Business/Entrepreneurial
activities
–
some
600
programs
in
total),
patents,
and
venture
capital
that
can
help
to
identify
potential
gaps
and
weaknesses
as
well
as
key
opportunities
and
strengths.
In
this
knowledge-‐based
economy,
clusters
of
competency
in
the
workforce
drive
the
growth
of
new
industries.
It
is
essential
to
understand
where
knowledge
is
being
created,
transferred,
commercialized,
and
industrialized
when
determining
which
competencies
regional
businesses
will
demand
in
the
future.
Research360
Analyst
Research360
Analyst
is
the
ultimate
version
of
our
web-‐based
GIS
Software,
taking
numerous
sources
of
information
–
Professional
functionality,
NAICS
Business
Summary
and
Location
data,
Industry,
Occupation/Wage,
Patents,
Venture
Capital,
and
Federal
Funding
data
and
combining
them
into
one
powerful
decision
making
tool.
By
combining
these
tools
and
unique
datasets,
access
to
typical
employment,
wage,
labor-‐shed
and
other
knowledge
becomes
readily
available
to
decision
makers
at
all
levels.
Analyst
datasets
match
innovation
inputs
with
key
metrics
of
performance,
production,
and
overall
outputs
for
aggregating
intelligence
for
economic
and
workforce
related
activities.
Research360 - Converting Data into Decisions 866.419.8509
5. Data
Descriptions
Business
Location
Data
This
location
data
is
ideal
for
competitive
analysis,
understanding
market
opportunities
and
evaluating
market
dynamics.
Sourced
to
D&B®,
the
world's
most
trusted
source
of
sales
and
marketing
solutions,
all
D&B
information
is
powered
by
DUNSRightTM,
D&B's
Quality
Process
which
gives
you
the
insight
you
need
to
avoid
duplication,
better
target
prospects
and
increase
the
profitability
of
marketing
lists.
This
data
is
updated
quarterly
and
provided
down
to
6-‐digit
NAICS.
Business
Summary
Data
Employee
and
Establishment
counts
at
4
digit
NAICS
by
Industry
Consumer
Expenditures
This
data
includes
18
reports
and
close
to
1,000
variables
that
collectively
cover
almost
95%
of
household
spending.
Based
on
extensive
modeling
of
the
BLS
Consumer
Expenditure
Survey,
CEX
provides
reliable
estimates
of
market
demand
and
average
household
expenditures.
Retail
Potential
This
new
tabulation
utilizes
the
Census
of
Retail
Trade
tables
which
cross-‐tabulates
store
type
by
merchandise
line.
The
Consumer
Expenditure
data
was
aggregated
to
the
merchandise
line
classification
and
then
distributed
to
each
of
the
major
store
types.
The
store
type
classification
is
based
on
the
NAICS
definitions.
Crime
Index
Data
This
report
provides
indexed
crime
data
for
your
geography.
It
provides
indices
for
assault,
burglary,
larceny,
motor
vehicle
theft,
murder,
personal
crime,
property
crime,
rape
and
robbery.
It
also
provides
an
index
for
total
crime
in
the
area.
Federal
Funding
The
only
system
in
the
country
that
tracks
federal
funding
by
recipient
location
in
over
900
budget
codes
across
four
key
areas—Federal
Research
and
Development;
Economic
&
Community
Development;
Workforce
&
STEM;
and
Enterprise
&
Entrepreneurial
Development—broken
down
by
Research360 - Converting Data into Decisions 866.419.8509
6. program,
sponsoring
agency,
recipient,
and
year.
Also
includes
2008-‐2010
Stimulus/ARRA
spending
by
agency
and
program,
as
well
as
National
Science
Foundation
funding
initiatives.
Patents
Twenty-‐five
years
of
patents
categorized
by
year,
tech
sector,
and
assignee,
to
identify
key
technologies
for
commercialization
and
technological
strengths
and
gaps.
Venture
Capital
Identifies
SBIR,
early-‐stage/seed
stage,
and
venture
backed
investments
by
technology
sector,
recipient
company,
and
venture
firm.
Employment
and
Wages
Captures
historical,
current
and
projected
employment
and
wage
data
down
to
5
digit
NAICS
for
all
Standard
Occupation
Codes.
Covers
all
counties
in
the
U.S.
Industry
Data
Tracks
current
industry
employment,
location
quotient,
plus
5
and
10
year
projected
growth
data
for
400
industries.
Covers
all
counties
in
the
U.S.
State
and
Local
Procurement
Data
(additional
cost)
In
cooperation
with
ONVIA,
identifies
the
past
seven
years
worth
of
all
state,
county,
municipal,
primary/secondary
education,
university
and
community
college
procurement
of
labor,
materials,
equipment,
and
services
–
including
most
recent
ARRA
expenditures.
Corporate
and
Philanthropic
Giving
(additional
cost)
In
cooperation
with
GrantStation,
identifies
the
past
twenty-‐four
months
of
8,000
sources
of
gifts,
grants,
and
partnership
initiatives
provided
by
corporate,
family,
and
related
philanthropic
sources.
Since
many
federal,
state,
and
local
programs
requiring
matching
dollars
or
a
non-‐profit
lead
entity,
tracking
these
dollars
assist
in
projecting
additional
impacts
on
economic
output
Other
Options
and
Data
(additional
cost)
Partnerships
have
been
formed
with
several
other
data
providers
including
Monster.com
(accessing
their
job-‐seekers
aggregate
information
by
region,
occupation,
sector),
IPED
data
provided
by
US
Department
of
Education
on
degrees
and
certificates,
and
third
party
providers
of
information
on
social
networks
among
civic-‐business-‐academic
leadership.
Research360 - Converting Data into Decisions 866.419.8509
7.
Pricing
and
Budget
Parameters
Note:
Research360
is
the
first
web-‐based
GIS
solution
available
as
a
software
platform
only
–
data
is
optional.
“Software
Only”
Pricing
for
multiple
seat
licenses
–
PRO
Version
Up
to
5
users:
$1995/user
6
to
10
users:
$1790/user
11
to
25
users:
$1590/user
26
to
50
users:
$1390/user
51
to
100
users:
$1190/user
101
to
200
users:
$
990/user
201
to
500
users:
$
890/user
501
to
1000
users:
$
690/user
1000+
users:
$
490/user
Individual
Users/Organizations
have
the
option
of
licensing
add-‐on
datasets
from
the
pricing
schedule
below
for
their
respective
accounts.
Subscription
Rate
CORE
Software
with
no
data
$995.00
CORE
with
AGS
(annual)
$1,795.00
CORE
with
PopStats
(quarterly)
$2,995.00
PRO
Software
with
no
data
$1,995.00
PRO
with
AGS
(annual)
$2,795.00
PRO
with
PopStats
(quarterly)
$3,995.00
Add-‐On
Options
AGS
Business
Summary
by
NAICS
$795.00
AGS
CEX
$795.00
AGS
Retail
Potential
$595.00
AGS
MOSAIC
$1,995.00
AGS
Crime
$895.00
AGS
Climate
$495.00
D&B
Data
$1,495.00
D&B
Data
with
Contact
Information
$3,995.00
Research360 - Converting Data into Decisions 866.419.8509
8.
Federal
Funding
$2,495.00
Patents
$1,495.00
Venture
Capital
$1,295.00
Occupation,
Employment
&
Wages
$2,995.00
Industry
Data
$1,995.00
Research
Packages
Research360
Advantage
$7,995.00
Research360
Innovation
$9.995.00
Research360
Analyst
$12,495.00
For
additional
information
contact:
Chuck
Branch
Decision
Data
Resources
15
Office
Park
Circle
Suite
210
Birmingham,
AL
35223
205.871.0353
cbranch@decisiondata.net
Richard
Seline
National
Regional
Data
Consortium
1250
24th
Street
N.W.
Suite
300
Washington,
DC
20037
202.466.0566
rss@data-‐consortium.com
Research360 - Converting Data into Decisions 866.419.8509