1. Brasil to join ESO
The 2nd generation VLTI instrument GRAVITY
Spectroscopy of planet-forming discs
Large Lyman-break galaxy survey
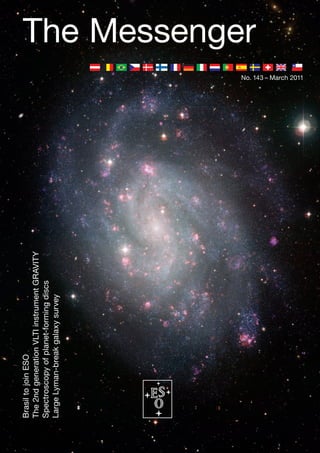
The Messenger
No. 143 – March 2011
2. The Organisation
Adriaan Blaauw, 1914–2010
In the last issue of The Messenger There follow three tributes to Adriaan Pottasch; and by Raymond Wilson, who
(142, p. 51) only a brief obituary of Adriaan Blaauw: by Tim de Zeeuw, current led the Optics Group during his tenure as
Blaauw, the second Director General ESO Director General; by his long-term Director General.
of ESO, could be included at the time of colleague at the Kapteyn Institute, Stuart
going to press.
Tim de Zeeuw1 but moved to Yerkes Observatory in
ESO [M]
1953, becoming its associate director in
1956, and moved back to Groningen
1
ESO in 1957, where he was in a key position to
contribute to transforming the idea of
Baade and Oort into reality. He was Sec-
Professor Adriaan Blaauw, ESO’s sec- retary of the ESO Committee (the proto-
ond Director General and one of the Council) from 1959 through 1963, a
most influential astronomers of the twen- period which included the signing of the
tieth century, passed away on 1 Decem- ESO Convention on 5 October 1962.
ber 2010. Blaauw became ESO’s Scientific Director
in 1968. In this position he also pro-
Adriaan Blaauw was born in Amsterdam, vided the decisive push which led to the
the Netherlands, on 12 April 1914. He creation of Astronomy and Astrophysics,
studied astronomy at Leiden University, which successfully combined and
under de Sitter, Hertzsprung and Oort, replaced the various individual national
and obtained his doctorate (cum laude) journals for astronomy, and today is
with van Rhijn at the Kapteyn Laboratory one of the leading astronomy research
in Groningen in 1946. His PhD thesis publications in the world. The article
was entitled “A study of the Scorpio– by Pottasch (1994) and the following trib-
Centaurus Cluster”. During his career, ute provide further details of Blaauw’s
Blaauw became renowned for his ground- creative leadership in the founding of the
breaking studies of the properties of European astronomical journal.
OB associations (groups of young, hot
stars) which contain the fossil imprint Blaauw was Director General from 1970 Figure 1. Adriaan Blaauw in 1973 while Director Gen-
through 1974. During this period several eral of ESO. From a photograph taken during a con-
of their star formation history. Perhaps his
tract-signing ceremony for building works at La Silla.
most famous work explained why some telescopes, including the ESO 0.5-metre
OB stars are found in isolation travelling and 1-metre Schmidt telescopes, began
at unusually high velocity: the so-called operating at ESO’s first observatory The Messenger may serve to give the
“run-away stars”. Blaauw proposed in site, La Silla, in Chile, and much work world outside some impression of what
1961 that these stars had originally been was done on the design and construction happens inside ESO.” The continuing
members of binary systems, and when of the ESO 3.6-metre telescope, which popularity of The Messenger is a testi-
one star in the binary experiences a had its first light in 1976. Blaauw decided mony to Blaauw’s foresight.
supernova explosion, its companion sud- that it was crucial for this project to move
denly ceases to feel the gravitational ESO’s Headquarters and the Technical After stepping down as Director General
pull that keeps it in its orbit and hence it Department from Hamburg to Geneva, to of ESO, Blaauw returned to Leiden,
“runs away” at its orbital velocity. benefit from the presence of the experi- where I had the privilege to be amongst
enced CERN engineering group. He also his students. He continued to play a
In addition to his distinguished research oversaw the development of the Proto- very important role in international astron-
career, Blaauw played a central role in col for Privileges and Immunities that is omy. He was President of the Interna-
the creation of ESO. In 1953, Baade and critical for ESO’s functioning. In May tional Astronomical Union from 1976 to
Oort proposed the idea of combining 1974 he launched The Messenger with 1979, during which period he used his
European resources to create an astro- the stated goal: “to promote the partici- considerable diplomatic skills to convince
nomical research organisation that pation of ESO staff in what goes on in China to rejoin the IAU. From 1979 to
could compete in the international arena. the organisation, especially at places of 1982 he served on the ESO Council on
Blaauw had returned to Leiden in 1948, duty other than our own. Moreover, behalf of the Netherlands. He retired from
2 The Messenger 143 – March 2011
3. his Leiden professorship in 1981 and ESO’s early history with some of us of science, honorary doctorates from
moved back to Groningen, but stayed (see the photograph in The Messenger, the University of Besancon and from
active in various areas. This included 137, p. 6). During this visit he revealed his l’Observatoire de Paris and, like his pre-
organising the historical archives of ESO wish to visit Chile one more time if his decessor as ESO Director General,
and of the IAU — work which resulted in health would allow this. It was a pleasure Otto Heckman, the Bruce Medal of the
two books, ESO’s Early History (Blaauw, to organise this trip in February 2010. Astronomical Society of the Pacific. He
1991) and History of the IAU (Blaauw, He met ESO “legends” Albert Bosker, Jan was well known for his warm personality,
1994). He also served as Chairman of Doornenbal, Erich Schumann and Daniel wisdom, humour, legendary patience,
the Scientific Evaluation Committee for Hofstadt and was driven to La Silla and and the rare gift of being able to slow
the European Space Agency satellite Paranal by car to enjoy Chile’s beautiful down when the pressure mounted. The
HIPPARCOS, advising on many aspects landscapes. He characteristically engaged personal account of his life, entitled
of its scientific programme. When the young people at the telescopes and “My Cruise Through the World of Astron-
data became available in 1996, he was in Vitacura in interesting discussions and omy”, published in the 2004 Annual
actively involved in the re-analysis of the throughout the visit displayed a crystal- Reviews of Astronomy and Astrophysics
young stellar groups that he had studied clear perspective on the development of (Blaauw, 2004), provides an accurate
first during his PhD research. ESO and on the exciting opportunities and inspiring picture of a truly remarkable
for the future programme (a photograph person, who positively influenced the
Blaauw remained keenly interested in of this visit is shown in The Messenger, lives of many.
developments at ESO. After a discussion 139, p. 61). The characteristic twinkle in
with him in late 2008, he drove himself his eye was as bright as ever.
to Garching and back in July 2009 in References
order to take another look at the historical Blaauw won many academic distinctions, Blaauw, A. 2004, ARAA, 42, 1
documents in the library and to discuss including membership of many academies Pottasch, S. R. 1994, The Messenger, 76, 62
Stuart Pottasch1 tronomers of PhD level or higher, with the This is where Adriaan, who was at that
result that 75 % of those present agreed time Scientific Director of ESO, came
that a new journal was desirable. Simi- in. He suggested, organised and imple-
1
Kapteyn Laboratorium, Groningen, lar meetings took place at a somewhat mented a legal status for the new jour-
the Netherlands higher level in other countries. At this nal. The basic idea was that ESO would
point there was much enthusiasm to begin make use of the fact that it was an offi-
a new journal. This led to a meeting of cial European organisation. Its adminis-
Adriaan has contributed to many fields of European astronomers on 8 April 1968. trative and legal services were made
astronomy. In the long years we have available to the journal through a formal
known and worked with each other there In spite of the enthusiasm for the Euro- agreement between ESO and the Board
are two aspects that may be less well pean astronomical journal, there were of Directors of the journal. This agree-
known and that I would like to highlight. rather difficult problems ahead. These ment was confirmed at the December
problems were of a practical nature and 1968 ESO Council meeting, just before
First of all is the deep interest he took in arose because the new journal was to the first issue of the new journal As
the formation of the European journal be a combination of journals published in tronomy and Astrophysics appeared in
Astronomy and Astrophysics. Adriaan various European countries. The indi- January 1969. Individual countries
took part in the initial discussions, which vidual journals all had a rather different could now contribute financially to the
first began to take real shape in 1967 status. Some were owned by private journal, but ESO itself would carry no
and especially in 1968. The discussions publishers, some by astronomical organi- financial responsibility for the journal. At
in 1967 took place in several European sations. The French journals were owned the same time the Board would be en-
countries. At first they were independent by the ministry in France, which could tirely independent of any influence from
of each other and took place because not contribute financially to a European the ESO side on its scientific policy.
of a general feeling in Europe that existing journal without an official treaty between
European astronomical journals were various countries. The timescale for But this did not end Adriaan’s connec-
not being read to the same extent as the such a treaty, essentially the creation of tion with the new journal. He accepted
American journals. In December 1967 an international organisation, was ex- an invitation to become a member of
a meeting took place in France which pected to be long, and the discussions the Board of Directors and was in fact
was attended by almost all French as- complicated. elected chairman of that body. The
The Messenger 143 – March 2011 3
4. The Organisation de Zeeuw T., Pottasch S., Wilson R., Adriaan Blaauw, 1914–2010
importance of this can be seen in the fact where Adriaan was able to reconcile the to combine his scientific curiosity with
that the journal at the time was more differences. He was chairman of the A&A various administrative responsibilities
turbulent than it is at present. Not only Board for about ten years. without letting the one cloud out the
were there more disputes between indi- other. I think that he was able to do this
vidual scientists, there were also dis- A second aspect of Adriaan’s career because he approached science in
putes between different countries, espe- that is worth highlighting can be stated an unhurried and patient way. Astron-
cially about the refereeing. Some of more simply. He remained an active omy interested him; there was always
these disputes were brought to the Board scientist for his whole life, and was able time for it.
Raymond Wilson1 building on the CERN campus. The total would have been no active optics at ESO
staff in this fledgling technical division and, consequently, no NTT, VLT or E-ELT
of ESO cannot have numbered more than project. The readers of this tribute will
1
Rohrbach/Ilm, Germany ten or twelve. understand, I am sure, why I hold Adriaan
Blaauw in such high esteem.
A major contractual problem now emerged.
It is an honour and a pleasure to write a I had clearly understood, from Blaauw’s Finally, there was another aspect of
tribute to Adriaan Blaauw, whom I con- interview with me, that I would be the his leadership which I greatly admired.
sider to be an underrated Director Gen- leader of a newly-founded Optics Group, Once settled in with my new Optics
eral of ESO, above all through being in dealing with all optical aspects of tele- Group, things were going quite well for
the long shadow thrown by his successor scopes (at that time, mainly the 3.6-metre me and I was elected to be Staff Rep-
Lodewijk Woltjer. telescope) and instrumentation. How- resentative. In Blaauw’s weekly one-day
ever, in the technical group, led by Svend visits to Geneva, I was always the first
I am unable to make any comments Laustsen, the responsibility for telescope person he visited. But he was not con-
regarding his achievements in the astro- optics was in the hands of a German cerned about my technical function,
nomical field. I am only going to comment astronomer, Alfred Behr, and for instru- which we had organised: he left that to
on my personal experience of his work mentation optics in the hands of Anders Laustsen, who had, of course, accepted
as ESO Director General, above all at the Reiz, a Danish astronomer. My role in the new Optics Group, in which Behr’s
time when I was engaged by him per- this existing structure appeared only to work was now integrated under my lead-
sonally to create and head a new Optics be that of a senior assistant to them, ership. No, he visited me first as Staff
Group on the technical side of ESO’s above all to Alfred Behr. This situation Representative to ask if the staff were
activities. At this time, his office was still was unacceptable to me and not as I had content or whether there were any prob-
in Hamburg, where ESO was founded, understood the scope of the position I lems where he should intervene. This
above all, by Professor Otto Heckman, had accepted. proves again his absolutely fair and hu-
for the 3.6-metre telescope project. This mane leadership!
project was intended to bring ESO up to Blaauw normally only came to Geneva
the level of the American telescopes with, for one day a week. However, when I Adriaan Blaauw was not only a great ESO
at that time, one of the larger telescopes rang him up and explained the gravity of Director General, he was also an admi-
built in the post-Palomar (5-metre) era. the situation and the inevitability of my rable gentleman of impeccable integrity.
leaving ESO immediately if he could not
I left the firm of Carl Zeiss to go to ESO rectify it, he came at once and we dis-
in 1972, when Zeiss, at the time of a cussed the matter over another good
serious recession in German industry, lunch. I emphasised my clear position on
started laying off staff, including those of the matter and that I would try to return
my own Optical Design department, to Zeiss immediately, in spite of the bad
where I had conceived my idea of active situation there. Blaauw recognised that
optics. Professor Blaauw interviewed I was very serious and stated he would
me over a good lunch in Geneva. He inform Laustsen at once that a new Optics
immediately offered me a senior position Group would immediately be founded
at ESO in Geneva, where, through his under my leadership. Without this bold
initiative, ESO had a small barrack-type and clear direction by Blaauw there
4 The Messenger 143 – March 2011
5. The Organisation
Brazil to Join ESO
Tim de Zeeuw1 now be submitted to the Brazilian Par- nities for Brazilian high-tech industry to
liament for ratification. The signing of contribute to the ESO programme, in-
the agreement followed its unanimous cluding the European Extremely Large
1
ESO approval by the ESO Council during an Telescope project. It will also bring
extraordinary meeting, by teleconference, new resources and skills to the organi-
on 21 December 2010. sation at the right time for them to make
On 29 December 2010, at a ceremony a major contribution to this exciting pro-
in Brasilia, the Brazilian Minister of Sci- “Joining ESO will give new impetus to the ject,” added Tim de Zeeuw.
ence and Technology, Sergio Machado development of science, technology and
Rezende and the ESO Director General, innovation in Brazil as part of the consid- The president of ESO’s governing body,
Tim de Zeeuw signed the formal acces- erable efforts our government is making the Council, Laurent Vigroux, concluded:
sion agreement, paving the way for Brazil to keep the country advancing in these “Astronomers in Brazil will benefit from
to become a Member State of the Euro- strategic areas,” said Minister Rezende. collaborating with European colleagues,
pean Southern Observatory. Brazil will and naturally from having observing time
become the fifteenth Member State and “The membership of Brazil will give the at ESO’s world-class observatories at
the first from outside Europe. Since the vibrant Brazilian astronomical community La Silla, Paranal and APEX at Chajnantor,
agreement implies accession to an inter- full access to the most productive obser- as well as on ALMA, which ESO is con-
national convention, the agreement must vatory in the world and open up opportu- structing with its international partners.”
Figure 1. ESO Director General, Tim de Zeeuw,
(right) in discussion with the Brazilian Minister
of Science and Technology, Sergio Machado
Rezende, during the accession ceremony in
Brasilia on 29 December 2010.
The Messenger 143 – March 2011 5
6. Telescopes and Instrumentation
Fisheye image of the interior of the
dome for VLT UT4 Yepun. See
potw1049 for details.
HH 30 2MASSWJ1207334-393254
778 mas
55 AU at 70pc N
200 AU
E
Detection of intermediate
Ten year large mass BH in GCs/Arches
programme Orbit of exo-
Stellar motions in nuclei
Jupiter/Uranus Detection of SR/GR effects of nearby galaxies
in cusp star orbits
Three year large Astrometric signal
Detection of dark halo around SgrA*
programme exo-Jupiter/Uranus
3D dynamics of nuclear star cluster
Evolution outflows in Gas flows in AGN
YSOs & micro-QSOs SgrA* flare dynamics
Single season Proper motions massive star cluster
campaign Imaging jets/discs
in YSOs & CBs Binary dynamics Lensing
10 0
10 2
10 4
10 6
Maximum distance from Earth (pc)
Key experiments with GRAVITY are illustrated (see
article by Eisenhauer et al. p. 16). Clockwise from
S27 S31 S19
S12 top left are: jet/discs in a nearby star-forming
S29 region; planet-brown dwarf binary; dust disc with
S5 S14 S17
S4 S2 central gap; Arches star cluster; M31 star discs;
S6
NGC 1068 outflow/narrow line region; modelling of
S39
a Galactic Centre flare; radial precession of stellar
S21 orbits; S-star orbits; nuclear star cluster and radio
S1 S13
S18 emission in the Galactic Centre. In the central
S8
S33
inset the horizontal axis denotes the maximum
S9 S24 distance from Earth, the vertical axis the time span
of the measurements.
6 The Messenger 143 – March 2011
7. Telescopes and Instrumentation
HARPSpol — The New Polarimetric Mode for HARPS
Nikolai Piskunov1 and linear polarisations across their pro- This sets very stringent limits on the di-
Frans Snik 2 files. For non-degenerate objects, the mensions of the polarimeter, because it
Andrey Dolgopolov 3 continuum is mostly unpolarised, which needs to fit in between various mecha-
Oleg Kochukhov1 offers a reliable intrinsic calibration that is nisms (calibration light feeds, calibration
Michiel Rodenhuis 2 necessary for measuring very weak fields, mirror and fibre cover) filling the adapter.
Jeff Valenti 4 but such measurements require a very The polarimeter consists of the enclo-
Sandra Jeffers 2 stable spectropolarimetric instrument. sure hosting a precision horizontal slider.
Vitaly Makaganiuk1 The slider holds two identical optical
Christopher Johns-Krull 5 The HARPS spectrograph at ESO’s tables installed perpendicular to the slid-
Eric Stempels1 3.6-metre telescope at La Silla is one of ing direction. Each optical table contains
Christoph Keller 2 the most successful spectroscopic as- a full set of polarisation optics (Figure 1),
tronomical instruments ever built (Mayor separating the incoming light into two
et al., 2003). The exceptional temporal beams. Since the polarising beam-splitter
1
Department of Physics and Astronomy, and spatial stability of HARPS makes position is fixed relative to the fibres, the
Uppsala University, Sweden it an ideal instrument for spectropolarim- polarisation of the incoming light needs
2
Sterrekundig Instituut Utrecht, Utrecht etry. The new polarimeter takes full ad- to be converted to the frame of the beam-
University, the Netherlands vantage of the two optical fibres to bring splitter. This is achieved by rotating wave
3
Crimean Astrophysical Observatory, the collected light, split into two orthogo- plates in front of the beam-splitters: a
Crimea, Ukraine nal polarisations, from the Cassegrain half-wave plate for the linear polarimeter
4
STScI, Baltimore, USA focus of the 3.6-metre telescope to the and a quarter-wave plate for the circular
5
Rice University, Houston, USA HARPS spectrograph. Analysing polari- one. The relative intensity of the two
sations at the Cassegrain focus mini- beams at each wavelength carries the
mises the influence of instrumentation on information about the polarisation of the
The HARPS spectrograph can now the measurements. The new module, light.
perform a full polarisation analysis of called HARPSpol, allows sensitive and
spectra. It has been equipped with accurate measurements of both circular The polarising beam-splitters consist
a polarimetric unit, HARPSpol, which and linear polarisations of stellar light of a Foster prism (a modified Glan–
was jointly designed and produced as a function of wavelength, at high spec- Thompson polariser). The primary beam
by Uppsala, Utrecht and Rice Univer- tral resolution. In this article we give a suffers from crystal astigmatism, which
sities and by the STScI. Here we pre- short presentation of the polarimeter and is corrected by a cylindrical lens. The
sent the new instrument, demonstrate show some results from the first year of secondary beam is deviated by 45º.
its polarisation capabilities and show operation. Beam-channelling prisms align the opti-
the first scientific results. cal axis and the focus of the secondary
beam with the second HARPS fibre.
HARPSpol — What’s inside the box? The selected optical scheme solves two
Introduction
HARPSpol is installed inside the Casse- Figure 1. Schematic of the HARPSpol optical design.
Spectropolarimetry is one of a very few grain adapter, located directly below the Left: the view in the sliding direction. Right: side view
direct ways of detecting and studying primary mirror of the 3.6-metre telescope. of the two polarimeters.
magnetic fields. Magnetic fields are pre-
sumed to play crucial roles in all kinds
of objects and environments in space,
stirring turbulence, transporting angular
momentum, converting kinetic energy
to radiation, controlling plasma motion,
etc. Magnetic fields create polarisation in
spectral lines though the Zeeman effect,
and thus polarisation measurements
allow us to measure the strength and the
orientation of the field vector, providing
important clues for understanding star
formation, the origin of structures in stel-
lar atmospheres and stellar activity. In
fact, the origin and the evolution of mag-
netic fields remains one of the most
important topics in modern astrophysics.
Spectral lines formed in the presence of
a magnetic field generally exhibit circular
The Messenger 143 – March 2011 7
8. Telescopes and Instrumentation Piskunov N. et al., HARPSpol — The New Polarimetric Mode for HARPS
difficulties: (1) it is highly achromatic, Figure 2. HARPSpol
is shown during installa-
that is, the image of a star after projection
tion. The HARPSpol
through HARPSpol is essentially the enclosure is on the right.
same in the red and in the blue parts of The slider is in the linear
the spectrum; and (2) slight errors in polarisation position.
The half-wave plate for
positioning of the slider do not affect the
the linear polarimeter
optical/polarisation performance. More is visible in the middle of
information about the optical design the picture. The round
of HARPSpol can be found in Snik et al. mirror below the linear
polarimeter is one of the
(2008, 2010).
HARPS fibre heads.
The selected wave plates are super-
achromatic. They consist of five layers of
birefringent polymer. This makes the
polarimeters suitable for the entire HARPS
wavelength range (380–690 nm) without
introducing (polarised) fringes. The simul-
taneous measurements in two polari-
sation directions, together with the polari-
sation modulation by the wave plates,
renders the polarimetry with HARPSpol
to first order insensitive to seeing and
fibre/spectrograph throughput (Semel et
al., 1993; Bagnulo et al., 2009).
Integration
Once installed at the Cassegrain adapter,
HARPSpol was integrated with the HARPS
instrument control electronics and soft-
ware. When inserted into the optical path,
HARPSpol shifts the focus of the tele-
scope by approximately 2 mm, which is
compensated for by moving the sec-
ondary mirror. Figure 2 shows HARPSpol
installed inside the Cassegrain adapter.
Spectropolarimetry is performed by Figure 3. The total throughput from the telescope to
the detector with and without HARPSpol is shown.
selecting the corresponding template(s)
The sharp drops are not real: they are due to hydro-
in the observing software. Calibration and gen lines that are treated differently in spectro-
science templates are available for cir- photometry and spectropolarimetry.
cular and linear polarimetry. The science
Figure 4. The combined average
profile for intensity and polarisation
(lower and middle plots) for α Cen A.
Left panel shows circular polarisation
measurements (Stokes parameter V).
Middle and right panels are for linear
polarisations. The null profile is shown
uppermost. ∆ ∆ ∆
8 The Messenger 143 – March 2011
9. Figure 5. Comparison of the Stokes
spectra of a standard magnetic star γ
Equ taken at the CFHT with the
ESPANDONS spectropolarimeter (red
line) and with HARPSpol (black line) is
shown. The ESPADONS spectra were
taken as part of CFHT’s calibration
and engineering plan, and were
retrieved from the Canadian Astron-
omy Data Centre. The visible differ-
ences are mostly due to the higher
resolving power of HARPS.
Figure 6. One of the HARPS polarisa-
tion spectra of a CP star, HD 24712,
is shown. Both circular and linear
polarisations are detected for practi-
cally every spectral line.
template allows multiple exposures to to the lower throughput of the “sky fibre” plot in each panel of Figure 4 shows the
be taken in the selected mode (circular (used to carry one of the polarised so-called null spectrum, obtained by
or linear) for a sequence of wave-plate beams), but still sufficient to reach rather modifying the analysis in such a way as
angles. The full complement of polarisa- faint targets. to destroy the polarisation signal in the
tion characteristics can be registered incoming light (Bagnulo et al., 2009).
in six or twelve exposures, with the latter Systematic errors limit both the polari- What remains reflects the spurious polari-
offering intrinsic control over spurious metric sensitivity and the accuracy. The sation induced inside the instrumentation
polarisation signals. The HARPSpol pipe- sensitivity is the weakest polarisation or by the data reduction.
line then processes the data and the detectable with HARPSpol. After accu-
final products include the Stokes param- mulating enough photons we expect We do not expect any detectable polari-
eters as a function of wavelength. to see spurious polarisation present in sation signal from α Cen A and Figure 4
the light coming to the telescope. We test shows that our new instrument does not
this by observing a bright source and detect or induce any polarisation above
HARPSpol: Performance collecting many photons in a series of the level of 10 –5, which is on a par with
many short exposures. Figure 4 shows the best solar polarimeters like ZIMPOL
During commissioning we have meas- the results of the test for an inactive solar- (Ramelli et al., 2010). The accuracy (the
ured several characteristics of HARPSpol. type star, α Cen A, where we reach the level at which the HARPSpol measure-
The most important ones for the ob- median signal-to-noise ratio of 2 400 per ments match the true polarisation signal)
server are the total throughput of the sys- CCD column. Besides combining multi- is assessed by observing objects with
tem and the polarimetric sensitivity. The ple exposures we also derive the mean known polarisation spectra. Our observa-
throughput (Figure 3) was measured Stokes profiles using the least squares tions of γ Equ demonstrate the high
by observing spectrophotometric stand- deconvolution (LSD) technique (Donati et accuracy of HARPSpol. γ Equ is a well-
ards, reducing the data, rebinning it al., 1997; Kochukhov et al., 2010), which studied magnetic star showing linear and
to match the resolution of the spectro- takes advantage of the fact that most circular polarisations. The lack of notice-
photometry and deriving the sensitivity of the spectral lines are affected by mag- able rotation makes γ Equ an excellent
curves for each fibre. The total efficiency netic fields in a similar way. This increases polarisation standard. Figure 5 shows the
with HARPSpol is somewhat lower due the signal-to-noise even further. The top comparison of the HARPSpol polarisation
The Messenger 143 – March 2011 9
10. Telescopes and Instrumentation Piskunov N. et al., HARPSpol — The New Polarimetric Mode for HARPS
Figure 7. Spectropolarimetry of a K2 dwarf planet-
hosting star ε Eri taken with HARPSpol. Circular
polarisation profiles (left) are marked with observa-
tion times in days. Derived line-of-sight field strength
and uncertainty in Gauss are shown against time
(in Julian Day) on the right.
∆ ∆
spectra of this star with those taken Another example is a chromospherically a pipeline producing science-grade data
with the ESPADONS spectropolarimeter active cool dwarf ε Eri. This nearby star products. The tests and applications
(Donati et al., 2006) at the Canada harbours at least two planets and a dust to various types of objects have demon-
France Hawaii Telescope (CFHT) with a belt in orbit around it. Polarisation meas- strated high sensitivity and a low level
resolving power of 67 000. urements of stars hosting planets may of systematic effects, making HARPSpol
provide an important check for the pres- an ideal tool for detecting and studying
ence of starspots that can mimic radial weak magnetic fields, reconstructing field
HARPSpol: First results velocity variations. Detection of polarisa- topology and many other magnetic phe-
tion can reveal signatures of star–planet nomena.
One of the obvious applications of magnetic interactions. Our polarisation
HARPSpol is in the study of the topology measurements for ε Eri are presented
of magnetic fields on chemically pecu- in Figure 7. Again, we applied the LSD References
liar (CP) stars. The goal is to understand technique to enhance the signal-to-noise Bagnulo, S. et al. 2009, PASP, 121, 993
the relationship between the field geome- ratio and we see an unambiguous sig- Donati, J.-F. et al. 1997, MNRAS, 291, 658
try and the surface/depth distribution nal in circular polarisation. A simplistic Donati, J.-F. et al. 2006, Solar Polarization 4,
of chemical elements. This task requires interpretation with a longitudinal field ASP Conf. Series, 358, 362
Kochukhov, O. et al. 2010, A&A, 524, 5
a series of observations well spread geometry shows field strength changing Kotov, V. A. et al. 1998, ApJ, 116, 103
over the rotation period so as to see all from – 5.8 to +4.7 Gauss with median Mayor, M. et al. 2003, The Messenger, 114, 20
visible parts of the stellar surface. Figure uncertainty of 0.1 Gauss! These values Ramelli, R. et al. 2010, SPIE, 7735, 1
6 shows an example of one measure- are comparable to the disc-averaged Semel, M. et al. 1993, A&A, 278, 231
Snik, F. et al. 2008, SPIE, 7014, 22
ment in such a series for a cool magnetic magnetic field of the Sun (Kotov et al., Snik, F. et al. 2010, arXiv: 1010.0397
CP star HD 24712. Circular and linear 1998).
polarisation were detected in all 13 phases
covering the whole stellar rotation (bad
weather prevented the collection of one Prospects
set of circular polarisation data) and one
can easily follow the evolution of polari- HARPSpol adds powerful polarimetric
sation spectra with stellar rotation. The capabilities to the suite of ESO high-
low level of the noise makes the data resolution spectroscopic instruments. It
quite adequate for reconstructing the field is fully integrated into the ESO opera-
topology. tional environment and is equipped with
10 The Messenger 143 – March 2011
11. Telescopes and Instrumentation
Tests of Radiometric Phase Correction with ALMA
Bojan Nikolic1 than temperature fluctuations. ALMA is observed astronomical data can be cor-
John Richer1 attempting to correct the effects of these rected for the effect of path fluctuations.
Rosie Bolton1 fluctuations through a combination of
Richard Hills 2 two techniques: frequent observations of
calibration sources; and direct measure- Water vapour radiometers
ment of atmospheric properties along
1
Astrophysics Group, Cavendish the line of sight of each of the 54 12-metre The water vapour radiometers (WVRs)
Laboratory, University of Cambridge, diameter telescopes using mm-wave are the devices that measure accu-
United Kingdom radiometers that measure emission of the rately the absolute brightness of down-
2
Joint ALMA Observatory, Santiago, 183 GHz water vapour line. ALMA is welling radiation along the lines of sight of
Chile the first telescope to employ phase cor- the antennas. The prototype WVRs for
rection based on mm-wave water vapour ALMA were developed by a collaboration
radiometers. between the University of Cambridge
Of the many challenges facing ALMA, and Onsala Space Observatory. After
one of the greatest is overcoming Water in the atmosphere is poorly mixed successful laboratory and field testing of
the natural seeing limit set by the atmos- and the concentration (and phase) of the prototypes, an industrial partner
phere to achieve very high resolution water varies rapidly with position in the (Omnisys Instruments AB, Sweden) was
images. Its longest antenna separations atmosphere and with time. The underly- contracted for delivery of the produc-
(baselines) permit ALMA to synthesise ing reason for this is of course that all tion units. The production stage is now
the effect of a single antenna with a three phases of water are accessible in already fully complete and ALMA has
diameter exceeding 15 km, but an ac the range of temperatures and pres- taken delivery of radiometers for all of the
curate radio “adaptive optics” system sures typical on the ground and in the planned 54 12-metre antennas.
is required to ensure ALMA’s images atmosphere, leading to various localised
are diffraction limited. With initial test sources and sinks of water vapour. The ALMA radiometers are unique
data now available from the first ALMA Even at a very high and dry site like among the radiometers used for phase
antennas in Chile, we describe current ALMA, changes of up to 50 % in line-of- correction in that they measure sky
progress towards this goal. sight water vapour can be observed brightness around 183 GHz, as opposed
in a matter of minutes. Additionally, water to 22 GHz, which is the spectral region
vapour has a high effective refractive where most other WVR systems are
Atmospheric limitations to radio index at mm and sub-mm wavelengths: designed to observe. This has a number
astronomy one millimetre of precipitable water of advantages, primarily based on the
vapour retards radiation by an equivalent very high strength of the water vapour
ALMA aims to synthesise an antenna of about seven millimetres of path in line at 183 GHz (see Figure 1 for plots of
with an effective diameter of over 15 km: vacuum. The combination of poor mixing brightness in typical conditions), which
this would have a diffraction-limited and high refractive index leads to a is about 150 times stronger than the line
resolution of 15 milliarcseconds at a fre- corruption of the wavefront of incoming at 22 GHz. This means that fluctuations
quency of 300 GHz. (Note, however, astronomical radiation. When observing in water vapour content produce much
that for most projects with ALMA, we with an aperture synthesis array like higher, more readily observed fluctuations
anticipate that a more modest resolution ALMA, these wavefront errors lead to in the observed brightness at this fre-
of 50–100 milliarcseconds will be re- phase errors in the recorded visibilities. quency. Besides this, the high strength
quested by scientists.) In comparison, the of the line means that radiation from
uncorrected radio seeing at this fre- In order to correct for these errors, each sources other than atmospheric water
quency would typically limit the resolution of ALMA’s 12-metre diameter antennas vapour has a smaller influence on the
of images to 700 milliarcseconds if no has an accurate millimetre-wave radiome- predicted phase corrections. For exam-
adaptive optics corrections were applied ter that measures the radiation pas- ple, clouds, spill-over past the primary
(see Evans et al., 2003). sively emitted by water molecules in the reflector of the antenna and man-made
atmosphere along the line of sight of radio frequency interference (RFI) all have
The seeing at sub-millimetre and milli- the antenna. The radiometers cover fre- a smaller effect relative to the strength of
metre wavelengths arises due to atmos- quencies around the 313 -> 220 rotation the line.
pheric (specifically, tropospheric) insta- line of the para water molecule, which is
bilities that lead to fluctuations of the centred at 183.3 GHz. This line lies about Measurements at these higher frequen-
refractive index and consequent path 200 K above the ground state and so is cies do, however, also present a number
errors in the propagating wavefront. As ideal for tracing atmospheric properties. of challenges:
explained in a previous Messenger arti- The principle of radiometric phase cor- 1. Design and production of the hardware
cle (Nikolic et al., 2008), the process rection is that these measurements can is more complex and expensive,
is analogous to that affecting the optical be used to compute the quantity of water requiring custom components and high
seeing, but the dominant contribution vapour along the line of sight of each precision machining.
to the refractive index fluctuations is from antenna and, consequently, the equiva- 2. Calibration is more difficult as it needs
inhomogeneities in water vapour, rather lent path error. Using these estimates the to be based on very frequent (10 Hz
The Messenger 143 – March 2011 11
12. Telescopes and Instrumentation Nikolic B. et al., Tests of Radiometric Phase Correction with ALMA
Figure 1. The water
vapour line at 183 GHz.
The upper left, upper
right and lower left pan-
els show how the simu-
lated brightness of the
atmospheric 183 GHz
water vapour line varies
with changes in total
contents of the water
vapour, the atmospheric
temperature and atmos-
pheric pressure. The
lower right panel shows
the nominal filter pass-
ν ν bands for the ALMA
183 GHz water vapour
radiometers. The detec-
tion system is double-
sideband and so only
the average signal of the
two filters symmetric
around the line centre is
measured.
ν ν
in the case of ALMA) observation of we read out at 1 Hz, which is fast enough and we do not need to try to retrieve the
physical internal calibration loads. to capture essentially all the path varia- total extra path due to the water vapour
3. The water vapour line is close to satu- tions. in the atmosphere. Additionally, frequent
ration and thus subject to non-linear observation of point-like sources will
effects, leading to significantly more The task of the phase correction soft- allow ALMA to calibrate the expected
complex software requirements. ware is to turn these 1 Hz measurements “zero” phase and it is only the departures
in four filters into phase rotations to be from this that are important.
Over the past twelve months, extensive applied to the observed astronomical sig-
testing of the first WVR systems has nal. The first step in the analysis is to use The close relationship between fluctua-
been carried out at the ALMA site. The the four observed sky brightness tem- tions in sky brightness and the path
preliminary results of these tests suggest peratures, together with ancillary weather errors is illustrated in Figure 2, which is
that the development and production information, to make an inference about based on recent observations by ALMA.
stage has successfully met these chal- the total quantity, temperature and pres- During this observation, the telescope
lenges. So far, the units installed on the sure of the water vapour. This is impor- was tracking a quasar (i.e., a point-like
ALMA antennas appear to be perform- tant because the profile of the water va- source) at a known location on the sky,
ing well in terms of noise, stability and pour line is a strong function of these so for a perfect interferometer we would
reliability. parameters, as shown in Figure 1, and expect to measure visibilities with con-
because the near-saturation of the line stant phase and amplitude. The phase
means that the observed sky brightness we actually measure is therefore an esti-
Technique is not in general linearly related to the mate of the differential path along the
total path error. two lines of sight due to atmospheric
The WVRs provide measurements of fluctuations. This is plotted on the hori-
sky brightness in the four filters illustrated The second stage of analysis is to turn zontal axis of the diagrams, and on the
in the lower right plot in Figure 1. As the fluctuations in the observed sky vertical axis we plot the difference in
ALMA WVRs employ a double-sideband brightness into estimates of fluctuation of observations by the WVRs on these two
mixing system, only the average bright- effective path to each of the antennas antennas. What can be seen in Figure 2
ness of the sky at frequencies symmetric in the array. We only consider the fluctua- is that there is a high degree of correla-
around the centre of the line is meas- tions because, as an interferometer, tion between the two quantities, meaning
ured. The maximum readout frequency ALMA is sensitive to only the difference in that as long as we can forecast the slope
from the WVRs is 5 Hz, although normally path errors to each of the antennas of this correlation then we can convert
12 The Messenger 143 – March 2011
13. Figure 2. Correlation
between the atmos-
pheric path error esti-
mated from observa-
tions of bright point-like
objects (horizontal axis)
and the differenced
WVR signal (vertical
axis). Each plot is a two-
∆
∆
dimensional histogram
where the colour scale
shows how many points
fall in each bin. The four
panels correspond to
the four channels of the
radiometers (1–4 desig-
δ δ nated by the axis label).
∆
∆
δ δ
fluctuations of WVR outputs to path fluc- (This programme also supports develop- – The software is easy to distribute as a
tuations for a general observation. ment of Band 5 receivers for ALMA [see binary package that works in conjunc-
Laing et al., 2010], and on-the-fly interfer- tion with CASA.
The final stage of the analysis is to turn ometry techniques).
estimates of path fluctuations into a The software (wvrgcal) for phase cor-
phase correction that needs to be applied The software we have been developing is rection is available freely under the Gnu
to the astronomical data. This is gener- designed primarily for off-line phase cor- Public License in both source code and
ally straightforward, although it is impor- rection, i.e., it operates on the observed binary formats1. We also operate a
tant to take into account the dispersive data after these have been stored on mailing list2 for discussion, improvement
effects of the atmosphere and also to disk. Some of the principal features of our suggestions and community support of
ensure that rotations applied using esti- software are: the software.
mates derived from WVR data interact – It is closely integrated with the official
correctly with other calibrations applied ALMA off-line data reduction suite
to the astronomical data. (CASA), which allows it to be used in a Tests of phase correction
straightforward manner by scientists.
– The software has a rapid development Since about January 2010, ALMA has
Development of phase correction soft- cycle, with new features and improved been collecting significant amounts
ware for ALMA under FP6 algorithms appearing regularly. of test observations designed to measure
– It uses a robust Bayesian statistical the effectiveness of WVR phase correc-
Our recent involvement in WVR phase inference framework to derive optimal tion and to guide the further develop-
correction for ALMA has been primar- corrections. ment of algorithms used to translate sky
ily through development of software and – When certain WVRs are missing from brightness measurements to the phase
algorithms that process the raw data an observation, the software has rotations. In order to fit with the numerous
observed by the WVRs and use these to the ability to interpolate available data other ALMA commissioning activities,
calibrate and correct the astronomical to provide phase correction estimates most of these observations were taken
data. This work is separate from the base- at those antennas lacking accurate with the antennas in relatively compact
line ALMA software and has been funded WVR measurements. configurations, i.e., most data are with
as an ALMA enhancement by the Euro- baselines in range 30–100 m, with some
pean Union Framework Programme 6. data on baselines of up to 600 m. These
The Messenger 143 – March 2011 13
14. Telescopes and Instrumentation Nikolic B. et al., Tests of Radiometric Phase Correction with ALMA
data have already provided a good dem- Figure 3. Path fluctua-
tion estimated from
onstration of effectiveness of phase cor-
WVR data for two ob -
rection on these relatively modest base- serving sessions. Times
lines. However, we know that the phase are expressed in UT,
correction will be most challenging on so the upper panel cor-
responds to night-time,
long baselines (up to 15 km in length for
while the lower panel
ALMA); this is because the root structure to a time around mid-
function of the atmosphere increases as day. Note that the verti-
δ
roughly the 0.6 power of baseline on typi- cal scale is different
between the two panels.
cal ALMA baselines. Long baseline test
data are awaited to investigate the effec-
tiveness of the technique when ALMA is
making its highest resolution images.
Two typical examples of path fluctuations
computed from WVR observations are
shown in Figure 3. For these plots we
have used data from three antennas,
shown by different colours in these plots.
Since these are absolute path estimates
from the WVRs, it is the differences
between the three traces that correspond
δ
to the phase rotations to be applied.
For these observations, the antennas
were relatively close to each other and
therefore these differences are quite
small. These plots illustrate very well the
wide variety of conditions that are pre-
sent at the ALMA site: total fluctuations
are different by about two orders of mag- Figure 4. Test observa-
tion of a sub-mm bright
nitude between the two observations.
quasar on a roughly 650-
It can be seen that the total (peak-to- metre baseline with
peak) fluctuations on the upper panel of ALMA. The red line is the
Figure 3 are about 50 μm on timescales phase (in degrees) of the
observed (complex) visi-
of about five minutes; this is significantly
bility on this baseline —
less than 350 μm, the shortest wave- note that for a quasar (or
length at which ALMA will observe. On other point-like) source at
the lower panel of Figure 3, the fluctua- the tracking centre of the
interferometer we expect
tions are greater than 3.5 mm, i.e, they
a constant phase in time.
are larger than the longest wavelength at The blue line is the visibil-
which ALMA will initially observe. ity phase after correction
of the data based on the
Figures 4 and 5 show two examples WVR signals and using
the wvrgcal program.
of WVR phase correction at work. In both
plots, the red trace represents the phase
of the recorded visibilities while observ- Figure 5. Like Figure 4,
ing a quasar. In the absence of atmos- this is a test observation
of a strong quasar, but
pheric and instrumental phase errors we on a baseline of around
would expect this phase to be constant 60 m and during stable
in time — the variations actually observed weather. The red line is
are due to the combination of atmos- again the uncorrected
observed phase (in
pheric effects and instrumental errors. degrees) of the visibility,
The uncorrected phase in Figure 4 is vary- while the blue line is the
ing by more than 360 degrees, i.e., by phase after WVR-based
a full rotation, which means that in these correction. Note the
change of vertical scale
conditions it would not be possible to between Figure 4 and
make any measurements on faint sources. this figure.
The blue line shows the phase after
correction using our wvrgcal software.
14 The Messenger 143 – March 2011
15. –44°05o00
02
02
04
04
06
J2000 Declination
J2000 Declination
06
08
08
10
10
12
12
14
14
–44°05o00
16
05 38 51 .0
h m s
50 .6 50 .4 50 .2 50 .0
s s s s
49 .8
s
49 .6
s
05 h38 m51s.0 50 s.6 50 s.4 50 s.2 50 s.0 49 s.8 49 s.6
J2000 Right Ascension J2000 Right Ascension
Figure 6. Un-deconvolved images of a quasar (which It can be seen that the fringes in the map to use, so they can automatically remove
is unresolved) with ALMA in a very heterogeneous
made from corrected data (right panel) the distorting effects of the atmosphere
configuration: four of the antennas were very close
together while the fifth was about 650 metres away. are much sharper and have much higher and allow them to focus on the novel sci-
The heterogeneity leads to the rapid modulation contrast compared to the map made ence in their ALMA datasets. Nonethe-
in the north–south direction, which corresponds to from uncorrected data. After deconvolu- less, ALMA already has made great pro-
the long baseline. The image on the panel on the
tion (and completing the baseline cover- gress towards this goal, and can already
left was made with no phase correction while the
image in the panel on the right has had WVR phase age) this increase in sharpness directly claim to have an effective and ground-
correction applied. It can be seen that the phase corresponds to an increase in resolution breaking adaptive optics system.
fluctuations, when uncorrected, lead to an almost and fidelity.
complete wash-out of fringes on the long baseline.
Acknowledgements
Future challenges The results shown in these plots are of course the
The phase errors can be seen to be result of the efforts of many tens, if not hundreds, of
reduced by an order of magnitude, to a The data presented in this article repre- people who have been involved in ALMA over the
level where meaningful averaging of the sent by far the most extensive tests of years. Phase correction tests require everything in
the ALMA system to be working perfectly, so a great
data can be done. the capabilities of 183 GHz phase correc- deal of credit is due to all of those involved, from
tion ever attempted. They demonstrate the designers of the systems to those keeping the
The example shown in Figure 5 is less that the technique should increase signifi- observatory running in Chile. The specific work
extreme — the uncorrected data have cantly the sensitivity of ALMA, by reduc- described here, including the analysis of test data
and development of the wvrgcal program has
a phase root-mean-square deviation ing the decorrelation caused by phase been carried out by the Astrophysics Group at the
of about 20 degrees. However, even in errors, and increase the fidelity of ALMA Cavendish Laboratory, University of Cambridge,
these much more stable conditions, images by ensuring visibility phases are as part of the ALMA Enhancement Programme, an
application of WVR phase correction more accurately measured. In addition, enhancement to the baseline ALMA project. This
work is funded by the European Union’s Sixth
leads to much improved phase stability. they should improve the efficiency of Framework Programme.
Also notable in this example is that ALMA operations, by permitting observa-
variations in uncorrected phase at longer tions to take place when atmospheric
timescales are also very effectively re- instabilities cause rapid large amplitude References
duced by WVR phase correction. phase fluctuations. Evans, N. et al. 2003, Site properties and stringency,
ALMA Memo Series, 471, The ALMA Project
As an illustration of the effect of WVR- However, much work remains to be done. Laing, R. et al. 2010, The Messenger, 141, 41
based phase correction on imaging, It is vital that ALMA can demonstrate Nikolic, B. et al. 2008, The Messenger, 131, 14
in Figure 6 we show an un-deconvolved that its phase correction strategy works
(“dirty”) map of a point source with to specification in a wide range of atmos- Links
ALMA in an unusual configuration with pheric conditions and on baselines all
1
north-south baselines much longer the way out to the maximum allowed by Source code for wvrgcal available at: http://www.
mrao.cam.ac.uk/~bn204/alma/wvrsoft.html
than the others. We have made the map the configuration designs. In addition, 2
Mailing list for wvrgcal updates: https://lists.cam.
both with the raw data, and with the it remains a challenge to ensure that the ac.uk/mailman/listinfo/mrao-wvrgcal
data after WVR-based phase correction. software tools are easy for astronomers
The Messenger 143 – March 2011 15
16. Telescopes and Instrumentation
GRAVITY: Observing the Universe in Motion
Frank Eisenhauer1 Frédéric Chapron 2, 10 GRAVITY is the second generation Very
Guy Perrin 2, 10 Udo Neumann 3 Large Telescope Interferometer instru-
Wolfgang Brandner 3 Leander Mehrgan 9 ment for precision narrow-angle as-
Christian Straubmeier 4 Oliver Hans1 trometry and interferometric imaging.
Karine Perraut 5 Gérard Rousset 2, 10 With its fibrefed integrated optics,
António Amorim 6 Jose Ramos 3 wavefront sensors, fringe tracker, beam
Markus Schöller 9 Marcos Suarez 9 stabilisation and a novel metrology
Stefan Gillessen1 Reinhard Lederer1 concept, GRAVITY will push the sensi-
Pierre Kervella 2, 10 Jean-Michel Reess 2, 10 tivity and accuracy of astrometry and
Myriam Benisty 3 Ralf-Rainer Rohloff 3 interferometric imaging far beyond what
Constanza Araujo-Hauck 4 Pierre Haguenauer 9 is offered today. Providing precision
Laurent Jocou 5 Hendrik Bartko1 astrometry of order 10 microarcseconds,
Jorge Lima 6 Arnaud Sevin 2, 10 and imaging with 4-milliarcsecond
Gerd Jakob 9 Karl Wagner 3 resolution, GRAVITY will revolutionise
Marcus Haug1 Jean-Louis Lizon 9 dynamical measurements of celestial
Yann Clénet 2, 10 Sebastian Rabien1 objects: it will probe physics close to
Thomas Henning 3 Claude Collin 2, 10 the event horizon of the Galactic Centre
Andreas Eckart 4 Gert Finger 9 black hole; unambiguously detect and
Jean-Philippe Berger 5, 9 Richard Davies1 measure the masses of black holes
Paulo Garcia 6 Daniel Rouan 2, 10 in massive star clusters throughout the
Roberto Abuter 9 Markus Wittkowski 9 Milky Way; uncover the details of mass
Stefan Kellner1 Katie Dodds-Eden1 accretion and jets in young stellar
Thibaut Paumard 2, 10 Denis Ziegler 2, 10 objects and active galactic nuclei; and
Stefan Hippler 3 Frédéric Cassaing 7, 10 probe the motion of binary stars, exo-
Sebastian Fischer 4 Henri Bonnet 9 planets and young stellar discs. The
Thibaut Moulin 5 Mark Casali 9 instrument capabilities of GRAVITY are
Jaime Villate 6 Reinhard Genzel1 outlined and the science opportunities
Gerardo Avila 9 Pierre Lena 2 that will open up are summarised.
Alexander Gräter1
Sylvestre Lacour 2, 10
Armin Huber 3 1
Max-Planck Institute for Extraterrestrial Fundamental measurements over a wide
Michael Wiest 4 Physics, Garching, Germany range of fields in astrophysics
Axelle Nolot 5 2
LESIA, Observatoire de Paris, CNRS,
Pedro Carvas 6 UPMC, Université Paris Diderot, Much as long-baseline radio interfer-
Reinhold Dorn 9 Meudon, France ometry has tone, GRAVITY infrared (IR)
Oliver Pfuhl1 3
Max-Planck Institute for Astronomy, astrometry, with an accuracy of order
Eric Gendron 2, 10 Heidelberg, Germany 10 microarcseconds and phase-referenced
Sarah Kendrew 3 4
Physikalisches Institut, University of imaging with 4-milliarcsecond resolution,
Senol Yazici 4 Cologne, Germany will bring a number of key advances
Sonia Anton 6, 8 5
UJF–Grenoble 1/CNRS-INSU, Institut (Eisenhauer et al., 2008). GRAVITY will
Yves Jung 9 de Planétologie et d’Astrophysique de carry out the ultimate empirical test to
Markus Thiel1 Grenoble, France show whether or not the Galactic Centre
Élodie Choquet 2, 10 6
Laboratório de Sistemas, Instrumen- harbours a black hole (BH) of four million
Ralf Klein 3 tação e Modelação em Ciências e solar masses and will finally decide if
Paula Teixeira 6, 9 Tecnologias do Ambiente e do Espaço the near-infrared flares from Sgr A* origi-
Philippe Gitton 9 (SIM), Lisbon and Porto, Portugal nate from individual hot spots close to
David Moch1 7
ONERA, Optics Department (DOTA), the last stable orbit, from statistical fluc-
Frédéric Vincent 2, 10 Châtillon, France tuations in the inner accretion zone or
Natalia Kudryavtseva 3 8
Centro de Investigação em Ciências from a jet. If the current hot-spot interpre-
Stefan Ströbele 9 Geo-Espaciais, Porto, Portugal tation of the near-infrared (NIR) flares
Eckhard Sturm1 9
ESO is correct, GRAVITY has the potential to
Pierre Fédou 2, 10 10
Groupement d’Intérêt Scientifique directly determine the spacetime metric
Rainer Lenzen 3 PHASE (Partenariat Haute résolution around this BH. GRAVITY may even
Paul Jolley 9 Angulaire Sol Espace) between be able to test the theory of general rela-
Clemens Kister1 ONERA, Observatoire de Paris, CNRS tivity in the presently unexplored strong
Vincent Lapeyrère 2, 10 and Université Paris Diderot field limit. GRAVITY will also be able to
Vianak Naranjo 3 unambiguously detect intermediate mass
Christian Lucuix 9 BHs, if they exist. It will dynamically
Reiner Hofmann1 measure the masses of supermassive
16 The Messenger 143 – March 2011

![The Organisation
Adriaan Blaauw, 1914–2010
In the last issue of The Messenger There follow three tributes to Adriaan Pottasch; and by Raymond Wilson, who
(142, p. 51) only a brief obituary of Adriaan Blaauw: by Tim de Zeeuw, current led the Optics Group during his tenure as
Blaauw, the second Director General ESO Director General; by his long-term Director General.
of ESO, could be included at the time of colleague at the Kapteyn Institute, Stuart
going to press.
Tim de Zeeuw1 but moved to Yerkes Observatory in
ESO [M]
1953, becoming its associate director in
1956, and moved back to Groningen
1
ESO in 1957, where he was in a key position to
contribute to transforming the idea of
Baade and Oort into reality. He was Sec-
Professor Adriaan Blaauw, ESO’s sec- retary of the ESO Committee (the proto-
ond Director General and one of the Council) from 1959 through 1963, a
most influential astronomers of the twen- period which included the signing of the
tieth century, passed away on 1 Decem- ESO Convention on 5 October 1962.
ber 2010. Blaauw became ESO’s Scientific Director
in 1968. In this position he also pro-
Adriaan Blaauw was born in Amsterdam, vided the decisive push which led to the
the Netherlands, on 12 April 1914. He creation of Astronomy and Astrophysics,
studied astronomy at Leiden University, which successfully combined and
under de Sitter, Hertzsprung and Oort, replaced the various individual national
and obtained his doctorate (cum laude) journals for astronomy, and today is
with van Rhijn at the Kapteyn Laboratory one of the leading astronomy research
in Groningen in 1946. His PhD thesis publications in the world. The article
was entitled “A study of the Scorpio– by Pottasch (1994) and the following trib-
Centaurus Cluster”. During his career, ute provide further details of Blaauw’s
Blaauw became renowned for his ground- creative leadership in the founding of the
breaking studies of the properties of European astronomical journal.
OB associations (groups of young, hot
stars) which contain the fossil imprint Blaauw was Director General from 1970 Figure 1. Adriaan Blaauw in 1973 while Director Gen-
through 1974. During this period several eral of ESO. From a photograph taken during a con-
of their star formation history. Perhaps his
tract-signing ceremony for building works at La Silla.
most famous work explained why some telescopes, including the ESO 0.5-metre
OB stars are found in isolation travelling and 1-metre Schmidt telescopes, began
at unusually high velocity: the so-called operating at ESO’s first observatory The Messenger may serve to give the
“run-away stars”. Blaauw proposed in site, La Silla, in Chile, and much work world outside some impression of what
1961 that these stars had originally been was done on the design and construction happens inside ESO.” The continuing
members of binary systems, and when of the ESO 3.6-metre telescope, which popularity of The Messenger is a testi-
one star in the binary experiences a had its first light in 1976. Blaauw decided mony to Blaauw’s foresight.
supernova explosion, its companion sud- that it was crucial for this project to move
denly ceases to feel the gravitational ESO’s Headquarters and the Technical After stepping down as Director General
pull that keeps it in its orbit and hence it Department from Hamburg to Geneva, to of ESO, Blaauw returned to Leiden,
“runs away” at its orbital velocity. benefit from the presence of the experi- where I had the privilege to be amongst
enced CERN engineering group. He also his students. He continued to play a
In addition to his distinguished research oversaw the development of the Proto- very important role in international astron-
career, Blaauw played a central role in col for Privileges and Immunities that is omy. He was President of the Interna-
the creation of ESO. In 1953, Baade and critical for ESO’s functioning. In May tional Astronomical Union from 1976 to
Oort proposed the idea of combining 1974 he launched The Messenger with 1979, during which period he used his
European resources to create an astro- the stated goal: “to promote the partici- considerable diplomatic skills to convince
nomical research organisation that pation of ESO staff in what goes on in China to rejoin the IAU. From 1979 to
could compete in the international arena. the organisation, especially at places of 1982 he served on the ESO Council on
Blaauw had returned to Leiden in 1948, duty other than our own. Moreover, behalf of the Netherlands. He retired from
2 The Messenger 143 – March 2011](data:image/gif;base64,R0lGODlhAQABAIAAAAAAAP///yH5BAEAAAAALAAAAAABAAEAAAIBRAA7)