Ultraviolet morphology and_unobscured_uv_star_formation_rates_of_clash_brighest_cluster_galaxies

Os astrônomos descobriram um processo único sobre como as maiores galáxias elípticas do universo continuam gerando estrelas muito tempo depois do anos de pico de nascimentos estelares. A alta resolução e a sensibilidade à radiação ultravioleta do Hubble, permitiu aos astrônomos observarem nós brilhantes de estrelas azuis, quentes, se formando juntamente com jatos de buracos negros ativos encontrados nos centros das gigantescas galáxias elípticas. Combinando dados do Huubble com observações feitas por um conjunto de telescópios baseados tanto em Terra como no espaço, duas equipes independentes descobriram que os jatos dos buracos negros, e as estrelas recém-nascidas são todos partes de um ciclo auto-regulado. Jatos de alta energia atirados do buraco negro aquecem um halo de gás circulante, controlando a taxa com a qual o gás esfria e cai na galáxia. “Pense no gás ao redor da galáxia como uma atmosfera”, explicou o líder do primeiro estudo, Megan Donahue, da Universidade Estadual do Michigan. “Essa atmosfera pode conter material em diferentes estados, do mesmo modo que a nossa atmosfera tem gás, nuvens e chuva. O que nós estamos vendo é um processo parecido com uma tempestade. À medida que os jatos impulsionam o gás para fora do centro da galáxia, parte do gás esfria e precipita em aglomerados frios que caem de volta para o centro da galáxia como gotas de chuvas”. “As gotas de chuva eventualmente esfriam o suficiente para tornar-se nuvens de formação de estrelas de gás frio molecular, e a capacidade de observar no ultravioleta distante do Hubble, nos permitiu observar diretamente esses chuviscos de formação de estrelas”, explicou o líder do segundo estudo, Grant Tremblay, da Universidade de Yale. “Nós sabemos que esses chuviscos estão linkados com os jatos, pois eles foram encontrados em filamentos que se dobram ao redor dos jatos, ou abraçam as bordas de bolhas gigantes que os jatos inflaram”, disse Tremblay. “E eles terminam fazendo um redemoinho de gás de formação de estrelas ao redor do buraco negro central”.

Recommandé
Recommandé
Contenu connexe
Tendances
Tendances (20)
En vedette
En vedette (16)
Similaire à Ultraviolet morphology and_unobscured_uv_star_formation_rates_of_clash_brighest_cluster_galaxies
Similaire à Ultraviolet morphology and_unobscured_uv_star_formation_rates_of_clash_brighest_cluster_galaxies (20)
Plus de Sérgio Sacani
Plus de Sérgio Sacani (20)
Dernier
Dernier (20)
Ultraviolet morphology and_unobscured_uv_star_formation_rates_of_clash_brighest_cluster_galaxies
- 1. ULTRAVIOLET MORPHOLOGY AND UNOBSCURED UV STAR FORMATION RATES OF CLASH BRIGHTEST CLUSTER GALAXIES Megan Donahue1 , Thomas Connor1 , Kevin Fogarty2 , Yuan Li3 , G. Mark Voit1 , Marc Postman2 , Anton Koekemoer2 , John Moustakas4 , Larry Bradley2 , and Holland Ford5 1 Physics and Astronomy Dept., Michigan State University, East Lansing, MI 48824, USA; donahue@pa.msu.edu 2 Space Telescope Science Institute, 3700 San Martin Drive, Baltimore, MD 21218, USA 3 Astronomy Dept., University of Michigan, Ann Arbor, MI, USA 4 Dept of Physics and Astronomy, Siena College, Loudonville, NY USA 5 Dept of Physics and Astronomy, The Johns Hopkins University, Baltimore, MD 21218, USA Received 2015 February 11; accepted 2015 April 2; published 2015 June 2 ABSTRACT Brightest cluster galaxies (BCGs) are usually quiescent, but many exhibit star formation. Here we exploit the opportunity provided by rest-frame UV imaging of galaxy clusters in the Cluster Lensing and Supernovae with Hubble (CLASH) Multi-Cycle Treasury Project to reveal the diversity of UV morphologies in BCGs and to compare them with recent simulations of the cool, star-forming gas structures produced by precipitation-driven feedback. All of the CLASH BCGs are detected in the rest-frame UV (280 nm), regardless of their star formation activity, because evolved stellar populations produce a modest amount of UV light that traces the relatively smooth, symmetric, and centrally peaked stellar distribution seen in the near infrared. Ultraviolet morphologies among the BCGs with strong UV excesses exhibit distinctive knots, multiple elongated clumps, and extended filaments of emission that distinctly differ from the smooth profiles of the UV-quiet BCGs. These structures, which are similar to those seen in the few star-forming BCGs observed in the UV at low redshift, are suggestive of bi- polar streams of clumpy star formation, but not of spiral arms or large, kiloparsec-scale disks. Based on the number of streams and lack of culprit companion galaxies, these streams are unlikely to have arisen from multiple collisions with gas-rich galaxies. These star-forming UV structures are morphologically similar to the cold-gas structures produced in simulations of precipitation-driven active galactic nucleus feedback in which jets uplift low- entropy gas to greater altitudes, causing it to condense. Unobscured star formation rates estimated from CLASH UV images using the Kennicutt relation range up to 80 M yr 1 ⊙ − in the most extended and highly structured systems. The circumgalactic gas-entropy threshold for star formation in CLASH BCGs at z ∼ 0.2–0.5 is indistinguishable from that for clusters at z 0.2< . Key words: galaxies: clusters: intracluster medium – galaxies: elliptical and lenticular, cD – galaxies: formation – galaxies: structure – ultraviolet: galaxies 1. INTRODUCTION The brightest cluster galaxy (BCG) is likely to be the dominant galaxy associated with a cluster of galaxies. As such, it is often but not always found near the bottom of the cluster’s gravitational potential well (e.g., Lauer et al. 2014) and experiences a formation and interaction history unique to its special position in the hierarchy of galaxies (De Lucia & Blaizot 2007). Many BCGs exhibit colors and light profiles similar to those of quiescent elliptical galaxies, but a significant fraction have extremely extended halos, with Sérsic indices (Sérsic 1968) trending closer to n 10∼ than to the canonical n = 4 expected for elliptical galaxies (Caon et al. 1993). The unique features and relative rarity of BCGs in typical galaxy samples have arguably led to some neglect in studies of galaxy evolution. However, they provide an excellent oppor- tunity to study the relationships between star formation, the circumgalactic medium (CGM), and feedback from a central active galactic nucleus (AGN). Baryons in the CGM are the probable gas supply for star formation in galaxies and possibly also for supermassive black-hole growth. Around BCGs the CGM is hot enough to study in detail with X-ray observations, whereas the cooler CGM of less massive galaxies is probed only sparsely with UV and optical absorption-line studies along lines of sight to bright quasars (e.g., Steidel et al. 1994; Tumlinson et al. 2013; Werk et al. 2014). Multi-wavelength observational programs have shown that many BCGs are not quiescent systems and exhibit activity such as radio emission ( 1023 > W Hz−1 ) (Burns 1990), extended (∼10 kpc) emission-line nebulae (Hu et al. 1985; Heckman et al. 1989), significant excess blue or UV light (Cardiel et al. 1998; Rafferty et al. 2008a; Donahue et al. 2010), far- infrared emission from warm dust and PAHs (Quillen et al. 2008; Donahue et al. 2011), and vibrationally excited molecular hydrogen (Donahue et al. 2000). This enhanced activity in the BCG is strongly correlated with the thermo- dynamic state of the hot CGM surrounding the BCG (e.g., Cavagnolo et al. 2008; Rafferty et al. 2008a; Cavagnolo et al. 2009; Sun 2009). In rich clusters of galaxies, all such active BCGs are embedded in cores or coronae of dense, low- entropy, high-pressure gas, commonly called “cool cores” and formerly known as “cooling flows” (Donahue & Voit 2004). The radiative cooling time of the hot gas surrounding active BCGs is typically 1≲ Gyr. While 10%–30% of BCGs in optically selected samples exhibit either radio-loud AGN or star formation activity or both (e.g., Edwards et al. 2007; von der Linden et al. 2007), the fraction rises to 70%> in the local sample of X-ray selected clusters (Crawford et al. 1999) and in a representative sample of X-ray clusters (Donahue et al. 2010). Some of these BCGs have among the highest star formation rate (SFRs) in the The Astrophysical Journal, 805:177 (14pp), 2015 June 1 doi:10.1088/0004-637X/805/2/177 © 2015. The American Astronomical Society. All rights reserved. 1
- 2. z 0.6< universe (e.g., McNamara et al. 2006; McDonald et al. 2013). The relationships observed between molecular gas content and SFRs in star-forming BCGs are remarkably similar to those observed in star-forming galaxies and starbursts. Molecular gas “depletion times” based on molecular hydrogen (H2) masses derived from CO line luminosities (Edge 2001) and SFRs derived from far-IR (FIR) emission are 109 ∼ years for both star-forming galaxies and BCGs with SFRs of a few solar masses per year, and drop to ∼107 –108 years for both starburst galaxies and BCGs with SFRs of tens or more solar masses per year (O’Dea et al. 2008; Voit & Donahue 2011). One hypothesis for the link between low-entropy CGM and activity in the BCG is that the lowest entropy gas in the CGM cools and provides cold gas to fuel both star formation and the AGN. A long-standing mystery is that unmoderated radiative cooling of the intracluster medium (ICM) would produce SFRs at least an order of magnitude higher than observed (e.g., Fabian et al. 1991), hence the “cooling flow” problem. Spectroscopic evidence from the XMM-Newton grating spectro- meter conclusively demonstrated that the ICM is not radiatively cooling from X-ray emitting temperatures (Peterson et al. 2003), leading most to assume that some kind of heating process involving the AGN nearly balances radiative cooling (McNamara & Nulsen 2007, 2012). A second mystery is that, despite the strong correlation between low-entropy hot gas and cold, molecular, star-forming gas, it is not at all clear how hot, dust-free, X-ray emitting gas becomes dusty, cold molecular gas (Voit & Donahue 2011). Observations of BCGs and the surrounding CGM suggest that the relationships between the AGN, its kinetic energy output, the BCG’s star formation activity, and the thermo- dynamic state of the intergalactic gas must be fairly cozy. Simulations of the broader population of galaxies indicate that star formation in the most massive galaxies must somehow be quenched by AGN feedback, because without it massive galaxies are not only much more luminous than galaxies we see today, but bluer as well, owing to high levels of continuous star formation (e.g., Saro et al. 2006). This problem is rectified in simulations that incorporate AGN feedback, indicating that AGNs are the likely culprits quenching continuous star formation in massive galaxies. The phenomena we observe in cool-core BCGs are likely to be signposts of AGN feedback in action. These AGNs do not eliminate star formation, but are energetically capable of preventing the extreme star formation that would ensue if the ICM were allowed to cool unabated into molecular clouds (e.g., Fabjan et al. 2010; Dubois et al. 2013; Ragone-Figueroa et al. 2013; Martizzi et al. 2014). We and others have recently proposed a framework for precipitation-driven AGN feedback that account for these tight relationships (e.g., Gaspari et al. 2012; McCourt et al. 2012; Sharma et al. 2012; Voit & Donahue 2015; Voit et al. 2015). In this framework, radiative cooling of thermally unstable gas causes condensation and precipitation of cool clouds out of the hot CGM, which then feed star formation and fuel growth of the central supermassive black hole. The criterion for precipitation, indicated by numerical simulations of feedback and radiative cooling in a spherical geometry is for the cooling time to be shorter than about 10 times the free-fall time. In the highest mass galaxies, precipitation causes a jump in jet power from the AGN, which subsequently limits cooling. The jets are also important for lifting low-entropy gas from the BCG’s center out to larger radii where it becomes unstable to condensation and creates filaments and knots of cooler gas. If dust grains released by the BCG’s old stellar population can survive until they are uplifted and incorporated into the condensing gas, then they can help to promote cooling and can also serve as nucleation sites for converting a greater proportion of refractory elements into solid form. Numerical simulations have begun to reproduce observable features of this physical model (e.g. Li & Bryan 2014a, 2014b). Here we present UV images from the Hubble Space Telescope Multi-Cycle Treasury program Cluster Lensing and Supernovae with Hubble (CLASH) (Postman et al. 2012b) that illustrate the most recent locations of star formation in active BCGs. Very few high-resolution UV images exist for BCGs, and the handful available at z 0.3< have revealed filamentary, clumpy structures (Koekemoer et al. 1999; O’Dea et al. 2004, 2010; Hicks et al. 2010; Oonk et al. 2011). CLASH has substantially boosted the scant high-resolution UV coverage of BCGs by collecting high-quality images of 25 clusters of galaxies at z0.2 0.9< < through 16 filters spanning the ultraviolet to the near-infrared. The rest-frame UV images of these galaxy clusters have no precedent in sensitivity or spatial resolution at similar redshifts. We briefly describe the CLASH cluster sample in Section 2. We describe the data analysis of the UV images for the 25 CLASH BCGs, estimate unobscured UV SFRs, and analyze UV morphology in Section 3. We discuss these results and compare the UV morphologies to simulations of star formation in central cluster galaxies experiencing AGN-jet feedback in Section 4. We summarize our results in Section 5. Throughout this paper we assume cosmological parameters of Ω 0.3M = , Ω 0.7=Λ , and H h700 70= km s−1 Mpc−1 . 2. CLASH The CLASH Multi-Cycle Treasure (MCT) program (Post- man et al. 2012b) utilized 525 orbits (over ∼500 hr of observing time) from 2011–2013 (Hubble Space Telescope (HST) Proposal ID 12456). The sample includes 25 clusters of galaxies with z = 0.2–0.9 and global X-ray temperatures greater than 5–6 keV. These clusters, 20 were chosen to be examples of relaxed, massive systems, characterized by regular X-ray morphology on radial scales greater than a few hundred kpc, with BCGs that are well-centered and aligned with the X- ray centroids. A significant number of these clusters were included in the Mantz et al. (2008) study of relaxed X-ray systems. The remaining five clusters were added to the sample because of their lensing properties and ability to magnify the high-redshift universe (Zheng et al. 2012; Coe et al. 2013). All of the CLASH clusters have Chandra observations, and 15 were also observed with XMM (Donahue et al. 2014). One of the unprecedented features of the CLASH study was its use of 16 broadband filters, spanning UV to near-IR (NIR) wavelengths. The motivation for this broad coverage was to significantly improve the photometric redshift estimates of lensed galaxies, but a side benefit is that the cores of these clusters received UV exposure otherwise rather difficult to obtain. Only a few of the CLASH BCGs had published UV observations prior to CLASH. A383, m1115, r2129, and ms2137 have GALEX- based SFR upper limits of <2–3 M yr 1 ⊙ − . Only one, m1720, had a published estimate of its UV SFR ( M2.7 0.7 yr 1 ± ⊙ − ; Hoffer et al. 2012). These UV images provide our first high resolution view of a sample of BCGs in massive clusters at moderate redshifts, but 2 The Astrophysical Journal, 805:177 (14pp), 2015 June 1 Donahue et al.
- 3. many of them have been the subject of studies at other wavelengths, only a few of which we have space to mention here. Several of the BCGs are known to be mid-IR sources of dust emission, some of which can be produced by radiative heating of dust by light from evolved stars, and some show clear evidence for recent star formation. Four CLASH BCGs have mid-IR detections with Spitzer (a209, A383, ms2137, r2248, and r1532), and there are mid-IR upper limits for several more (c1226, A2261, and r2129). The most extreme star- forming system known in CLASH prior to this study was r1532, with a Spitzer-based SFR of M110 yr 1 ⊙ − (Hoffer et al. 2012). The most extreme AGN-influenced BCG is arguably m1931 (Ehlert et al. 2011). Uniformly derived profiles of temperature, ICM electron density, gas entropy, gas mass, and total mass based on analysis of the pressure profiles are provided in Donahue et al. (2014) for all 25 of the CLASH clusters. Gravitational lensing profiles for a significant fraction of the CLASH sample are published (Merten et al. 2014; Umetsu et al. 2014; Zitrin et al. 2015). All of these sources have either upper limits or detections from radio surveys, which we will discuss in Section 4.3. 3. CLASH OBSERVATIONS The CLASH clusters, mean redshifts, observation dates, and filter names are given in Table 1. Filter names are provided using the convention that an HST filter named FnnnW is listed as “nnn” in the table. For HST, the filters shortward of 1 micron are named for the approximate central wavelength of the filter in nanometers; filters longward of 1 micron (which we call infrared or IR for short) are named for this wavelength in units of 10 nm (so 1.6 micron would correspond to 160 on this scale). 3.1. HST Data Reduction and Photometry The HST Advanced Camera for Surveys (ACS) and WFC3 imaging data for these clusters were processed through initial detector-level calibration to remove instrumental signatures from each exposure. Exposures in all filters were subsequently aligned onto a uniform astrometric grid to an accuracy better than ∼2–3 mas, passed through cosmic-ray and bad-pixel rejection, and combined into final mosaics for each filter at pixel scales of 30 and 65 mas. All of this was done using a modified version of the MosaicDrizzle pipeline (Koekemoer et al. 2011, 2002). Further details are presented in the CLASH overview paper (Postman et al. 2012b). We used mosaics binned to 65 mas per pixel for this study. For the WFC3 UV images, later versions of our mosaics were significantly improved over the first version of publicly available mosaics because of better flat-fielding and sky treatment. For the sake of reproducibility, we provide the mosaic production date in Table 1. Rest-frame UV was defined to be 280 nm in the rest-frame of the BCG. At this wavelength, the UV from recently formed hot stars, if present, readily exceeds the light emitted by older stars. At shorter wavelengths, the relative contribution of “UV- upturn” stars increases below 250 nm (e.g., Brown 2004) with considerable variation from one galaxy to the next, even in a sample of quiesent ellipticals (e.g., Rich et al. 2005; Atlee Table 1 HST Observations and Processing Dates Full Name Cluster z ObsDate (UV) ProcDate UVa texp NIRa texp ObsDate (NIR) AUV ANIR (s) (s) mag mag Abell 1423 A1423 0.213 12/28/12 2/27/13 336 4890 125 2514 12/31/12 0.085 0.014 Abell 209 A209 0.206 9/9/12 1/19/13 336 4752 125 2514 8/12/12 0.086 0.014 Abell 2261 A2261 0.224 4/3/11 1/23/13 336 4817 125 2514 3/9/11 0.193 0.031 Abell 383 A383 0.187 12/28/10 7/2/11 336 4868 125 3320 1/5/11 0.14 0.023 Abell 611 A611 0.288 3/1/12 6/18/12 336 4782 125 2514 1/28/12 0.255 0.042 WARP 1226.9+3332 c1226 0.890 5/24/13 6/26/13 475 4396 160 5129 5/9/13 0.063 0.014 MACSJ0329.6–0211 m0329 0.450 9/26/11 11/5/11 390 4902 160 5029 8/18/11 0.235 0.031 MACSJ0416.1–2403 m0416 0.395 8/18/12 1/19/13 390 4814 160 5029 7/24/12 0.16 0.021 MACSJ0429.6–0253 m0429 0.399 12/11/12 2/27/13 390 4562 140 2312 12/5/12 0.235 0.037 MACSJ0647.8+7015 m0647 0.584 11/16/11 12/2/11 435 4248 160 5229 10/22/11 0.402 0.057 MACSJ0717+3745 m0717 0.548 10/29/11 12/30/11 435 4052 160 5029 10/10/11 0.277 0.039 MACSJ0744.9+3927 m0744 0.686 11/17/11 12/30/11 475 4022 160 5029 10/29/11 0.189 0.03 MACSJ1115.8+0129 m1115 0.355 1/31/12 3/5/12 390 4554 140 2012 1/7/12 0.151 0.024 MACSJ1149.6+2223 m1149 0.544 2/13/11 3/14/11 435 3976 160 5029 1/16/11 0.083 0.012 MACSJ1206.2–0847 m1206 0.439 5/25/11 8/15/11 390 4959 160 5029 1/16/11 0.246 0.032 MACSJ1311.0–0311 m1311 0.494 6/12/13 7/9/13 435 4172 160 2011 4/22/13 0.112 0.016 MACSJ1423.8+2404 m1423 0.545 2/5/13 3/13/13 435 4196 160 5029 1/19/13 0.099 0.014 MACSJ1720.2+3536 m1720 0.387 5/22/12 6/28/12 390 4810 140 2312 5/9/12 0.147 0.023 MACSJ1931.8–2635 m1931 0.352 5/28/12 6/28/12 390 4620 140 2312 4/14/12 0.431 0.068 MACSJ2129–0741 m2129 0.570 6/24/11 1/22/12 435 3728 160 5029 5/15/11 0.273 0.039 MS 2137.3–2353 ms2137 0.313 9/29/11 1/21/13 390 4827 140 2312 9/9/11 0.198 0.031 RXJ1347.5–1145 r1347 0.451 6/22/11 8/12/11 390 4820 160 7741 5/21/10 0.241 0.032 MACSJ1532.8+3021 r1532 0.363b 3/29/12 4/16/12 390 4840 140 2312 3/16/12 0.115 0.018 RXJ2129.6+0005 r2129 0.234 5/31/12 10/16/12 336 4574 125 3420 4/3/12 0.18 0.029 ABELL S1063 r2248 0.348 9/24/12 1/19/13 390 4740 140 2312 9/12/12 0.048 0.007 Notes. a Filter names are listed here in a compressed format, such that nnn represents filter FnnnW for the ACS or WF3. b Redshift of this cluster and its BCG is based on the SDSS emission-line spectrum of the BCG. 3 The Astrophysical Journal, 805:177 (14pp), 2015 June 1 Donahue et al.
- 4. et al. 2009). To allow an estimate of the level of the evolved stellar population, we chose the image obtained at a rest wavelength of ∼1 micron, chosen because 1 micron is approximately the peak of the stellar-light spectrum for passive galaxies and evolved stars. For the highest redshift CLASH clusters, c1226 and m0744, that wavelength was not in the CLASH coverage, so the NIR photometry is based on the reddest bandpass available (F160W). Resolved dust maps, emission-line maps, and optical long-slit spectroscopy will be presented in a future work (K. Fogarty et al. 2015, in preparation) For accurate color photometry, the UV images were degraded with a Gaussian kernel to match the PSF in the NIR prior to photometry measurements. We measured the total UV emission from each BCG using the IRAF 2.15.1a package apphot within a circular aperture centered on the BCG,6 with coordinates and radii listed in Table 2. For BCGs with structures visible in the UV, the aperture size was chosen to provide an estimate of the total amount of UV light from the highest surface brightness structures in the BCG. If the field was uncrowded and the UV source centrally concentrated and extended, a default aperture of 14 kpc (equal to h10 −1 kpc) was chosen to estimate the color of quiescent BCGs. However, this aperture size was reduced in crowded fields to avoid including light from neighboring galaxies, or in the case of m1149, a prominent and extended lensed star-forming background galaxy. UV and 1.0 micron photometry are based on identical apertures for the same galaxy. To investigate the effects of large-scale scattered light, we obtained UV background measurements in annuli of multiple sizes surrounding the aperture. Robust UV photometry measurements are optimized with an inner radius for the background annulus of about 15″, although the result is fairly insensitive to choices smaller and larger than this. We further investigated background systematics by randomly moving the aperture/annulus combination for each cluster, avoiding sources of obvious emission or scattered light. We then performed aperture photometry on these blank pieces of sky in the same manner as on the BCG. From these measurements, we found the standard deviation in flux, using a 3-σ cut to exclude possibly real but low-flux UV sources. We use this standard deviation as the systematic uncertainty in our photometric Table 2 UV and NIR Photometry Cluster Radius Radius UV (AB) ± UV-IR ± Log LUV SFR SFR SFR K0 c (arcseconds) (kpc) (mag) (mag) (mag) (mag ) (erg s−1 Hz−1 ) (M⊙ yr−1 ) (corr) (err) (keV cm2 ) m1931 5.75 28.5 18.52 0.03 2.04 0.04 29.77 83.08 78.12 2.34 14 ± 4 r1532 7.02 35.5 19.18 0.03 2.83 0.04 29.54 48.62 42.61 2.64 17 ± 2 m0329 3.25 18.7 20.22 0.02 3.3 0.03 29.35 30.99 25.08 2.39 11 ± 3 m0429 3.90 20.9 20.38 0.04 3.75 0.05 29.16 20.11 14.31 2.07 17 ± 4 m1423 1.20 7.7 21.39 0.01 3.14 0.02 29.08 16.70 13.95 1.15 10 ± 5 r1347 2.50 14.4 20.91 0.02 3.81 0.03 29.07 16.50 11.47 1.75 12 ± 20 m1115 1.53 7.6 21.33 0.01 3.38 0.02 28.66 6.37 5.06 0.52 15 ± 3 ms2137 1.56 7.2 21.16 0.02 4.07 0.03 28.60 5.56 3.41 0.66 15 ± 2 m1720 2.70 14.2 21.6 0.05 4.54 0.05 28.64 6.08 2.45 0.74 24 ± 3 A383 2.30 7.2 20.46 0.03 4.36 0.04 28.37 3.29 1.63 0.41 13 ± 2 r2129 3.80 14.2 21.16 0.09 4.98 0.09 28.31 2.86 L <0.4 21 ± 4 m0744 2.00 14.2 22.73 0.13 4.6 0.13 28.78 8.50 L <3.1 42 ± 11 m1311 2.41 14.6 22.29 0.14 4.69 0.14 28.61 5.75 L <1.9 47 ± 4 A2261 3.93 14.2 20.9 0.06 5.47 0.07 28.37 3.29 L <2.8 61 ± 8 m1206 2.50 14.2 21.81 0.04 4.47 0.05 28.68 6.75 L <3a 69 ± 10 A1423 4.10 14.2 21.22 0.13 4.96 0.13 28.19 2.19 L <0.4 68 ± 13 a209 2.50 8.5 21.79 0.11 5.48 0.11 27.93 1.20 L <1.1 106 ± 27 A611 1.69 7.3 22.93 0.13 5.69 0.14 27.81 0.90 L <1.7 125 ± 18 c1226 0.78 6.1 24.68 0.17 5.37 0.17 28.28 2.67 L <1.5 166 ± 45 r2248 1.24 6.1 22.39 0.04 4.91 0.04 28.21 2.29 L <0.5 170 ± 20 m0416 2.60 13.9 22.26 0.09 5.24 0.10 28.39 3.48 L <0.8 400 ± 100 m0647 1.11 7.3 23.8 0.29 5.19 0.29 28.19 2.14 L <0.3 225 ± 50 m0717b 1.95 12.5 22.63 0.15 4.85 0.15 28.59 5.40 L <1.4 220 ± 96 m1149 1.11 7.0 23.63 0.15 4.73 0.15 28.18 2.11 L <0.7a 280 ± 40 m2129 1.10 7.2 24.03 0.22 5.07 0.22 28.07 1.64 L <0.1 200 ± 100 Notes. The CLASH clusters with K 300 < keV cm2 are in the top section, ordered by estimated UV SFR, from large to small. The next section are clusters with K 300 > keV cm2 , ordered by estimated core entropy K0. The bottom section lists the five high magnification clusters from CLASH, in order of right ascension. All of the information in this table is from this work except for the K0 estimates, which are primarily from ACCEPT (Cavagnolo et al. 2009), except for m0416 and m2129 (Donahue et al. 2014). a The clusters m1206 and m1149 both have known lensed background systems that contaminate the UV images of their BCGs. The upper limit on excess UV in m1206 associated with star formation or other BCG activity is set equivalent to the level of detected excess, while the aperture used for m1149 avoids the lensed galaxy. b The cluster m0717 does not have a prominent BCG or even a double BCG. We have identified a bright candidate BCG with a spectroscopic redshift consistent with being a cluster member, as discussed in the text. Coordinates for all BCGs, along with GALEX photometry for comparison, are provided in Table 4. c The estimated central entropies K T nX e0 2 3 = in units of keV cm2 are from ACCEPT (Cavagnolo et al. 2009). For the non-ACCEPT cluster m0416, the K0 is based on electron density and temperature profiles from the X-ray analysis described in Donahue et al. (2014). M0416 is an interacting cluster, so the high gas entropy in the center is not surprising. 6 http://iraf.noao.edu 4 The Astrophysical Journal, 805:177 (14pp), 2015 June 1 Donahue et al.
- 5. measurements resulting from scattered light in the field and other flat fielding issues. The NIR sky background was estimated in an aperture well outside the brightest part of the BCG to give our best estimate of the ambient sky. The background sky levels were based on a median estimate with 3σ clipping. After aperture fluxes were converted to AB magnitudes using the ACS and WFC3 zeropoints,7 all photometry was corrected for Galactic extinc- tion at the observed bandpass (Table 1), ranging from 0.08–0.45 mag in the UV and <0.01–0.07 mag in the NIR, using HST bandpass-specific extinction corrections assuming RV = 3.1 and based on (Fitzpatrick 1999)based on Schlafly & Finkbeiner (2011), which is a recalibration of Schlegel et al. (1998), and. We estimated K-corrections based on the assumption that the NIR spectrum is dominated by a 10 Gyr old stellar population, which was modeled with HST bandpasses convolved with Starburst99 models (Leitherer et al. 1999). The estimated K-correction is less than 0.1 magnitudes for all the clusters and does not affect our results in an interesting way. We did not attempt to homogenize the UV photometry for small offsets from the nominal rest-frame wavelength of 280 nm, since the UV light from a population of hot stars is nearly flat in Fν. We verified this assumption by comparing the 280 nm rest-frame photometry with bluer data, when available. Statistical errors for both UV and NIR were computed by apphot based on counting statistics, obtained by setting the appropriate electron-to-count-rate ratio equal to the effective gain, and the standard deviation in the background annuli. (The mosaics in the CLASH pipeline have the units of electrons s−1 , so to compute the appropriate counting statistics for a given mosaic, the gain parameter in the apphot task was set to the exposure time.) Because the galaxies are so bright in the NIR in the aperture of interest, the exact NIR background and its uncertainty are negligible for this work. Systematic and statistical flux errors were added in quadrature to estimate the 1σ uncertainties given in Table 2. Color uncertainties include an estimated calibration uncertainty of 2%, to account for uncertainties in absolute calibration, relative calibration between the two filters, and the unknown underlying spectral shape compared to that assumed to estimate the AB magnitude at a given wavelength. 3.2. UV Star Formation Rates In order to estimate the UV light from recent star formation, we first need to account for the UV light contributed by the evolved stellar population. For this purpose, we use the quiescent BCGs as templates. The fact that the BCGs are at different redshifts introduces some scatter into our estimate, but not enough to affect these estimates significantly. This method has the advantage of obtaining the UV contribution from evolved stars from an otherwise similar population of galaxies: the BCG population itself. The UV–NIR colors of quiescent BCGs are fairly well behaved within the CLASH sample. We find an average 280–1000 micron color of 5.13 ± 0.35 (omitting m1206 because of contamination by a lensed galaxy). This is consistent with the mean and dispersion of quiescent BCGs in other studies, and a baseline (established by the three reddest BCGs) of 5.5 ± 0.5. In Hoffer et al. (2012) we found that the typical UV–K color of relatively nearby, quiescent BCGs was 6.6 ± 0.3, and typical J–K colors are ∼1. The BCGs with the faintest inferred UV luminosities also have the reddest UV–1.0 micron colors of ∼5–6, consistent with UV–NIR estimates from Hoffer et al. (2012), Hicks et al. (2010), Donahue et al. (2010). We use the average color to correct for the UV produced by the evolved stars in the BCG. Using a redder color would increase our SFR estimates most significantly for the BCGs with the lowest rates. We convert excess UV luminosity to an approximate SFR using the UV conversion from Kennicutt (1998). We note that the Kennicutt SFR conversion is based on the Salpeter (1955) initial mass function (IMF) and the assumption of a nearly constant SFR over the last 100 million years or so. There may be differences in the low-mass end of the IMF between BCGs and the star-forming galaxies studied by Kennicutt (see e.g., van Dokkum & Conroy 2010), but for our purposes here the relative SF rates are more relevant than the absolute rates. For the BCGs which may be relatively young starbursts, these estimated UV rates underestimate the unabsorbed SFR. We have not attempted to estimate the star formation that is obscured by dust clouds, but typically, mid-IR based SFR are similar to or larger than the unobscured SFRs (e.g., Hoffer et al. 2012). We find that of the 25 CLASH clusters, 7 exhibit unambiguous UV excesses, corresponding to unabsorbed SFRs of 5–80 solar masses per year (m1931, r1532, m0329, m0429, m1423, r1347, m1115). If we adopt a detection threshold of three sigma, three other clusters exhibit UV excesses possibly associated with star formation (A383, m1720, and ms 2137). Of these three, only ms 2137 fails to show morphological evidence for a young stellar population clearly distinct from the evolved stellar population and could contain a low-luminos- ity AGN. Four of the CLASH BCGs have Herschel mid-IR detections from Rawle et al. (2012), from which they derive SFRs of 46 ± 3, 4 0.2± , 1.6 ± 0.1, and 1.7 ± 0.1 M⊙ yr−1 for m1423, A383, r1720, and r2129, respectively. These quantities are quite similar to our UV estimates and limits. We did not detect excess UV emission from r2129, but distinguishing between excess UV from young stars and the UV emission from an evolved population becomes difficult with photometry alone at M1∼ ⊙ yr−1 . Ten other CLASH BCGs in Rawle et al. (2012) were not detected in the mid-IR. Among these IR non- detections, we find a UV excess for only ms2137. In the Hoffer et al. (2012) compilation of SFRs, a209 has an estimated SFR of 0.9 ± 0.1 M⊙ yr−1 , based on 24 micron photometry, while our measurements give an upper limit of 1.1< M⊙ yr−1 . The Hoffer SFR for A383 of 1.6 ± 0.2 is similar to our UV rate of 1.6 ± 0.4 M⊙ yr−1 . The UV-quiescent BCG in r2248 (also known as Abell S1063) has a small IR excess corresponding to 0.8 ± 0.13 M⊙ yr−1 . As mentioned above, r1532 is a known starbursting BCG with a mid-IR SFR of 110 ± 22 M⊙ yr−1 and a UV rate of ∼43 M⊙ yr−1 . In general, mid-IR observations around 100 microns, near the peak of the dust emission, are more sensitive to low levels of star formation or other activity because of the uncertain UV contribution from evolved stars. However, dust heated by light from the old stellar population can also produce FIR emission, so low-level SFRs for BCGs based on single IR photometry points can also be inaccurate (Donahue et al. 2011). Ideally, one would like more accurate measures of star formation based on 7 http://www.stsci.edu/hst/acs/analysis/zeropoints/zpt.py, http://www.stsci. edu/hst/wfc3/phot_zp_lbn 5 The Astrophysical Journal, 805:177 (14pp), 2015 June 1 Donahue et al.
- 6. multiwavelength observations. However, in most of the star- forming CLASH BCGs, we are not hampered by uncertainties in UV flux from the evolved population because those galaxies exhibit both UV excesses of clear statistical significance and morphological indications that the bulk of the UV emission is not coming from the evolved stellar population. 3.3. UV Morphologies We show raw (un-smoothed) UV images of the star-forming CLASH BCGs in Figure 1, and smoothed UV images of the rest of the CLASH BCGs in Figure 2. Two of the clusters with quiescent BCGs, m1206 and m1149, have well-known lensed background features that contaminate UV estimates from the core of the cluster. m0744 and m1311 are somewhat bluer than the average quiescent BCG, but they both show smooth isophotes and little morphological evidence for a distinct star- forming population. In order to characterize the UV and IR morphologies of the BCGs in the 20 X-ray selected CLASH clusters we compute low-order moments of their surface brightness distributions. For each BCG we compute these moments inside a circular region that excludes other galaxies and estimate a scale and position angle from the resulting moment matrix. This exercise can be done analytically, so we provide the full procedure below for completeness. The surface brightness centroid (Cx, Cy) is determined by the normalized sums C i x y x( , )x = ∑ and C i x y y( , )y = ∑ , where I x y( , ) is the surface brightness of pixel (x, y) and i x y I x y I x y( , ) ( , ) ( , )≡ ∑ . The sums are over all (x, y) inside a circular aperture with a radius chosen to avoid excess off-axis contamination from other galaxies. Small variations in this aperture size do not change the result. The matrix elements of the next moment of the surface brightness distribution are M i x y x C( , )*( )xx x 2 = ∑ − , M i x y y C( , )*( )yy y 2 = ∑ − and M M i x y x C y C( , )*( )( )xy yx x y= = ∑ − − . These terms define a symmetric 2 × 2 matrix ( )A a c c b (1)= with M axx = , M byy = , and M M cxy yx= = . This matrix can be diagonalized in a standard way with a rotation correspond- ing to a b c a b c tan 1 2 , (2) 2 1 2 η = − + − − ⎜ ⎟ ⎜ ⎟ ⎡ ⎣ ⎢ ⎢ ⎛ ⎝ ⎞ ⎠ ⎤ ⎦ ⎥ ⎥ ⎛ ⎝ ⎞ ⎠ giving the eigenvalues a b a b c2 2 1 (3) 2 1 2 λ = + ± − +± ⎜ ⎟ ⎡ ⎣ ⎢ ⎢ ⎛ ⎝ ⎞ ⎠ ⎤ ⎦ ⎥ ⎥ as diagonal elements. These elements represent one way to quantitatively estimate the extent of a complex region. We define the terms xs λ= + and ys λ= − . The position angle η (PA in Table 3) is defined to be that of the semi-major axis, in degrees east of north (where north is aligned along the y axis as a convention in our mosaics), and axis ratio is defined to be the minimum of y xs s or x ys s. We computed these quantities for both the UV and NIR images and report the results in Table 3. The clusters that host BCGs with clear evidence for star formation are listed first in this table, approximately in order of star-forming region color, from blue to red. All of the surface brightness moments for the star-forming BCGs were computed within a region with a radius of about 5″, while the moments computed for quiescent BCGs were restricted to regions of 1″. 5–3″. 5 to avoid including an unnecessarily large number of sky- or readnoise-dominated pixels and to avoid confusion with unrelated UV sources. However, the UV and NIR regions used to compute morphological quantities for each cluster are exactly the same, so that comparison between results from the UV and the NIR from cluster to cluster is relevant. The uncertainties for all quantities in this table were computed by calculating the standard deviation of morphological parameters using 100 bootstrapped images with gaussian noise proportional to the inverse of the square root of the mosaic weight matrix. The statistical uncertainties for properties derived from the IR image were negligible compared to those derived for the UV images. 4. DISCUSSION 4.1. Star Formation Rates Table 2 gives unobscured SFRs based on UV photometry for CLASH BCGs. We have made an empirical estimate of the amount of UV associated with the evolved stellar population, using the red UV–IR colors of the quiescent BCGs in our own sample. These colors are consistent with those found in previous work on low-redshift UV emission from BCGs (Donahue et al. 2010; Hicks et al. 2010; Hoffer et al. 2012). Our reported UV SFRs have been adjusted for this contribution assuming a mean UV–NIR color for BCGs of 5.5. The uncertainty in this component translates to a minimum systematic uncertainty in the SFR of ∼0.3 M yr 1 ⊙ − for these galaxies. As we noted previously, the UV luminosity is a direct measurement of the unobscured SFR. But of course much of the star formation in a galaxy can be obscured. Galaxy studies indicate that for typical star-forming galaxies such as the Milky Way, the unobscured SFR is approximately equal to the obscured SFR, such that SFRUV ∼ SFRFIR. Typically, the unobscured (UV) SFR for a galaxy corresponds to 10%–25% of the total amount of star formation in galaxies with SFR 2 M yr 1 ⊙ − , based on comparisons with SFRs estimated from dust emission in the far infrared or Hα emission (e.g., Kennicutt 1998; Calzetti et al. 2010; Domínguez Sánchez et al. 2014). While BCGs are either non-existent or very rare in these low-redshift multiwavelength studies, the existing data on BCGs indicate similar ratios of unobscured to total star formation (e.g., Donahue et al. 2011). For the handful of BCGs with mid-infrared SFR estimates based on detections from Spitzer and Herschel (Hoffer et al. 2012; Rawle et al. 2012) the correlation between MIR SFR and UV SFR is strong (e.g., Hoffer et al. 2012). We note that several of the CLASH BCGs have nearly starburst-level luminosities (m1931, r1531, m0329) as indicated by unab- sorbed UV SFRs of 25> M⊙ yr−1 . m1532 has a mid-IR based SFR ∼110 M yr 1 ⊙ − (O’Dea et al. 2010; Hoffer et al. 2012), which is similar to but somewhat higher than the unabsorbed UV SFR of ∼80 M yr 1 ⊙ − . Therefore the total (summed) SFRs for CLASH BCGs could be two to three times higher than our estimates based on UV alone. 6 The Astrophysical Journal, 805:177 (14pp), 2015 June 1 Donahue et al.
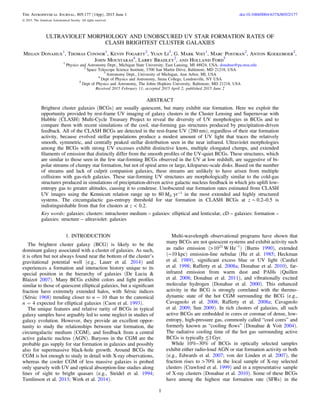
- 7. Figure 1. Top nine images show the central 50 kpc × 50 kpc of the 280 nm broad-band HST images for star-forming CLASH BCGs. A blue bar on each frame indicates a 1″ angular scale. Images are oriented with north up and east to the left. The bottom nine images show gas-temperature maps with similar physical scales from a simulation of a single BCG in which precipitation of cold clouds out of the CGM triggers jets from the central AGN Li & Bryan (2014a, 2014b). Cold gas in the simulations (show in blue) displays structures similar in extent and axis ratio to the UV structures seen in the star-forming CLASH clusters. Time stamps in the simulation frames show the time in Gyr since the beginning of the simulation. (The first major AGN outburst occurs at ∼0.3 Gyr.) 7 The Astrophysical Journal, 805:177 (14pp), 2015 June 1 Donahue et al.
- 8. All of the BCGs with unobscured UV SFRs 1 M⊙ yr−1 reside in clusters with low central gas entropy (entropy defined as K kTne 2 3 = − ). We note that most of the central gas entropies reported in Table 2 are from the ACCEPT sample (Cavagnolo et al. 2009), with the exception of m0416 and m2129, which did not have public observations available at the time of the ACCEPT project. Those central gas entropies, which are large in both systems, are based on the X-ray gas profiles described in Donahue et al. (2014). These findings for CLASH BCGs at z0.2 0.9< < are in accord with the well-known pattern observed among lower- redshift clusters. The fact that the thermodynamical state of the X-ray gas, and particularly the central cooling time, is strongly correlated with potentially star-forming optical emission-line gas was recognized as early as Hu et al. (1985). Higher resolution X-ray imaging spectroscopy from Chandra allowed improved estimates of entropy profiles and central cooling times and led to the discovery of a well-defined threshold for multiphase gas and star formation at K 30∼ keV cm2 or t 1cool < Gyr (Cavagnolo et al. 2008, 2009; Rafferty et al. 2008b). If cluster cores do not contain gas below these thresholds (which are nearly equivalent in clusters of galaxies with kT ≳ a few keV), they do not host BCGs with strong radio sources or prominent star formation signatures. The fact that the same pattern holds among CLASH BCGs (Figure 3) shows that a similar entropy/cooling-time threshold has been in place since at least z 0.5∼ . 4.2. Morphologies The CLASH BCGs show a range of UV morphologies, and the nature of the morphology is correlated with UV luminosity and SFR. BCGs with little to no star formation exhibit rather smooth UV morphologies similar to that of the underlying stellar population of evolved stars. In contrast, the UV morphologies of BCGs with UV excesses show clumps and filaments, indicating that active BCGs are forming stars, but not in disks or monolithic, single super-clusters. The clumps are likely to be clusters of hot stars, while the filaments could be unresolved strings of recently formed stars, or possibly emission-line filaments corresponding to interfaces between 107 and 104 K gas. These structures are similar to those seen in the rest-frame UV images of BCGs (O’Dea et al. 2010) and in ground-based blue images (McNamara 1997). McNamara (1997) identify four structural features: point sources, lobes, disks, and amorphous sources. As found in O’Dea et al. (2010) and in McNamara (1997), most if not all of the star-forming systems in our CLASH sample would fall into the amorphous category (with multiple clumps). Only a383 and m1720 have linear structures that might be very small disks. Figure 1 shows UV images of 9 of the 11 systems with core entropy 30 keV cm2 < (excluding ms2137 and r2129), in order of unobscured SFR. All of them show significant structure, and the amount of structure increases with increasing SFR. The most extreme star-forming BCGs exhibit the largest UV extents and biggest centroid shifts in comparisons among UV and NIR Figure 2. Ultraviolet (280 nm rest-frame) broad-band HST images of the central 50 kpc × 50 kpc of 16 CLASH clusters with moderate to high entropy cores, smoothed with a gaussian having FWHM of 0″.3. Most of the BCGs in these clusters do not show much 2d structure beyond a faint, central enhancement. Exceptions are the m1206 BCG, with a tadpole-shaped central feature that is likely to be the lensed light of a background galaxy, and the m1149 BCG which has a prominent, lensed spiral galaxy just SE of its core. All of the BCGs are centered in each image. In some cases the UV source is very compact, likely to be a nuclear star cluster or a weak AGN. Images are oriented with north up and east to the left. 8 The Astrophysical Journal, 805:177 (14pp), 2015 June 1 Donahue et al.
- 9. morphological quantities. The other star-forming BCGs are somewhat more compact than the most UV-luminous BCGs, and are in general fairly well centered on the NIR images. In these less vigorously star-forming BCGs, the UV emission is typically less extended (smaller-scale moments) than the NIR light, even within a limited aperture centered on the BCG. The higher entropy systems in Figure 2 are more uniform in appearance, with smooth, symmetric, centrally concentrated UV emission profiles. UV emission in these systems tracks the the evolved stellar population, which dominates the NIR light emitted by both star-forming and quiescent BCGs. Table 3 reports morphological parameters that quantify these differences between quiescent and star-forming BCGs. UV morphological parameters of quiescent BCGs are very similar to those measured in the NIR images, while star-forming BCGs exhibit different axis ratios and sometimes different centroids in the UV compared to the NIR. Position angles derived from the infrared and the UV images are mostly well correlated. Large position-angle differences found in a few of the quiescent BCGs are not significant because those galaxies are nearly round, leading to large uncertainties in the position angles. However, five of the six BCGs with unobscured SFRs 10> M yr 1 ⊙ − have UV position angles that differ from the IR position angles by more than 3σ (Figure 4). 4.2.1. Morphological Details of Star-forming CLASH BCGs The most extreme SF BCGs in CLASH are in clusters m1931 and r1532. m1931 has multiple clumps, with the largest and most luminous clumps in the center. There are several clear filaments, aligned preferentially north/south. The knot detail is also visible in continuum images, indicating that the stellar density is also enhanced in those regions, not just the emission lines. The UV structures extend over 20 kpc NW of the BCG, and somewhat to the SE, for an overall elongated appearance. Table 3 UV and NIR Morphological Parameters Name Aperture Centroid Diffb ± PA (UV)a PA (IR)a PA Diffb ± Axis Ratio ± Axis Ratioc (arcseconds) (arcseconds) (arcseconds) (degrees) (degrees) (degrees) (degrees) (UV) (IR) m1931 4.88 0.83 0.01 −35 −31.38 3.2 0.4 0.61 0.01 0.83 r1532 4.88 0.06 0.01 41 52.91 12.2 0.9 0.79 0.01 0.79 m0329 4.88 0.23 0.02 −49 −5.36 43.3 1.4 0.76 0.01 0.94 m0429 4.88 1.12 0.02 18 −6.50 24.7 1.8 0.75 0.01 0.83 m1423 4.88 0.09 0.04 21 29.07 7.6 3.5 0.65 0.05 0.77 r1347 4.88 0.24 0.03 −49 −6.88 42.2 10.3 0.93 0.02 0.88 m1115 4.88 0.33 0.04 −43 −40.29 2.6 2.4 0.78 0.02 0.86 ms2137 2.28 0.05 0.01 71 61.08 10.4 6.7 0.96 0.01 0.97 m1720 4.88 0.21 0.04 −37 −15.49 21.8 34.0 0.97 0.06 0.87 A383 4.88 0.12 0.05 27 13.50 13.2 7.2 0.88 0.02 0.96 r2129 2.28 0.19 0.03 69 68.24 1.1 3.5 0.74 0.02 0.88 m0744 2.28 0.19 0.03 60 27.52 32.3 18.5 0.91 0.05 0.93 m1311 2.28 0.20 0.04 −66 −45.33 20.8 7.1 0.81 0.05 0.94 A2261 2.28 0.18 0.03 −44 −27.25 16.6 12.1 0.94 0.02 0.98 m1206 4.88 0.13 0.06 44 −77.47 58.6 37.0 1.00 0.08 0.76 A1423 1.63 0.15 0.03 66 63.53 2.9 6.8 0.85 0.03 0.87 a209 1.63 0.27 0.03 −42 −50.97 8.7 6.2 0.85 0.03 0.96 A611 1.63 0.43 0.06 38 36.53 1.8 33.5 0.95 0.12 0.95 c1226 2.28 0.58 0.10 −79 −85.89 6.5 11.7 0.31 0.17 0.71 r2248 1.30 0.03 0.01 64 50.34 13.3 7.2 0.94 0.01 0.95 Notes. This table includes the 20 X-ray selected CLASH clusters, ordered as in Table 2. a Position angles are reported with the convention of the longest axis pointing east of north, in degrees. The rotation solution provided in the text computes the angle of the first component (xx) from the x-axis in the image. (For our mosaics, the x-axis runs east–west.) b The columns labeled Centroid Diff and PA Diff contain the absolute magnitude of the differences between the IR and UV centroids and the IR and UV position angles, respectively, as measured over identical regions on the sky. Note that while the UV and IR centroids are all within an arcsecond, only clusters with prominent star formation show significant ( 3σ> ) differences in the position angles. c The axis ratio in the IR has negligible statistical uncertainty compared to the ratio in the UV. The ultraviolet emission appears to be somewhat more elongated than the IR for star-forming galaxies; the outlier among the quiescent BCGs is in c1226 at z = 0.89, which shows an interestingly elongated UV morphology in its core. Figure 3. Rest-frame UV (280 nm)–NIR (1 micron) color of the central regions of CLASH BCGs plotted against central ICM gas entropy. (Gas entropy here is defined to be K Tne 2 3 = − , where T is temperature in keV and ne is electron number per cubic cm.) The connection between the thermodynamic state of circumgalactic gas surrounding the BCG and star formation in the central galaxy is clear. The entropy threshold in the CLASH sample is similar to the entropy threshold seen in lower redshift clusters (z 0.2< ) by Cavagnolo et al. (2009) and others. 9 The Astrophysical Journal, 805:177 (14pp), 2015 June 1 Donahue et al.
- 10. There is a curved, clearly resolved dust lane cupping the southeast quadrant of the clumpy nuclear region, while the brightest three non-nuclear clumps spray to the northeast, north, and northwest. This BCG exhibits GALEX emission at even shorter wavelengths (Table 4). R1532 also has radial filaments extending 20 kpc in all directions, but the longest filaments extend to the south, and multiple clumps surround the nucleus and extend southward. Among the CLASH BCGs, this one probably exhibits the most similarity to NGC1275. The brightest of its knots has been targeted for HST COS photometry and STIS long-slit observations later this year (PI: Donahue.) This BCG also exhibits curved, comma-shaped dust lanes wrapping the central knots; dust lanes appear alongside filaments and knots. M0329 exhibits several clumps and a prominent curved filament extending north from a flattened structure. It lacks FIR observations but is likely a luminous IR source, given that its unobscured SFR is similar to those of other BCG LIRGs. It was also a GALEX detection, with a 7″. 5 diameter AB mag of 21.75 ± 0.22 (NUV) and 22.6 ± 0.6 (FUV). M0429 shows what may be two distinct, clearly separate, clumps interacting in the center of cluster. Several other BCGs have a compact, multi-clump morphology. M1115 has three to four clumps oriented like beads on a curved string, with a couple of fainter sources a couple arcseconds off-center. M1423 has a bright but extended central source sitting in an elliptical distribution of fainter UV light. It is also a luminous UV source in the observer frame, with rest-frame far UV detections of 22.0 ± 0.2 and 23.1 ± 0.6 AB mag (Table 4). Note that for a BCG at z = 0.545, the NUV and FUV bandpasses of GALEX cover mean rest-frame wavelengths of 147 and 98 nm respectively. In the F275W image, rest-frame far-UV ( 180λ ∼ nm), which is the bluest image CLASH obtained for this cluster, there is an elongated (0.3–0.5 arcsec) nuclear object located precisely with the BCG, oriented about 35°W of N. Its IR estimated SFR rate of 46 ± 3 M yr 1 ⊙ − (Rawle et al. 2012) is 3 times the unobscured UV rate in Table 2, an IR excess typical of obscured starburst galaxies. R1347 is a very well-known active BCG in what was once the most luminous X-ray cluster known (Schindler et al. 1995) and has a cool core with evidence for a merger (Mason et al. 2010). It does not show a spectacular UV filament system, at least not as spectacular as other CLASH BCGs in this category. But it does have a very bright SF region just to the ESE of the nucleus, and a faint filament on the opposite side of the nucleus. 4.3. Comparison with Simulations of AGN Feedback Cooling and heating of the CGM around BCGs has been a topic of much interest for 30–40 yr (Fabian 1994). AGN feedback is increasingly thought to be the key physical process regulating the CGM (McNamara & Nulsen 2007, 2012), and the CLASH clusters with low-entropy cores all appear to have BCGs with active nuclei. In the CLASH sample, 10 of the 11 clusters with K 300 < keV cm2 have potential AGN counter- parts in the 1.4 GHz NRAO VLA Sky Survey (hereafter NVSS Condon et al. 1998) within 7″ of the BCG. The only low-K0 cluster lacking an NVSS counterpart (m1931) has a luminous X-ray and radio AGN in its core (Ehlert et al. 2011; Donahue et al. 2014). (The m1931 BCG radio source is probably missing from the NVSS because of blending with the more luminous Narrow-Angle Tailed (NAT) radio galaxy about 30″ south of the BCG. See the VLA radio map in Ehlert et al. 2011.) In contrast, only 3 of the other 13 clusters that are members of both the CLASH sample and the NVSS sky coverage have NVSS radio sources with centroids as close to the BCG. One of these clusters is m1206, which hosts a known lensed feature in the core of its BCG, so future high-resolution radio observations and optical spectroscopy are required to distinguish the lensed component from intrinsic radio emission. The other two are c1226, which has three clumps in the UV image of its BCG, and A2261, which shows evidence for “scouring” by the merging of supermassive black holes in the BCG core (Postman et al. 2012a). The only CLASH cluster too far south to be in NVSS’s sky coverage, r2248, also lacks a counterpart within an arc minute of the BCG in the 843 MHz Sydney University Molongolo Sky Survey (Bock et al. 1999; Mauch et al. 2003, known as SUMMS). It also has only upper limits for its FIR or submillimeter flux from Herschel (Rawle et al. 2012). Also, the two most extreme star-forming BCGs in CLASH show evidence in deep Chandra observations for X- ray cavities near the central radio source (Ehlert et al. 2011; Hlavacek-Larrondo et al. 2013). Recent hydrodynamical simulations of precipitation-regu- lated feedback in BCGs Li & Bryan (2014a, 2014b) produce star-forming structures of cold gas with extents and morphol- ogies very similar to the structures we observed in UV images of star-forming CLASH BCGs. In these simulations, thermal instabilities produce cold clouds that rain into the central AGN, which responds by propelling bi-polar jets into the ambient medium. Interestingly, the CGM initially responds to a jet outburst by producing additional cold gas, as the jets uplift low- entropy gas from the central region of the BCG to higher altitudes and cause it to condense into cold, star-forming gas clouds. Eventually the cold gas relaxes into a disk, but after that disk of gas is consumed by star formation, the AGN reignites as the cooling cycle re-establishes itself (Li et al. 2015). In these simulations, gas flows in and out of the central region of the galaxy, and the stars preferentially form along the jet axis with a radial extent similar to what we see in the UV images of CLASH BCGs. Figure 1 shows a montage of simulated temperature maps beneath the montage of UV images of CLASH SF BCGs. The coldest gas, which shows up as blue in these maps, indicates where stars would be forming in the simulation. We have selected frames from a movie of a single simulated cluster, in which the time indicator in the upper left corner gives the time since the beginning of the simulation. The first major AGN outburst in this simulation happens ∼300 Myr after the beginning. Frames were selected to be similar in appearance to the CLASH UV images in the upper part of the figure. Our intention is to illustrate the various morphologies that can emerge during a single episode of AGN feedback and to show how similar they can be to the UV morphologies of star- forming BCGs. An animation of this simulation can be viewed at https://vimeo.com/84807876. A similar picture of circulat- ing, heating and cooling gas, moderated by the influence of X- ray cavities in the hot atmosphere of groups and clusters is discussed in Brighenti et al. (2015). Interestingly, Lauer et al. (2005) infer similar timescales and outflow phenomena from the frequency and morphology of dust structures revealed by HST optical imaging of their sample of 77 elliptical galaxies. The dust structures seen in imaging at similar wavelengths in CLASH BCGs are not identical to the 10 The Astrophysical Journal, 805:177 (14pp), 2015 June 1 Donahue et al.
- 12. UV structures, but show similar extents. We will provide further details on the dust morphology and resolved structures in an upcoming paper and PhD thesis by Kevin Fogarty. 5. CONCLUSIONS The uniquely wide bandpass coverage and spatial resolution of the CLASH HST dataset covering 25 clusters with z ∼ 0.2–0.9 provides a unique view into the UV appearance of BCGs in some of the most massive clusters in the universe. Contrary to the quiesescent, red-and-dead reputation of BCGs, their UV appearances exhibit a wide diversity of morphologies, similar to those found in the small sample of extreme cool-core BCGs that have been studied in the rest-frame UV at low redshifts. The only CLASH clusters to host BCGs with detectable unobscured star formation are those with low- entropy X-ray emitting gas in their centers: the “cool-core” clusters. The BCGs with large SFRs are also the only ones with knots, filaments, and other asymmetric features in their UV morphologies. One exception is m1206, with a central feature that is likely to be related to a strongly lensed galaxy that is also responsible for narrow, radial filaments in optical images. UV emission from quiescent BCGs is less bright but still detectable, showing a smooth, centrally symmetric distribution with a typical UV280–NIR color of ∼5–5.5, which is consistent with low-redshift studies using GALEX and the XMM Optical Monitor. Some of these galaxies show moderate UV excesses, which are probably due to the small but finite intrinsic scatter in the UV–NIR color of the older, evolved population of stars. The unobscured SFRs we estimate, after correcting for this UV component from the elderly population, may be underestimates of the total SFRs by a factor of two or more. If this underestimate increases with increasing SFR, as in other strongly star-forming galaxies, the SFRs in the most extreme CLASH BCGs likely exceed 100 M yr 1 ⊙ − . The entropy or cooling-time threshold for star formation in the CLASH BCGs is similar to that seen in low-redshift (z 0.2< ) clusters by Cavagnolo and others. While we cannot rule out the possibility of a somewhat lower entropy threshold ∼20 keV cm2 , it is interesting to note that none of the high- entropy clusters in our sample have BCGs with excess UV light or clumpy UV morphologies, suggesting that even though our X-ray data are limited, we are not missing significant low- entropy cores in the CLASH clusters. Two potential exceptions worth following up in detail are c1226 at z = 0.89, which is extremely hot and has a BCG showing some indication of multiple components along the east–west axis, and m1206, in order to sort out the lensed contribution of its very interesting central UV/radio source. The high resolution UV rest-frame images of star-forming BCGs show a delightful variety of morphologies and structures. The scales and structures of star-forming regions seen in these UV images are similar to those of cold-gas structures in recent simulations of AGN feedback in idealized BCGs, suggesting that while mergers and interactions may play a role in the appearance of these star-forming regions, AGN feedback is a contributing if not a dominant driver of the morphology and distribution of star formation in BCGs. We acknowledge Adi Zitrin for helpful comments on the text. Support for the CLASH MCT program (ID 12100) was provided by NASA through grants from the Space Telescope Science Institute, which is operated by the Association of Universities for Research in Astronomy, Inc., under NASA contract NAS 5-26555. YL acknowledges financial support from NSF grants AST-0908390, AST-1008134, AST-1210890 and NASA grant NNX12AH41G, as well as computational resources from NASA, NSF XSEDE and Columbia University. Facilities: HST (WFC3, ACS), CXO, GALEX APPENDIX A LENSED UV FEATURES COINCIDING WITH THE BCG Two of the BCGs show UV features that are lensed background galaxies, unrelated to the cluster: m1206 and m1149. We discuss these here because they are very prominent UV features in the HST imagery, but likely have very little to do with the BCG itself. The BCG in m1206 shows two extremely long narrow filamentary features, one curved and one nearly radial, diving into the nuclear region. The center of the BCG has a curled tadpole-type morphology, which is still visible even in the bluest UV images available. As a relatively high central gas entropy system of K 700 ∼ keV cm2 , it would have been surprising if its BCG turned out to host new stars. Two sets of authors have identified these features as likely to be strongly lensed background galaxies with uncertain photometric red- shifts of around z ∼ 1.2–1.7 (Zitrin et al. 2012; Eichner et al. 2013). The BCG in the cluster core of m1149 is blended with a beautifully lensed, z = 1.491 background spiral galaxy, identified in archival data by Zitrin & Broadhurst (2009) and confirmed spectroscopically by Smith et al. (2009). The Lyα emission from this galaxy falls into the rest-frame UV of the BCG. APPENDIX B BCG NOTES AND RELEVANT SURVEY DATA The BCG of m0717 is non-trivial to identify unambiguously since it is neither dominant nor centrally located. The candidate we selected is one of the brightest galaxies spectroscopically Figure 4. Centroid and position-angle differences between UV and near-IR emission for the 20 X-ray selected CLASH BCGs. Blue diamonds show star- forming BCGs. Red squares show quiescent BCGs. Error bars show 1-σ uncertainties. Position-angle differences in position angles are usually consistent with zero, given the uncertainties, except for the star-forming BCGs with highly structured UV morphologies. Also, the objects with the largest and most significant centroid differences between UV and near-IR emission are star-forming BCGs. 12 The Astrophysical Journal, 805:177 (14pp), 2015 June 1 Donahue et al.
- 13. identified to be a member of the cluster by Ebeling et al. (2014), at an R.A. (J2000) of 07:17:32.518 and decl. (J2000) of +37:44:34.84, with z 0.5415spec = . This galaxy is located away the nominal center of the red galaxies from the CLASH list in Postman et al. (2012b) and Medezinski et al. (2013). There are no BCG candidates near this position. The galaxy identified as the BCG for this cluster by Rawle et al. (2012) (associated with a Herschel mid-IR upper limit) is likely to be a foreground elliptical galaxy. For completeness, we list the central locations of all of the BCGs utilized for UV and near IR photometry in Table 4. Most of these coordinates are nearly identical to those in Postman et al. (2012b). We cross-matched the CLASH BCG locations (in Table 4) with the NVSS (Condon et al. 1998) and SUMSS (Bock et al. 1999; Mauch et al. 2003) catalogs of radio sources, with the criterion that a source should be aligned within 7″ to be considered a candidate counterpart. We estimated the rest- frame 1.4 GHz luminosities (W Hz h1 70 2− − ) by assuming that L 1 ν∝ν − , such that L πD z F4 (1 )1.4GHz 2 2 1.4GHz= + , where D rsin = is the distance measure to the source, in which r is the comoving radial distance coordinate and r ≫ is the cosmological radius of curvature. The beams of both of these surveys are quite large, 45″. In one case, m1931, we found that the BCG source was outshined by a NAT source in the field, and so the NVSS does not record a radio source near m1931, when in fact VLA observations showed a 70 mJy source there. We completed this search to show that all of the BCGs with UV excesses and irregular UV morphologies as seen by HST have AGN activity from a relatively powerful central radio source, and we present the results in this appendix. The GALEX (Morrissey et al. 2007) archive increased in size since the ACCEPT-based work on BCGs by Hoffer et al. (2012). Therefore, we also cross-matched the BCG locations with the final (GR6/7) GALEX source list, utilizing the GALEXview service8 from MAST,9 and report the results in Table 4. The fluxes are estimates of the total flux of the source in AB magnitudes in the NUV bandpass (227 nm, 62 nm FWHM) and in the FUV (152 nm, 27 nm FWHM). The angular resolution of GALEX (about 5″) is considerably worse than that of HST, so very little morphological information can be gleaned for GALEX for our targets, and as with the radio, there is a danger of spurious associations owing to confusion between source and backgrounds/foregrounds. We note that since GALEX was an ultraviolet telescope, the central wavelength of its NUV bandpass for CLASH clusters sits almost 100 nm farther to the ultraviolet. For about 1/2 of the sample, Lyman-α is included in the NUV bandpass of GALEX so any SFRs based on these numbers would be quite uncertain. (Since the blue continuum of stars is approximately flat in Lν to 150 nm, a similar AB magnitude for continuum measured at 170 nm would correspond to a similar SFR measured at 280 nm (Kennicutt 1998), modulo an intrinsic reddening uncertainty.) Nevertheless we note that given the very different effective apertures and wavelengths, there is consistency with the upper limits and detections by GALEX with the rest-frame UV 280 nm photometry we have obtained from the HST data. We applied approximate Galactic reddening corrections, following our procedure in Hoffer et al. (2012); we report the fluxes corrected for Galactic reddening in Table 4. Three-sigma upper limits for exposures up to 500 seconds were estimated from the relations estimated by Hoffer et al. (2012). Upper limits for BCGs lacking cataloged detections in longer GALEX exposures were estimated based on the fluxes of the faintest detected GALEX catalog sources within 10 arcminutes of the source with flux uncertainties 0.35< AB mag (∼3σ). REFERENCES Atlee, D. W., Assef, R. J., & Kochanek, C. S. 2009, ApJ, 694, 1539 Bock, D. C.-J., Large, M. I., & Sadler, E. M. 1999, AJ, 117, 1578 Brighenti, F., Mathews, W. G., & Temi, P. 2015, arXiv:1501.07647 Brown, T. M. 2004, Ap&SS, 291, 215 Burns, J. O. 1990, AJ, 99, 14 Calzetti, D., Wu, S.-Y., Hong, S., et al. 2010, ApJ, 714, 1256 Caon, N., Capaccioli, M., & D’Onofrio, M. 1993, MNRAS, 265, 1013 Cardiel, N., Gorgas, J., & Aragon-Salamanca, A. 1998, MNRAS, 298, 977 Cavagnolo, K. W., Donahue, M., Voit, G. M., & Sun, M. 2008, ApJL, 683, L107 Cavagnolo, K. W., Donahue, M., Voit, G. M., & Sun, M. 2009, ApJS, 182, 12 Coe, D., Zitrin, A., Carrasco, M., et al. 2013, ApJ, 762, 32 Condon, J. J., Cotton, W. D., Greisen, E. W., et al. 1998, AJ, 115, 1693 Crawford, C. S., Allen, S. W., Ebeling, H., Edge, A. C., & Fabian, A. C. 1999, MNRAS, 306, 857 De Lucia, G., & Blaizot, J. 2007, MNRAS, 375, 2 Domínguez Sánchez, H., Bongiovanni, A., Lara-López, M. A., et al. 2014, MNRAS, 441, 2 Donahue, M., Bruch, S., Wang, E., et al. 2010, ApJ, 715, 881 Donahue, M., de Messières, G. E., O’Connell, R. W., et al. 2011, ApJ, 732, 40 Donahue, M., Mack, J., Voit, G. M., et al. 2000, ApJ, 545, 670 Donahue, M., & Voit, G. M. 2004, in Clusters of Galaxies: Probes of Cosmological Structure and Galaxy Evolution, Carnegie Observatories Centennial Symp., ed. J. S. Mulchaey, A. Dressler, & A. Oemler (Cambridge: Cambridge Univ. Press), 143 Donahue, M., Voit, G. M., Mahdavi, A., et al. 2014, ApJ, 794, 136 Dubois, Y., Pichon, C., Devriendt, J., et al. 2013, MNRAS, 428, 2885 Ebeling, H., Ma, C.-J., & Barrett, E. 2014, ApJS, 211, 21 Edge, A. C. 2001, MNRAS, 328, 762 Edwards, L. O. V., Hudson, M. J., Balogh, M. L., & Smith, R. J. 2007, MNRAS, 379, 100 Ehlert, S., Allen, S. W., von der Linden, A., et al. 2011, MNRAS, 411, 1641 Eichner, T., Seitz, S., Suyu, S. H., et al. 2013, ApJ, 774, 124 Fabian, A. C. 1994, ARA&A, 32, 277 Fabian, A. C., Nulsen, P. E. J., & Canizares, C. R. 1991, A&A Rev., 2, 191 Fabjan, D., Borgani, S., Tornatore, L., et al. 2010, MNRAS, 401, 1670 Fitzpatrick, E. L. 1999, PASP, 111, 63 Gaspari, M., Ruszkowski, M., & Sharma, P. 2012, ApJ, 746, 94 Heckman, T. M., Baum, S. A., van Breugel, W. J. M., & McCarthy, P. 1989, ApJ, 338, 48 Hicks, A. K., Mushotzky, R., & Donahue, M. 2010, ApJ, 719, 1844 Hlavacek-Larrondo, J., Allen, S. W., Taylor, G. B., et al. 2013, ApJ, 777, 163 Hoffer, A. S., Donahue, M., Hicks, A., & Barthelemy, R. S. 2012, ApJS, 199, 23 Hu, E. M., Cowie, L. L., & Wang, Z. 1985, ApJS, 59, 447 Kennicutt, R. C., Jr. 1998, ARA&A, 36, 189 Koekemoer, A. M., O’Dea, C. P., Sarazin, C. L., et al. 1999, ApJ, 525, 621 Koekemoer, A. M., Gonzaga, S., Fruchter, A., et al. 2002, HST Dither Handbook (Baltimore, MD: STScl) Koekemoer, A. M., Faber, S. M., Ferguson, H. C., et al. 2011, ApJS, 197, 36 Lauer, T. R., Postman, M., Strauss, M. A., Graves, G. J., & Chisari, N. E. 2014, ApJ, 797, 82 Lauer, T. R., Faber, S. M., Gebhardt, K., et al. 2005, AJ, 129, 2138 Leitherer, C., Schaerer, D., Goldader, J. D., et al. 1999, ApJS, 123, 3 Li, Y., & Bryan, G. L. 2014a, ApJ, 789, 54 Li, Y., & Bryan, G. L. 2014b, ApJ, 789, 153 Li, Y., Bryan, G. L., Ruszkowski, M., et al. 2015, arXiv:1503.02660 Mantz, A., Allen, S. W., Ebeling, H., & Rapetti, D. 2008, MNRAS, 387, 1179 Martizzi, D., Jimmy, Teyssier, R., & Moore, B. 2014, MNRAS, 443, 1500 Mason, B. S., Dicker, S. R., Korngut, P. M., et al. 2010, ApJ, 716, 739 Mauch, T., Murphy, T., Buttery, H. J., et al. 2003, MNRAS, 342, 1117 McCourt, M., Sharma, P., Quataert, E., & Parrish, I. J. 2012, MNRAS, 419, 3319 McDonald, M., Benson, B., Veilleux, S., Bautz, M. W., & Reichardt, C. L. 2013, ApJL, 765, L37 8 http://galex.stsci.edu/GalexView/ 9 The Barbara Mikulski Archive for Space Telescopes, http://archive. stsci.edu. 13 The Astrophysical Journal, 805:177 (14pp), 2015 June 1 Donahue et al.
- 14. McNamara, B. R. 1997, in ASP Conf. Ser. 115, Galactic Cluster Cooling Flows, ed. N. Soker (San Francisco, CA: ASP), 109 McNamara, B. R., & Nulsen, P. E. J. 2007, ARA&A, 45, 117 McNamara, B. R., & Nulsen, P. E. J. 2012, NJPh, 14, 055023 McNamara, B. R., Rafferty, D. A., Bîrzan, L., et al. 2006, ApJ, 648, 164 Medezinski, E., Umetsu, K., Nonino, M., et al. 2013, ApJ, 777, 43 Merten, J., Meneghetti, M., Postman, M., et al. 2014, arXiv:1404.1376 Morrissey, P., Conrow, T., Barlow, T. A., et al. 2007, ApJS, 173, 682 O’Dea, C. P., Baum, S. A., Mack, J., Koekemoer, A. M., & Laor, A. 2004, ApJ, 612, 131 O’Dea, C. P., Baum, S. A., Privon, G., et al. 2008, ApJ, 681, 1035 O’Dea, K. P., Quillen, A. C., O’Dea, C. P., et al. 2010, ApJ, 719, 1619 Oonk, J. B. R., Hatch, N. A., Jaffe, W., Bremer, M. N., & van Weeren, R. J. 2011, MNRAS, 414, 2309 Peterson, J. R., Kahn, S. M., Paerels, F. B. S., et al. 2003, ApJ, 590, 207 Postman, M., Lauer, T. R., Donahue, M., et al. 2012a, ApJ, 756, 159 Postman, M., Coe, D., Benítez, N., et al. 2012b, ApJS, 199, 25 Quillen, A. C., Zufelt, N., Park, J., et al. 2008, ApJS, 176, 39 Rafferty, D. A., McNamara, B. R., & Nulsen, P. E. J. 2008a, ApJ, 687, 899 Rafferty, D. A., McNamara, B. R., & Nulsen, P. E. J. 2008b, ApJ, 687, 899 Ragone-Figueroa, C., Granato, G. L., Murante, G., Borgani, S., & Cui, W. 2013, MNRAS, 436, 1750 Rawle, T. D., Edge, A. C., Egami, E., et al. 2012, ApJ, 747, 29 Rich, R. M., Salim, S., Brinchmann, J., et al. 2005, ApJL, 619, L107 Salpeter, E. E. 1955, ApJ, 121, 161 Saro, A., Borgani, S., Tornatore, L., et al. 2006, MNRAS, 373, 397 Schindler, S., Guzzo, L., Ebeling, H., et al. 1995, A&A, 299, L9 Schlafly, E. F., & Finkbeiner, D. P. 2011, ApJ, 737, 103 Schlegel, D. J., Finkbeiner, D. P., & Davis, M. 1998, ApJ, 500, 525 Sérsic, J. L. 1968, Atlas de Galaxias Australes (Cordoba, Argentina: Observatorio Astronomico) Sharma, P., McCourt, M., Quataert, E., & Parrish, I. J. 2012, MNRAS, 420, 3174 Smith, G. P., Ebeling, H., Limousin, M., et al. 2009, ApJL, 707, L163 Steidel, C. C., Dickinson, M., & Persson, S. E. 1994, ApJL, 437, L75 Sun, M. 2009, ApJ, 704, 1586 Tumlinson, J., Thom, C., Werk, J. K., et al. 2013, ApJ, 777, 59 Umetsu, K., Medezinski, E., Nonino, M., et al. 2014, ApJ, 795, 163 van Dokkum, P. G., & Conroy, C. 2010, Natur, 468, 940 Voit, G. M., & Donahue, M. 2011, ApJL, 738, L24 Voit, G. M., & Donahue, M. 2015, ApJL, 799, L1 Voit, G. M., Donahue, M., Bryan, G. L., & McDonald, M. 2015, Natur, 519, 203 von der Linden, A., Best, P. N., Kauffmann, G., & White, S. D. M. 2007, MNRAS, 379, 867 Werk, J. K., Prochaska, J. X., Tumlinson, J., et al. 2014, ApJ, 792, 8 Zheng, W., Postman, M., Zitrin, A., et al. 2012, Natur, 489, 406 Zitrin, A., & Broadhurst, T. 2009, ApJL, 703, L132 Zitrin, A., Rosati, P., Nonino, M., et al. 2012, ApJ, 749, 97 Zitrin, A., Fabris, A., Merten, J., et al. 2015, ApJ, 801, 44 14 The Astrophysical Journal, 805:177 (14pp), 2015 June 1 Donahue et al.