ROI Calculator for Search Marketing Consultants
•Download as XLS, PDF•
0 likes•570 views


Recommended
More Related Content
Similar to ROI Calculator for Search Marketing Consultants
Similar to ROI Calculator for Search Marketing Consultants (20)
More from Sanil Subhash Chandra Bose
More from Sanil Subhash Chandra Bose (10)
Recently uploaded
Recently uploaded (20)
ROI Calculator for Search Marketing Consultants
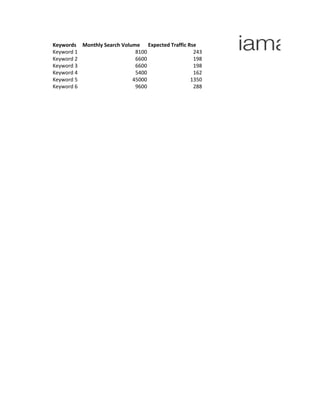
- 1. Keywords Monthly Search Volume Expected Traffic Rse Keyword 1 8100 243 Keyword 2 6600 198 Keyword 3 6600 198 Keyword 4 5400 162 Keyword 5 45000 1350 Keyword 6 9600 288
- 3. 0 1 2 3 4 Keywords Monthly Search Volume Dec-10 Jan-11 Feb-11 Mar-11 Apr-11 Keyword 1 8100 2 3.09 4.79 7.41 11.46 Keyword 2 6600 3 4.39 6.43 9.41 13.76 Keyword 3 6600 5 6.99 9.76 13.64 19.05 Keyword 4 5400 1 1.59 2.52 4 6.36 Keyword 5 45000 25 35.93 51.63 74.2 106.64 Keyword 6 9600 8 11.08 15.35 21.26 29.45 44 63.07 90.48 129.91 186.71
- 4. 5 6 7 8 9 10 11 May-11 Jun-11 Jul-11 Aug-11 Sep-11 Oct-11 Nov-11 r 17.72 27.42 42.42 65.63 101.53 157.07 243 1.55 20.15 29.48 43.15 63.16 92.44 135.29 198 1.46 26.62 37.19 51.96 72.6 101.43 141.72 198 1.4 10.1 16.04 25.47 40.45 64.24 102.01 162 1.59 153.25 220.23 316.5 454.84 653.66 939.38 1350 1.44 40.78 56.49 78.25 108.38 150.12 207.93 288 1.39 268.62 386.86 557.75 805.06 1163.41 1683.4 2439
- 5. Set up Cost Item Days Cost / day Cost Keyword Research 2 400 800 Optimising Analytics Account 1 400 400 Onsite optimisation 5 400 2000 Investment for Setup USD 3,200 Monthly Cost Item Days Cost / day Cost Monthly SEO Work 2 400 800 Reporting 1 300 300 Monthly maintainance USD 1,100
- 7. Traffic Sensitivity (Decrease) 0.00% Traffic Sensitivity (Increase) 0.00% Investment Decision Criteria Investment is very good if NPV & IRR is positive Convertion Rate 5.00% Investment is still good if either of NPV or IRR is Avg Service Earning / Lead USD 60.00 Discount Factor (in %) 8.00% 0 1 2 3 4 Months Dec-10 Jan-11 Feb-11 Mar-11 Apr-11 Monthly Traffic Rise 44 63.07 90.48 129.91 186.71 SEO Investment Outlay -3200 Monthly SEO Investment -1100 -1100 -1100 -1100 Sales Value USD 132.00 USD 189.20 USD 271.43 USD 389.74 USD 560.14 NCF -3068 -910.8 -828.57 -710.26 -539.86 PVF 1 0.93 0.86 0.79 0.74 Present Value -3068 -843.33 -710.37 -563.83 -396.81 NPV USD 992.47 IRR 9.98% Break-even Analy 8000 6000 4000 2000 0 -2000 -4000 Dec-10 Jan-11 Feb-11 Mar-11 Apr-11 May-11 Jun-11 J
- 8. good if NPV & IRR is positive. ood if either of NPV or IRR is positive 5 6 7 8 9 10 May-11 Jun-11 Jul-11 Aug-11 Sep-11 Oct-11 268.62 386.86 557.75 805.06 1163.41 1683.4 -1100 -1100 -1100 -1100 -1100 -1100 USD 805.86 USD 1,160.58 USD 1,673.26 USD 2,415.17 USD 3,490.24 USD 5,050.19 -294.14 60.58 573.26 1315.17 2390.24 3950.19 0.68 0.63 0.58 0.54 0.5 0.46 -200.18 38.18 334.49 710.55 1195.71 1829.7 Break-even Analysis Row 14 -11 Apr-11 May-11 Jun-11 Jul-11 Aug-11 Sep-11 Oct-11 Nov-11
- 9. 11 Nov-11 2439 -1100 USD 7,317.00 6217 0.43 2666.36