Welding Electrode Making Machine By Deccan Dynamics
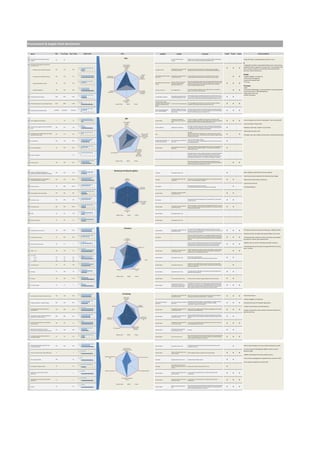
Procurement & supply chain kpi benchmark 2010
1. Procurement & Supply Chain Benchmark
Metric PCD Peer Group Best in Class Health Check Chart Qualifiers Findings Conclusion People Process System Recommendations
PCD • Align PCD metrics with peer group and best in class
PCD PCD employees as Percentage of Company 5% 4% 1% more staff than the peer Staffing level is comparable to peer group, therefore PCD staff should be able to
employs average perform at the same level (as long as their capabilities match)
IT
PCD Percentage of PCD employees included in the
following functions;
PCD employees • Integrated IT platform: automated workflow across the business,
as Percentage of
automated metrics, paperless processes, EDI, IT up skilling for PCD
Best in Class Company √ √ √
15% 17% 53%
Peer Group employs Comparable to peer group but 38% A greater resource is required to focus on strategic sourcing and supplier staff, increase utilization of current SAP, benchmark SAP best
Strategic Sourcing / Supplier Development 100% 3 strategic with SRS
PCD less than the best in class development to be able to reach best in class and optimize the supplier base practices, reduce check points...
0% 10% 20% 30% 40% 50% 60%
80%
Best in Class
Strategic People
Peer Group
Purchasing group without strategic Comparable to peer group but 24% In order to be able to reach best in class, PCD needs to divert the resource
Transactional (non-strategic) Purchasing 23% 24% 0% PCD
Training spend
60%
Sourcing /
team (17-3) more than best in class currently dedicated to tactical activities to strategic activities (see above).
√ √ • Greater delegation of authority
per PCD employs Supplier
0% 5% 10% 15% 20% 25%
40% Development • Performance management
Best in Class
• Lower staff empowerment
20% Best in class organizations manage and own the supplier relationship post contract
Peer Group
Not Available (post contract award
Falls way short of the peer group
award to ensure that the hard won savings are delivered (value for money). PCD
• Training
Contract administration / Analysis 0% 15% 34% PCD
0% activity)
(15%) but a huge gap of 34%
needs reclaim the ownership of the post award contract process (significant
√ √ √
0% 5% 10% 15% 20% 25% 30% 35% 40% between the best in class
resource is needed to address this issue)
Processes
Best in Class • CRM
Materials Management 47% 30% 30%
Peer Group
Inventory + Whs + IBL Over staffed by 15%
The warehousing team (including EI) seems high but when EI is excluded the
√ √ • Consistent methodology in solving problems: Proactive Approach
PCD
Materials Transactional figure is in the ball park of the peer group
0% 10% 20% 30% 40% 50%
Management (non-strategic)
• Lean the processes / BPR (debottleneck)
Purchasing • Organization decisions
Best in Class
Even though the spend is comparable to peer group, to reach the best in class or • Central warehouse
Comparable to peer group but falls
√ √
Peer Group
PCD Training spend per PCD employs 2,833 2,673 6,261 Training budget / employees even to match the performance of the peer group, PCD needs to invest more in its
PCD
short by 50% against best in class
0 1,000 2,000 3,000 4,000 5,000 6,000 7,000
human resource to make the step change from existing level to the best in class.
Contract
administration /
Best in Class
Analysis 9 months actual, 3 months
Peer Group
extrapolation 2009. Spend without This would suggest that PCD processes are not lean and therefore inefficient
PCD PCD Operating expenses as a percentage of spend 8.78% 0.89% 0.10%
PCD Best in Class PCD Peers feed stock (including feed stock =
Ten times more than the peer group
compared to its peer group and lag far behind the best in class
√ √ √
0.00% 2.00% 4.00% 6.00% 8.00% 10.00%
0.18%)
Best in Class
Spend per employee is 10% of the PCD needs to lean its processes, to eradicate waste (non value added activities),
same as above (including feed
PCD Total spend per PCD employee (USD) 2,000,000 22,602,890 45,833,333
Peer Group
PCD stock = 100,000,000USD)
peer group and 5% when compared and needs to optimize the use of IT to achieve scalability in order to close the gap √ √ √
0 10,000,000 20,000,000 30,000,000 40,000,000 50,000,000
to best in class between it and the peer group and the best in class.
Best in Class
SRS Smaller pool of suppliers per The level of suppliers is acceptable at this stage (due to the maturity of the
SRS Active suppliers per PCD employee 7 40 34
Peer Group
Quarterly Report employee than peers and best in business), but going forward, PCD needs to deploy lean and IT to gain scalability to √ √ √ • Up skill people resource (hire new people + train existing staff)
PCD
0 5 10 15 20 25 30 35 40 45 Active suppliers class be able to match the ratios within its peer group and best in class
per PCD • Activate vendor rating system
Best in Class
employee
100% To be able to reach best in class, PCD needs to concentrate its spend with fewer
Percent of active suppliers that account for 80% of Peer Group
SRS
spend
10% 3.7% 2.1% PCD
based on 2009 data Supplier base not optimized key suppliers to develop collaboration, partnering, longer term relationships (EDI, √ • Database cleansing / supplier classification
0% 2% 4% 6% 8% 10% 12% 80% …). That impact on revenue, production and reputation.
Best in Class 60%
• Define SRS role within PCD
See above.
Percentage of active suppliers with active supplier Peer Group
PCD needs to identify its key suppliers that are critical to the business and work
SRS
performance plans in place
0% 1.7% 10% PCD 40%
Percent of active None
with them to plan, forecast… the demand to ensure continuity of supply and value
√ √ • Strategic sourcing / supplier positioning / commodity positioning
Pre-Approved suppliers that
0% 2% 4% 6% 8% 10% 12%
Suppliers account for 80% of money to the business.
20% of spend
Best in Class
Track and monitor suppliers ruthlessly.
Quarterly Report (Q3 09 data - Q3 15% short than peers and 30% than
√
Peer Group
0%
SRS On time delivery 60% 75% 90% PCD needs to put in place a monitoring program with active daily communication
PCD was 44% on time delivery) best in class
0% 20% 40% 60% 80% 100%
for all expected deliveries.
Best in Class
PCD needs to undergo a cleansing program for the vendor mater and apply the pre
Huge gap between peer group and
√
Peer Group
SRS Pre-Approved Suppliers 3% 50% 90% Quarterly Report approval process for all registered suppliers. This will reduce considerably the
PCD
best in class
0% 20% 40% 60% 80% 100% Percentage of internal procurement LT.
active suppliers
Best in Class with active
On time delivery
Peer Group supplier PCD needs to capture customer complaints through arm to be able to fix problems
SRS 5% performance and improve services. In a functional environment arm can be done off line,
Customer complaints PCD
0% 1% 2% 3% 4% 5% 6%
plans in place however to achieve best in class, arm should be an enabler as part of an overall
forecasting and demand process. This should be done through an IT platform.
Best in Class
Best in Class PCD Peers PCD needs to tackle the issue of delayed payments by reviewing its current
Peer Group
SRS On time payment 76% 60% 95% PCD
processes. PCD needs to be more pro active in dealing with this matter: fixing the √ √
0% 20% 40% 60% 80% 100%
problem through analyzing and fixing the root causes
Best in Class
Warehouse & Inbound Logistics
WHIL Logistics / Transportation employees as a 20% 44% 17%
Peer Group
Including EI Comparable to best in class √ • Data integrity review (SAP and manual reports)
percentage of Materials Management employees PCD
0% 10% 20% 30% 40% 50%
• Lean the processes (implement the warehousing strategy)
Best in Class
Logistics
WHIL Warehousing employees as a percentage of 7% greater than best in class (still PCD needs to put a warehousing strategy in place, have lean processes to reduce
Peer Group
Materials Management employees
67% 52% 60% PCD Organization Including EI
comparable) the cost. The current approach is expensive.
√ √ • Move forward with Central warehouse
0% 10% 20% 30% 40% 50% 60% 70% 100%
80%
• Up skill the resources
Best in Class
PCD needs to capture this KPI and monitor it.
√
Peer Group
WHIL Order pick accuracy NA 80% 99.5% Not Available
PCD
Returns to
60%
Warehouse This measures the effectiveness of the warehouse team (shelving) • 5S implementation
0% 20% 40% 60% 80% 100% 120%
warehouse Organization
40%
Best in Class
Comparable to peer group but 8%
√ √
Peer Group 20%
WHIL Orders shipped on time and complete 91% 90% 99% Quarterly Report
PCD
less than best in class
84% 86% 88% 90% 92% 94% 96% 98% 100%
0%
Best in Class
Peer Group
Peer group and best in class recognize this as an important KPI. It measures the
WHIL Inventory accuracy NA 85% 97% PCD
Not Available
inventory accuracy
√ √
0% 20% 40% 60% 80% 100% 120% Orders shipped
OSDR on time and
Best in Class
complete
Technical Inspection is not implemented yet. Although the GR is done on time, the
Peer Group
Comparable to peer group but 9%
WHIL Internal GR on time 90% 90% 99.5% PCD
Quarterly Report
less than best in class
absence of technical inspection might create problems at the issuing time because √ √
84% 86% 88% 90% 92% 94% 96% 98% 100% 102%
of the quality of the materials.
Internal GR on
Best in Class
time
Peer Group
WHIL OSDR 2% 5% 1.5% PCD
Quarterly Report Comparable to best in class
0% 1% 2% 3% 4% 5% 6% Best in Class PCD Peers
Best in Class
Peer Group
WHIL Returns to warehouse 3% 8% 3% PCD Quarterly Report Comparable to best in class
0% 1% 2% 3% 4% 5% 6% 7% 8% 9%
Best in Class Inventory The current level is acceptable due to the maturity of the business. Once the
Inv Average Customer service level 79% 80% 95%
Peer Group
Quarterly Report
Comparable to peer group but 15%
handover is complete, database finalized, Inventory needs to start working on the √ √ √ • Permanent solution for technical evaluation / Material query
PCD less than best in class
0% 20% 40% 60% 80% 100%
demand forecast to improve this KPI.
• Demand forecast for better planning and better service level
Best in Class
Due to the maturity of the business, it is not possible to capture this data for the
Peer Group
moment. However, Inventory needs to start collecting the data and preparing the
Inv Average forecast accuracy NA 60% 90% PCD
Not available
process for it. The forecast process needs to go beyond inventory, it should be at
√ √ √ • Collaborate with customer to collect maintenance parameters
Average
0% 20% 40% 60% 80% 100%
Customer service
PCD level. and upload in system (stock optimization)
level
Best in Class
100%
Turnover measures the efficiency of the supply chain. Inventory needs to set the • Address the issue of over stocking (investment recovery)
√ √ √
Peer Group
Inv Spares stock turnover (years) NA 2.5 1 right parameters to avoid having dormant stock. Inventory needs to do this in
PCD
0% 50% 100% 150% 200% 250% 300%
80% conjunction with the business and in particular with the key section of PCD.
• Collaborate with purchasing to set agreement for fast moving
TE cycle time MRP LI vs. TE
Best in Class
60%
items / set VMI...
This KPI is related to the accuracy of the data in the catalogue. Inventory needs to
Peer Group
Comparable to peer group but 8%
Inv MRP LI vs. TE 13% 15% 5% PCD
40% Quarterly Report
more than best in class
undergo a data enrichment program to reduce the internal LT for procurement. √ √
0% 2% 4% 6% 8% 10% 12% 14% 16%
In best in class, TE is carried out at the front end.
20%
Inv
Type of PRs Best in Class
0%
Not under the control of inventory.
Normal 80% 70% 80% Peer Group
PCD
Quarterly Report Comparable to best in class
However, the target should be communicated to customer in the OLA.
√ √
Urgent 8% 20% 10% 0% 10% 20% 30% 40% 50% 60% 70% 80% 90%
Overstock Urgent
Others 12% 10% 10%
Best in Class
The figures are comparable to best in class due in part to the overstock (19%).
√
Peer Group
Inv Level of stock outs 3% 4% 2.5% Quarterly Report Comparable to best in class However, to achieve best in class PCD needs to implement demand forecasting /
PCD
0% 1% 1% 2% 2% 3% 3% 4% 4% 5%
achieve lean supply chain
Level of stock
Best in Class
Shortages
outs
Peer Group
To maintain the best in class figures, PCD needs to achieve lean supply chain to
Inv Shortages 5% 10% 5%
PCD
Quarterly Report Comparable to best in class
replenish the stock quickly (5S)
√ √
0% 2% 4% 6% 8% 10% 12%
Best in Class Best in Class PCD Peers
√ √
Peer Group
Inv Overstock 19% 10% 2.5% Quarterly Report 17% more than the best in class Inventory needs to undergo an integrated approach to limit the overstock
PCD
0% 5% 10% 15% 20%
Best in Class
The bottleneck in the process is the customer apathy. PCD should communicate
Long lead time to process TE. 3
with customer to sort this issue out. An integrated approach needs to take place
√ √ √
Peer Group
Inv TE cycle time (days) 40