Palm Springs Luxury Housing Market Sets Record Despite Pandemic

While banks tighten credit for first-time buyers, the pandemic is hammering Americans who don’t have the privilege of working remotely. The wealthy, meanwhile, are benefiting from the surging stock market and mortgage rates are at record lows. Demand for luxury homes in the greater Palm Springs area is soaring, underscoring how the COVID-19 pandemic has intensified wealth disparities in the U.S. Luxury Home sales in Palm Springs area in January 2021 (Price Range: $750,000 – No Limit) jumped 63.2% year over year. The number of under contract listings was 363, set a new all-time high since 2005, up 41.2% compared to previous month and up 207.6% compared to previous year. https://www.openhousespalmsprings.com/palm-springs-luxury-housing-market-sets-record-despite-pandemic/

Recommended
Recommended
More Related Content
Recently uploaded
Recently uploaded (20)
Featured
Featured (20)
Palm Springs Luxury Housing Market Sets Record Despite Pandemic
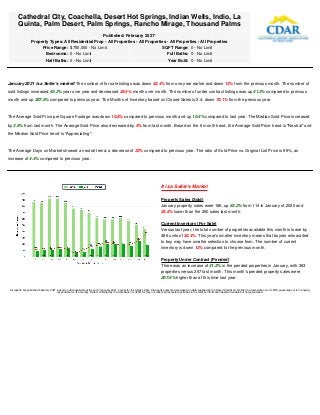
- 1. January 2021 is a Seller's market! The number of for sale listings was down 52.4% from one year earlier and down 12% from the previous month. The number of sold listings increased 63.2% year over year and decreased 25.6% month over month. The number of under contract listings was up 41.2% compared to previous month and up 207.6% compared to previous year. The Months of Inventory based on Closed Sales is 2.4, down 70.1% from the previous year. The Average Sold Price per Square Footage was down 10.8% compared to previous month and up 10.4% compared to last year. The Median Sold Price increased by 3.9% from last month. The Average Sold Price also decreased by 9% from last month. Based on the 6 month trend, the Average Sold Price trend is "Neutral" and the Median Sold Price trend is "Appreciating". The Average Days on Market showed a neutral trend, a decrease of 33% compared to previous year. The ratio of Sold Price vs. Original List Price is 95%, an increase of 4.4% compared to previous year. Cathedral City, Coachella, Desert Hot Springs, Indian Wells, Indio, La Quinta, Palm Desert, Palm Springs, Rancho Mirage, Thousand Palms Published: February 2021* Property Types: All Residential Prop - All Properties - All Properties - All Properties - All Properties Price Range: $750,000 - No Limit SQFT Range: 0 - No Limit Bedrooms: 0 - No Limit Full Baths: 0 - No Limit Half Baths: 0 - No Limit Year Built: 0 - No Limit It is a Seller's Market Property Sales (Sold) January property sales were 186, up 63.2% from 114 in January of 2020 and 25.6% lower than the 250 sales last month. Current Inventory (For Sale) Versus last year, the total number of properties available this month is lower by 486 units of 52.4%. This year's smaller inventory means that buyers who waited to buy may have smaller selection to choose from. The number of current inventory is down 12% compared to the previous month. Property Under Contract (Pended) There was an increase of 41.2% in the pended properties in January, with 363 properties versus 257 last month. This month's pended property sales were 207.6% higher than at this time last year. All reports are published February 2021, based on data available at the end of January 2021, except for the today’s stats. All reports presented are based on data supplied by the Desert Area MLS. Neither the Association nor its MLS guarantees or is in anyway responsible for its accuracy. Data maintained by the Association or its MLSs may not reflect all real estate activities in the market. Information deemed reliable but not guaranteed.
- 2. Cathedral City, Coachella, Desert Hot Springs, Indian Wells, Indio, La Quinta, Palm Desert, Palm Springs, Rancho Mirage, Thousand Palms Published: February 2021* Property Types: All Residential Prop - All Properties - All Properties - All Properties - All Properties Price Range: $750,000 - No Limit SQFT Range: 0 - No Limit Bedrooms: 0 - No Limit Full Baths: 0 - No Limit Half Baths: 0 - No Limit Year Built: 0 - No Limit The Average Sold Price per Square Footage is Neutral* The Average Sold Price per Square Footage is a great indicator for the direction of property values. Since Median Sold Price and Average Sold Price can be impacted by the 'mix' of high or low end properties in the market, the Average Sold Price per Square Footage is a more normalized indicator on the direction of property values. The January 2021 Average Sold Price per Square Footage of $404 was down 10.8% from $453 last month and up 10.4% from $366 in January of last year. * Based on 6 month trend – Appreciating/Depreciating/Neutral The Days on Market Shows Neutral Trend* The average Days on Market (DOM) shows how many days the average property is on the market before it sells. An upward trend in DOM trends to indicate a move towards more of a Buyer’s market, a downward trend indicates a move towards more of a Seller’s market. The DOM for January 2021 was 75, down 2.6% from 77 days last month and down 33% from 112 days in January of last year. The Sold/Original List Price Ratio Remains Steady** The Sold Price vs. Original List Price reveals the average amount that sellers are agreeing to come down from their original list price. The lower the ratio is below 100% the more of a Buyer’s market exists, a ratio at or above 100% indicates more of a Seller’s market. This month Sold Price vs. Original List Price of 95% is the same as last month and up from 4.4% % in January of last year. * Based on 6 month trend – Upward/Downward/Neutral ** Based on 6 month trend – Rising/Falling/Remains Steady All reports are published February 2021, based on data available at the end of January 2021, except for the today’s stats. All reports presented are based on data supplied by the Desert Area MLS. Neither the Association nor its MLS guarantees or is in anyway responsible for its accuracy. Data maintained by the Association or its MLSs may not reflect all real estate activities in the market. Information deemed reliable but not guaranteed.
- 3. Cathedral City, Coachella, Desert Hot Springs, Indian Wells, Indio, La Quinta, Palm Desert, Palm Springs, Rancho Mirage, Thousand Palms Published: February 2021* Property Types: All Residential Prop - All Properties - All Properties - All Properties - All Properties Price Range: $750,000 - No Limit SQFT Range: 0 - No Limit Bedrooms: 0 - No Limit Full Baths: 0 - No Limit Half Baths: 0 - No Limit Year Built: 0 - No Limit The Average For Sale Price is Appreciating* The Average For Sale Price in January was $2,398,000, up 31.2% from $1,828,000 in January of 2020 and up 5.3% from $2,277,000 last month. The Average Sold Price is Neutral* The Average Sold Price in January was $1,449,000, up 7.2% from $1,352,000 in January of 2020 and down 9% from $1,593,000 last month. The Median Sold Price is Appreciating* The Median Sold Price in January was $1,178,000, up 12.2% from $1,050,000 in January of 2020 and up 3.9% from $1,134,000 last month. * Based on 6 month trend – Appreciating/Depreciating/Neutral It is a Seller's Market* A comparatively lower Months of Inventory is more beneficial for sellers while a higher months of inventory is better for buyers. *Buyer’s market: more than 6 months of inventory Seller’s market: less than 3 months of inventory Neutral market: 3 – 6 months of inventory Months of Inventory based on Closed Sales The January 2021 Months of Inventory based on Closed Sales of 2.4 was decreased by 70.1% compared to last year and up 20% compared to last month. January 2021 is Seller's market. Months of Inventory based on Pended Sales The January 2021 Months of Inventory based on Pended Sales of 1.2 was decreased by 85.3% compared to last year and down 35.9% compared to last month. January 2021 is Seller's market. All reports are published February 2021, based on data available at the end of January 2021, except for the today’s stats. All reports presented are based on data supplied by the Desert Area MLS. Neither the Association nor its MLS guarantees or is in anyway responsible for its accuracy. Data maintained by the Association or its MLSs may not reflect all real estate activities in the market. Information deemed reliable but not guaranteed.
- 4. Cathedral City, Coachella, Desert Hot Springs, Indian Wells, Indio, La Quinta, Palm Desert, Palm Springs, Rancho Mirage, Thousand Palms Published: February 2021* Property Types: All Residential Prop - All Properties - All Properties - All Properties - All Properties Price Range: $750,000 - No Limit SQFT Range: 0 - No Limit Bedrooms: 0 - No Limit Full Baths: 0 - No Limit Half Baths: 0 - No Limit Year Built: 0 - No Limit It is a Seller's Market* Absorption Rate measures the inverse of Months of Inventory and represents how much of the current active listings (as a percentage) are being absorbed each month. *Buyer’s market: 16.67% and below Seller’s market: 33.33% and above Neutral market: 16.67% - 33.33% Absorption Rate based on Closed Sales The January 2021 Absorption Rate based on Closed Sales of 42.2 was increased by 243.1% compared to last year and down 15.4% compared to last month. Absorption Rate based on Pended Sales The January 2021 Absorption Rate based on Pended Sales of 82.3 was increased by 546.8% compared to last year and up 60.4% compared to last month. All reports are published February 2021, based on data available at the end of January 2021, except for the today’s stats. All reports presented are based on data supplied by the Desert Area MLS. Neither the Association nor its MLS guarantees or is in anyway responsible for its accuracy. Data maintained by the Association or its MLSs may not reflect all real estate activities in the market. Information deemed reliable but not guaranteed.