SlideShare a Scribd company logo
1 of 203
Topic Six: Evolution
Variation in Stickleback
5.1 Evidence for Evolution
Essential idea: There is overwhelming evidence for the
evolution of life on Earth.
Understandings
Statement Guidance
5.1 U.1 Evolution occurs when heritable characteristics of a species
change.
5.1 U.2 The fossil record provides evidence for evolution.
5.1 U.3 Selective breeding of domesticated animals shows that artificial
selection can cause evolution.
5.1 U.4 Evolution of homologous structures by adaptive radiation explains
similarities in structure when there are differences in function.
5.1 U.5 Populations of a species can gradually diverge into separate species
by evolution.
5.1 U.6 Continuous variation across the geographical range of related
populations matches the concept of gradual divergence.
Applications and Skills
Statement Guidance
5.2 A.1 Development of melanistic insects in polluted areas.
5.2 A.2 Comparison of the pentadactyl limb of mammals, birds, amphibians
and reptiles with different methods of locomotion.
Evolution is the accumulated inherited changes in a
population over time
Evolution is one of the most powerful unifying concepts in
science and is a critical underpinning to modern biology.
It has been stated that without evolution biology,
biology makes no sense.
Dobzhansky, 1973
5.1 U.1 Evolution occurs when heritable characteristics of a species
change.
But the Fossil recordBut the Fossil record ……
OBSERVATIONOBSERVATION
Evidence supporting evolution
I. Fossil record
• transition species
I. Anatomical record
• homologous & vestigial structures
• embryology & development
I. Biogeography (Contential Drift)
II. Molecular record (Neo-Darwinsim)
• protein & DNA sequence
5.1 U.1 Evolution occurs when heritable characteristics of a species change.
5.1 U.1 Evolution occurs when heritable characteristics of a species
change.
The raw genetic material
(variation) is hidden there
http://upload.wikimedia.org/wikipedia/commons/9/90/Rock_Dove_
(Feral_Pigeon)_(Columba_livia)_-_geograph.org.uk_-_1309587.jpg
5.1 U.1 Evolution occurs when heritable characteristics of a species
change.
5.1 U.1 Evolution occurs when heritable characteristics of a species change.
http://4.bp.blogspot.com/-
6EXGifOabDY/T75wOIZARKI/AAAAAAAAEkk/OSmkn
25kUhE/s1600/darwin-finches.jpg
5.1 U.2 The fossil record provides evidence for evolution.
Mount Everest
29,002 ft above sea level29,002 ft above sea level
Hillary’s Step
Fossilized
sea shells located
just a few feet
away from the
top of the world
5.1 U.2 The fossil record provides evidence for evolution.
Fossil Record
• Sedimentary rock is laid down
over time… new on top, older
rocks below
• As one digs down, find related
fossils, which are progressively
older as one digs deeper
• Consistent and steady
increases in size/complexity of
structures or the whole
organism, or just the opposite,
are seen in successive
stratigraphic layers
Oldest
Youngest
5.1 U.2 The fossil record provides evidence for evolution.
• Layers of sedimentary rock contain fossils
– new layers cover older ones, creating a record over time
– fossils within layers show that a succession of organisms
have populated Earth throughout a long period of time
The fossil record provides the dimension of time to the study of
evolution – the layer of rock in which a fossil is found can be dated and
therefore used to deduce the age of the fossil.
http://sciencelearn.org.nz/Contexts/Dating-the-Past/Sci-Media/Images/Fossils-in-sedimentary-rock
5.1 U.2 The fossil record provides evidence for evolution.
http://sciencelearn.org.nz/Contexts/Dating-the-Past/Sci-Media/Images/Fossils-in-sedimentary-rock
5.1 U.2 The fossil record provides evidence for evolution.
There are gaps in the fossil record due to:
•Special circumstances are required for fossilization to occur
•Only hard parts of an organism are preserved
•Fossils can be damaged so that only fragments remain to be discovered
The fossil record is the sum of all
discovered and undiscovered fossils
and their relative placement in rock.
Fossil Preservation
• Petrified
• Prints and molds
• Resins which turn to Amber
• Tar
• Peat which is acidic preventing decay
• Frozen in Ice or Snow
• Sediments which turn to rock
5.1 U.2 The fossil record provides evidence for evolution.
http://upload.wikimedia.org/wikipedia/commons/d/de/Ambre_Dominique_Moustique.jpg
5.1 U.2 The fossil record provides evidence for evolution.
Radioactive Dating
• Unstable atomic isotopes that decay
over time. Organisms incorporate
these isotopes in their bodies. This
can be detected and used to
radioactive dating a fossil, because
radioactive decay follows a
predictable exponential decay with
time.
Half-life is the period of time it
takes for a substance undergoing
decay to decrease by half. Example
below
5.1 U.2 The fossil record provides evidence for evolution.
• For instance, organisms take
up C, both as 14
C and 12
C but the
14
C decays away, so that one
can determine how old the
fossil is by the ratio of 14
C to 12
C
in the fossil. The older it is, the
greater the relative quantity of
12
C vs. 14
C.
Then, as with 14
C dating,
the age in half lives can
be deduced from the
decay curve
Half life of 14
C is 5730
years, so it is useful for
dating samples that are
between 1000 &
100,000 years old
5.1 U.2 The fossil record provides evidence for evolution.
Potassium-Argon dating
• Proportions of parent 40
K atoms and daughter 40
Ar atoms are
measured
• Half-life of 40
K is 1250 million years so it is very useful for dating
samples older than 100,000 years old.
5.1 U.3 Selective breeding of domesticated animals shows that artificial
selection can cause evolution.
Artificial selection Wild Mustard Plant
http://www.evolutionevidenc
e.org/wp-
content/uploads/2013/08/mu
stardselection1.jpg
http://upload.wikimedia.org/wikipedia/commons/2/2f/Wi
ld_Mustard.jpg
5.1 U.3 Selective breeding of domesticated animals shows that artificial
selection can cause evolution.
https://phaven-prod.s3.amazonaws.com/files/image_part/asset/954254/z9zJXMj-QvJF-
DjAAnbdUsdnL2I/large_Brassica_oleracea_cauliflower_broccoli_etc_DP347.jpg
Selective breeding
5.1 U.3 Selective breeding of domesticated animals shows that artificial
selection can cause evolution.
Comparative Anatomy
• Homologous structures
• Analogous structures
Convergent evolution
Parallel Evolution
• Vestigial Organs
• Embryology
5.2 A.2 Comparison of the pentadactyl limb of mammals, birds,
amphibians and reptiles with different methods of locomotion.
Homologous structures Pentadactly limb)
similarities in characteristics resulting from common ancestry
Divergent Evolution
5.2 A.2 Comparison of the pentadactyl limb of mammals, birds,
amphibians and reptiles with different methods of locomotion.
Homologous structures
• Similar structure
• Similar development
• Different functions
• Evidence of close evolutionary
relationship
– recent common ancestor
5.2 A.2 Comparison of the pentadactyl limb of mammals, birds,
amphibians and reptiles with different methods of locomotion.
Vestigial Structures
• describes a characteristic of organisms that
have seemingly lost all or most of its original
function through evolution.
• Fossil record supports the hypothesis that
whales are derived from ancient vertebrates
• Vestigial hind limbs are present in modern
whales internal bones. Vestigial limbs are
found in many animals, including the python.
5.2 A.2 Comparison of the pentadactyl limb of mammals, birds,
amphibians and reptiles with different methods of locomotion.
Embryology
• Similar features seen in developmental stages of related organisms
• Gill pouches and tails seen in developing vertebrates
• They have a common ancestor
5.2 A.2 Comparison of the pentadactyl limb of mammals, birds,
amphibians and reptiles with different methods of locomotion.
The climate of the
Galapagos Islands
varies seasonally and
yearly. Coastal areas
and higher
elevations also show
a large temperature
difference.
Ages of the Galapagos Island
5.1 U.4 Evolution of homologous structures by adaptive radiation
explains similarities in structure when there are differences in function.
Darwin found… birds
Finch?
Sparrow?
Woodpecker? Warbler?
Collected manyCollected many
different birds on thedifferent birds on the
Galapagos Islands.Galapagos Islands.
Thought he foundThought he found
very different kinds…very different kinds…
Darwin was amazed to
find out:
All 14 species of birds
were finches…
Finch? Sparrow?
Woodpecker? Warbler?
But Darwin found… a lot of finches
Large Ground
Finch
Small Ground
Finch
Warbler Finch
But there is only one
species of finch on the
mainland!
Veg. Tree Finch
Correlation of species to food source
SeedSeed
eaterseaters
FlowerFlower
eaterseaters
InsectInsect
eaterseaters
Hawaiian violets (Viola)
– Nine taxa, seven species distributed over most islands
– Species occupy several different habitats across five islands
• Dry forest
• Dry cliff
• Stream bank
• Swamp (cloud) forest
• Open bog
– Species growing in same habitat on different islands are almost
identical morphologically, anatomically
5.1 U.5 Populations of a species can gradually diverge into separate
species by evolution.
Ages of the Hawaiian Islands
Kauai = 5.1 my
Hawaii =
400,000-180,000 my
Maui Nui complex =
1.9 my-800,000 y
Oahu = 3.7-2.6 my
Topography of Kauai
Waimea Canyon
(extremely arid)
Alakai Swamp/Mt Waialeale
(wettest place on earth)
Sandy or rocky
Coastal sites
Low-elevation
Moist forest
High-elevation
wet forest, cliffs
Some Viola species on Kauai
Viola tracheliifolia
(treelet, dry forest)
Viola wailenalenae
(shrub, swamp)
Viola kauaiensis
(herb, open bog)
5.1 A.1 Development of melanistic insects in
polluted areas.
http://upload.wikimedia.org/wikipedia/commons
http://en.wikipedia.org/wiki/Peppered_moth_evolution
#mediaviewer/File:Biston.betularia.f.carbonaria.7209.jp
g
Example of evolution taking place
•The peppered moth…. Two forms
(morphs) the gray mottled form and the
dark form. Changes in relative numbers was
hypothesized to be the result of selective
predation by birds. High industrial
pollution make the darker moth less likely
to be seen.
•Melanin gives color to moths
Black is a mutation of the white form
(morphs), it is dominant.
With industrial pollution the black allele
became favorable. Increase in
population of the dominant allele.
Clean air, return of lichen , increase in
recessive allele.
5.1 A.1 Development of melanistic insects in
polluted areas.
http://upload.wikimedia.org/wikipedia/commons/b/b7/Lichte_en_zwarte_versie_berkenspanner.jpg
5.1 U.6 Continuous variation across the geographical range of related
populations matches the concept of gradual divergence.
• Geographic variation is the term used to refer to differences
between populations. Differences in phenotype associated with local
environment
• For instance, yarrow plants vary with geographical location across
the Sierra Nevada
Essential idea: The diversity of life has evolved and
continues to evolve by natural selection.
5.1 Natural Selection
https://s-media-cache-ak0.pinimg.com/736x/51/3d/86/513d86a093998ac870e98e052dde0ed3.jpg
Understandings
Statement Guidance
5.1.U.1 Natural selection can only occur if there is variation among members
of the same species.
5.1.U.2 Mutation, meiosis and sexual reproduction cause variation between
individuals in a species
5.1.U.3 Adaptations are characteristics that make an individual suited to its
environment and way of life.
5.1.U.4 Species tend to produce more offspring than the environment can
support.
5.1.U.5 Individuals that are better adapted tend to survive and produce more
offspring while the less well adapted tend to die or produce fewer
offspring
5.1. U.6 Individuals that reproduce pass on characteristics to their offspring.
[Students should be clear that characteristics acquired during the
lifetime of an individual are not heritable. The term Lamarckism is not
required.]
5.1 U.7 Natural selection increases the frequency of characteristics that make
individuals better adapted and decreases the frequency of other
characteristics leading to changes within the species.
Applications and Skills
Statement Guidance
5.2 A.1 Changes in beaks of finches on Daphne Major.
5.2 A.2 Evolution of antibiotic resistance in bacteria.
Mechanism for Evolution
Natural Selection The ultimate goal of any population is that it must
produce the next generation. This is complicated by four basic
characteristics of life:
1. Variation among individuals means they individually have different
ability to obtain resources. Sexual reproduction promotes variation in a
species.
2. Reproduction Individuals that survive and then reproduce transmit these
variations to their offspring.
*The environment is the agent of natural selection determining which species
will survive.
3. Overpopulation Each generation produces more offspring then the
environment can support.
4. Competition with finite resources along with an increase in the population
there is a competition of those resources leading, a survival of the fittest.
5.2 U.1 Natural selection can only occur if there is
variation among members of the same species.
Variation among individuals means they individually have different ability to
obtain resources. Sexual reproduction promotes variation in a species.
http://upload.wikimedia.org/wikipedia/commons/thumb/5/53/Theba_geminata_variability.jpg/1280px-Theba_geminata_variability.jpg
1. Frequency of Genes (Genetic Variation)
• Inheritable differences among
individuals
• Raw material of evolution
• Happens in 3 ways
A. Mutations
B. Recombination
(meiosis)
C. Fertilization
5.2 U.2 Mutation, meiosis and sexual reproduction
cause variation between individuals in a species.
http://media-2.web.britannica.com/eb-media/70/81270-004-3B7A77F2.jpg
A. Mutations
• Permanent change in genetic variation
• Only source of new alleles
• Do not arise out of need
• Causes of mutation
– Spontaneous occurrence
– Radiation
– Chemicals
– Transposons
5.2 U.2 Mutation, meiosis and sexual reproduction
cause variation between individuals in a species.
http://www.britannica.com/EBchecked/topic/376514/Merychippus
Results of Mutations
• Harmful
Non-adaptive
Eliminated by selection
• Beneficial
Adaptive
Selected and persist
• Neutral
Neither adaptive nor non-
adaptive
May or may not persist in gene
pool
5.2 U.2 Mutation, meiosis and sexual reproduction
cause variation between individuals in a species.
http://4.bp.blogspot.com/--
zKT77cA4Rc/URACaqRE7kI/AAAAAAAAAFI/ZktOQD8BRkY/s1
600/horse_evolution.gif
Example of a gene mutation: phenylketonuria (PKU)
• C to T base-substitution mutation results in wrong amino acid
(similar to sickle-cell mutation)
• Individuals can not metabolize amino acid phenylalanine an
enzyme needed to degrade phenylalanine is not made so it
accumulates in the brain and causes developmental disabilities.
5.2 U.2 Mutation, meiosis and sexual reproduction
cause variation between individuals in a species.
Example of a point mutation
Example of a chromosomal mutation:
Klinefelter’s syndrome:
• receipt of an extra ‘X’ chromosome by males-> result is
feminization of secondary sex characteristics, sterility and learning
impairment may be present.
• Chromosomal mutations tend to have less evolutionary
significance because they typically cause death or sterility and will
not be passed on.
B. Recombination
• Major source of genetic variation
• Two processes
Segregation
Independent assortment
5.2 U.2 Mutation, meiosis and sexual reproduction
cause variation between individuals in a species.
C. Fertilization
5.2 U.2 Mutation, meiosis and sexual reproduction
cause variation between individuals in a species.
5.2 U.3 Adaptations are characteristics that make an
individual suited to its environment and way of life.
http://www.gerlachnaturephoto.com/Yellowstone/Bison3791_MASTER_For_Web.jpg
• Where and how an organism lives is
largely due to its specific adaptations
that allow it to survive and reproduce
in a particular area or habitat
• In other words their structure allows
them to function in that environment
• Polar bears are well adapted to life in
the Arctic. They have a large layer of
blubber to keep them warm. They are
strong swimmers, aided by their strong
forearms and layer of blubber for
buoyancy. They have hollow fur to aid
in insulation as well. For plants, cacti
have water storage tissue and spines
(prevent water loss) because of the
infrequent rainfall in the desert.
• Adaptations develop over time
through natural selection
5.2 U.4 Species tend to produce more offspring
than the environment can support.
http://evolutionbyfl.weebly.com/uploads/3/9/7/9/39791607/5832564_orig.jpg
• Populations tend to produce
more offspring than the
environment.
• For example, fish produce
thousands of eggs but only few
make it to adulthood.
• When parents don’t spend a lot
or even any time caring for their
young, they produce many
offspring. This is a reproductive
method used to make sure
some offspring make it to the
next generation.
• Overpopulation and a limited
amount of resources creates
competition within a
population.
5.2 U.5 Individuals that are better adapted tend to survive
and produce more offspring while the less well adapted tend
to die or produce fewer offspring.
• Within a population, there is
genetic variation between the
individuals in the population.
• The organisms with the
beneficial characteristics will be
able to out-compete the other
individuals with the less
beneficial or harmful genetic
traits for limited resources and
mates.
• These individuals will survive
and reproduce and pass these
genetic traits onto the next
generation of offspring.
• Organisms with less desirable
traits will die or produce less
offspring
LaMarck
• Organisms adapted to their
environments by acquiring traits
– change in their life time
• Disuse
organisms lost parts because they did not use them — like the
missing eyes & digestive system of the tapeworm
• Perfection with Use & Need
the constant use of an organ leads that organ to increase in size —
like the muscles of a blacksmith or the large ears of a night-flying
bat
– transmit acquired characteristics to next generation
Modern Theory: Mechanism for Evolution
5.2 U.6 Individuals that reproduce pass on characteristics to their offspring.
[Students should be clear that characteristics acquired during the lifetime
of an individual are not heritable. The term Lamarckism is not required.]
5.2 U.6 Individuals that reproduce pass on characteristics to their offspring.
[Students should be clear that characteristics acquired during the lifetime
of an individual are not heritable. The term Lamarckism is not required.]
5.2 U.7 Natural selection increases the frequency of characteristics
that make individuals better adapted and decreases the frequency of
other characteristics leading to changes within the species.
Populations evolve
• Natural selection acts on individuals
– differential survival
• “survival of the fittest”
– differential reproductive success
• who bears more offspring
• Populations evolve
– genetic makeup of
population changes
over time
– favorable traits
(greater fitness)
become more common
Presence of lactate dehydrogenase
Mummichog
5.2 U.7 Natural selection increases the frequency of characteristics
that make individuals better adapted and decreases the frequency
of other characteristics leading to changes within the species.
Distribution of genes (population genetics)
•is the study of genetic variability in a population
*Extension of Mendelian genetics
•Populations are individuals of the same species that live in
the same locations
Exhibit variation in traits
•Examination of the assemblage of traits reveals genetic
information and shows the kind and proportion of alleles in a
population
5.2 U.7 Natural selection increases the frequency of characteristics
that make individuals better adapted and decreases the frequency
of other characteristics leading to changes within the species.
Genes and Populations
• Gene pool: The collection of genes in a population
Because diploids have only two versions of each gene, each has only a
small fraction of possible alleles in a population
• Genotype: The genetic makeup of an individual at a given locus, taking into
account the two possible alleles
Genotype frequencyGenotype frequency is the proportion of a given genotype in the
population
Allele frequencyAllele frequency refers to the proportion of a particular allele, such as A
or a
• Phenotype: the traits of an individual
Phenotype frequencyPhenotype frequency is the proportion of a given phenotype in the
population
Phenotype frequency is influenced by the dominance characteristic of
an allele
5.2 U.7 Natural selection increases the frequency of characteristics
that make individuals better adapted and decreases the frequency
of other characteristics leading to changes within the species.
Alleles and Population Genetics
• Although individuals are affected by the process of natural
selection, it is the makeup of the population that is critical for
determining the subsequent generations
• Changes in the gene pool refer to changes in the frequency of
the alleles
• If the allele frequencies in a population do not undergo
change over time, we say that the population is in genetic
equilibrium
5.2 U.7 Natural selection increases the frequency of characteristics
that make individuals better adapted and decreases the frequency
of other characteristics leading to changes within the species.
Warbler finch
Woodpecker finch
Small insectivorous
tree finch
Large
insectivorous
tree finch
Vegetarian
tree finch
Cactus finch
Sharp-beaked finch
Small ground
finch
Medium
ground finch
Large
ground finch
Insect eaters
Bud eater
Seed eaters
Cactus
eater
Warbler
finch
Treefinches
Ground
finches
Darwin’s finches
• Differences in beaks
– associated with eating different foods
– survival & reproduction of beneficial adaptations to foods
available on islands
5.2 A.1 Changes in beaks of finches on Daphne Major.
Darwin’s finches
• Darwin’s conclusions
– small populations of original South American finches landed
on islands
• variation in beaks enabled individuals to gather food
successfully in the different environments
– over many generations, the populations of finches changed
anatomically & behaviorally
• accumulation of advantageous traits in population
• emergence of different species
5.2 A.1 Changes in beaks of finches on Daphne Major.
Darwin’s finches
• Differences in beaks
allowed some finches to…
– successfully compete
– successfully feed
– successfully reproduce
• pass successful
traits onto their
offspring
5.2 A.1 Changes in beaks of finches on Daphne Major.
Changes on the island story *
https://whyevolutionistrue.files.wordpress.com/2014/08/05jpessa1-master675.jpg
Antibiotic resistance story*
http://www.blueplanetgreenliving.com/wp-content/uploads/2009/08/Pill-bottles.jpg
• Antibiotics kill bacteria directly or weaken
the bacteria so your immune system can
fight and destroy the invading pathogen.
• Some bacteria might not die because of
changes within their DNA. These changes
could be caused by mutations within their
genome or the transfer of an antibiotic
resistant gene from another bacterium.
• Resistance is more likely to occur if the
proper amounts of antibiotics aren’t taken
or if a patient doesn’t finish the
prescription.
• These resistant bacteria will survive and
reproduce, creating more identical resistant
bacteria.
• These resistant bacteria will make the
person sick again in the future.
• However if given the same antibiotic, these
bacteria will no longer be destroyed.
• Another antibiotic can be prescribed to kill
these new resistant bacteria.
• Resistance can be passed onto other
pathogenic bacteria, creating more species
of resistant bacteria.
5.2 A.2 Evolution of antibiotic resistance in bacteria.
5.3 Classification of biodiversity
• Essential idea: Species are named and classified using an
internationally agreed system.
Understandings
Statement Guidance
5.3 U.1 The binomial system of names for species is universal
among biologists and has been agreed and developed
at a series of congresses.
5.3 U.2 When species are discovered they are given scientific
names using the binomial system.
5.3 U.3 Taxonomists classify species using a hierarchy of taxa.
5.3 U.4 All organisms are classified into three domains. Archaea, eubacteria and eukaryote should be used
for the three domains. Members of these domains
should be referred to as archaeans, bacteria and
eukaryotes. Viruses are not classified as living
organisms.
5.3 U.5 The principal taxa for classifying eukaryotes are
kingdom, phylum, class, order, family, genus and
species.
5.3 U.6 In a natural classification, the genus and accompanying
higher taxa consist of all the species that have evolved
from one common ancestral species.
5.3 U.7 Taxonomists sometimes reclassify groups of species
when new evidence shows that a previous taxon
contains species that have evolved from different
ancestral species.
5.3 U.8 Natural classifications help in identification of species
and allow the prediction of characteristics shared by
species within a group.
Applications and Skills
Statement Guidance
5.3 A.1 Classification of one plant and one animal
species from domain to species level.
5.3 A.2 Recognition features of bryophyta, filicinophyta,
coniferophyta and angiospermophyta.
Students should know which plant phyla
have vascular tissue, but other internal
details are not required.
5.3 A.3 Recognition features of porifera, cnidaria,
platylhelmintha, annelida, mollusca, arthropoda
and chordata.
Recognition features expected for the
selected animal phyla are those that are
most useful in distinguishing the groups
from each other and full descriptions of the
characteristics of each phylum are not
needed.
5.3 A.4 Recognition of features of birds, mammals,
amphibians, reptiles and fish.
5.3 S.1 Construction of dichotomous keys for use in
identifying specimens.
• Formal two naming system of classifying species.
• Originally developed by Swedish naturalist
Carolus Linnaeus.
• Currently, many scientists and specialists meet in
a series of International Congresses of Zoology
which meet in different cities every 4 years
• They meet to discuss their findings regarding
genetics, animal behavior and classification
• A main topic is the binomial nomenclature system
and decisions regarding the classification of new
organisms or the reclassification of old ones
because of new evidence regarding ancestry.
• The main objectives with regards to using the
binomial nomenclature system developed are to
• Make sure each organism has a unique name
that cannot be confused with another
organism
• The name can be universally understood
regardless of the nationality or culture that is
using the name
• Stability exists within the system by not
allowing people to change the name without
5.3 U.1 The binomial system of names for species is universal among
biologists and has been agreed and developed at a series of congresses.
http://iszscon2012.haifa.ac.il/
http://www.ibc2017.cn/index.html
5.3 U.2 When species are discovered they are given scientific names using the
binomial system.
5.3 U.2 When species are discovered they are given scientific names
using the binomial system.
https://d2m2lkhawsaq1u.cloudfront.net/uploads/trial
/1128697-charles-darwin.jpg_1396593169.png
5.3 U.2 When species are discovered they are given scientific names
using the binomial system.
5.3 U.2 When species are discovered they are given scientific names
using the binomial system.
5.3 U.2 When species are discovered they are given scientific names
using the binomial system.
5.3.U3 Taxonomists classify species using a hierarchy of taxa.
5.3.U5 The principal taxa for classifying eukaryotes are kingdom, phylum, class, order, family,
genus and species.
Not all domains use the same taxa – the
example above is for Eukaryotes
5.3 U.5 The principal taxa for classifying eukaryotes are kingdom,
phylum, class, order, family, genus and species.
5.3 U.5 The principal taxa for classifying eukaryotes are kingdom,
phylum, class, order, family, genus and species.
Dear
King
Philip
Come
Over
For
Good
Spaghetti
• Revision of the classification system
lead to a new level of taxon called
domains.
• The Prokaryotae are now divided into
two domains, the Bacteria and the
Archaea
• These are organisms that do not have
a membrane bound nucleus and their
DNA is not associated with proteins.
• The Bacteria domain consists of
Eubacteria and archaebacteria are
classified as Archaeans.
• The Eukarya domain includes
eukaryotes, or organisms that have a
membrane bound nucleus. This
domain is further subdivided into the
kingdoms Protista, Fungi, Plantae,
and Animalia
• Groups organisms primarily based on
differences in
ribosomal RNA structure. Ribosomal
RNA is a molecular building block
for ribosomes.
5.3 U.4 All organisms are classified into three domains.
Archaea Bacteria (Eubacteria) Eukaryota
Examples are often, but always,
extremophiles:
•Sulfolobus sp. grow in volcanic
springs with optimal growth
occurring at pH 2-3 and
temperatures of 75-80 °C
•Halobacterium sp. (lives in water
with high salt concentrations)
• Staphylococcus aureus (above)
can cause skin infections and
respiratory disease
• Cyanobacteria sp. Are
photosynthetic
• Rhizobium sp. live symbiotically
with plants and fix nitrogen
Includes several kingdoms
including fungi, animals and plants.
Examples range from algae to
Humans.
• No nuclear membrane
• RNA and biochemistry distinct
from bacteria
• No nuclear membrane • Nuclear membrane
Features and examples of each domain:
http://en.wikipedia.org/wiki/Three-domain_system
5.3 A.1 Classification of one plant and one animal species from domain to species level.
Learn a mnemonic, one animal example and one plant example:
Domain Does Eukaryota Eukaryota
Kingdom Kennard Animalia Plantae
Phylum Play Chordata Spermatophyta
Class Classical Mammalia Eudicotyledons
Order Or Primates Magnoliidae
Family Folk Hominidae Ranunculales
Genus Guitar Homo Ranunculus
Species Songs? Sapiens Acris
Human
Meadow Buttercup
http://commons.wikimedia.org/wiki/File:Masai_Woman.jpg http://commons.wikimedia.org/wiki/File:Ranunculus_macro.jpg
Dear
King
Philip
Come
Over
For
Good
Spaghetti
Plant Kingdom Diversity
The plant kingdom has within it 4 major groups:
• Bryophytes (mosses & liverworts)
• Filicinophytes (Ferns)
• Coniferophytes (Conifers & Pines)
• Angiospermophytes ( Flowering Plants)
5.3 A.2 Recognition features of bryophyta, filicinophyta, coniferophyta
and angiospermophyta.
5.3 A.2 Recognition features of bryophyta, filicinophyta, coniferophyta
and angiospermophyta.
1. Bryophytes 3. Coniferophytes
4. Angiosperms
2. Filicinophytes
5.3 A.2 Recognition features of bryophyta, filicinophyta, coniferophyta
and angiospermophyta.
Leaves, roots and stems Vascular
tissue
Reproductive structures
Bryophytes
(mosses, hornworts
and liverworts)
• No roots, but structures similar to
root hairs called rhizoids
• Mosses have simple leaves and
stems
• Liverworts have a flattened thallus
None Spores produced in
capsules, which develop
at the end of a stalk
Filicinophytes
(ferns)
• Roots present
• Short non-woody stems.
• Leaves usually divided into pairs of
leaflets
Yes Spores produced in
sporangia on the
underside of the leaves
Coniferophytes
(conifer shrubs and
trees)
• Roots, present
• Woody stems
• Leaves usually narrow with a thick
waxy cuticle
Yes Seeds develop from
ovules in female cones.
Male cones produce
pollen.
Angiospermophytes
(flowering plants)
• Leaves and roots variable in
structure
• Stems maybe woody (shrubs and
trees)
Yes Seeds develop from
ovules in ovaries, inside
flowers. Seeds are
dispersed by fruits which
develop from the
ovaries.
5.3 A.4 Recognition of features of birds, mammals, amphibians, reptiles
and fish.
The most familiar
animal from the
chordata phyla belong
the to subphylum
vertebrata. Can you
match the different
classes with the
images?
http://commons.wikimedia.org/
Fish (Agnatha,
Chondrichthyes, Osteichthyes)
Birds
(aves)
Mammals
(mammalia)
Amphibians
(amphibia)
Reptiles
(reptilia)
5.3 A.4 Recognition of features of birds, mammals, amphibians, reptiles and fish.
Limbs Gas Exchange Reproduction Other features
Mammals 4 Pentadactyl
limbs
Lungs with
alveoli
• Internal fertilization
• Give birth to live young
• Mammary glands secrete
milk
• Hairs growing from the skin
• Teeth including living tissue
birds 4 Pentadactyl
limbs, 2 limbs
modified as
wings
Lungs with
parabronchial
tubes
• Internal fertilization
• Hard shells around the
eggs
• Feathers growing from skin
• Beak but no teeth
reptiles 4 Pentadactyl
limbs
Lungs with
extensive
folding
• Internal fertilization
• Soft shells around eggs
• Dry scaly impermeable skin
• Simple teeth – no living
tissue
amphibians 4 Pentadactyl
limbs
Simple lungs
with small
internal folds
and moist
surfaces
• External fertilization in
water
• Protective jelly around
eggs
• Larval stage lives in water
• Soft moist permeable skin
fish Fins Gills • External fertilization in
most species
• Scales grow from the skin
• with a single gill slit
• Swim bladder for buoyancy
A summary of key features that can be used to distinguish between the vertebrate
classes
5.3.A3 Recognition features of porifera, cnidaria, platylhelmintha,
annelida, mollusca, arthropoda and chordata.
chordata
porifera
cnidaria platylhelmintha
annelida mollusca
arthropoda
What about other phyla? Can
you match the names with the
images?
Phylum: Porifera (sponges)
https://bioelevenncuevas.wordpress.com/phylum-porifera/
Phylum: Cnidaria
Phylum: Platyhelminthes (flatworms)
 Phylum: Annelida (segment worms)
Phylum: Mollusca
(Snails, slugs and octopus)
Phylum: Arthropoda (Insects, Crustaceans,
Spiders, Scorpions, Millipedes)
http://animals-pics.com/bird-eating-tarantula-size/33/go-back-gallery-for-goliath-bird-eating-spider-size-comparison/
Phylum: Chordata
https://animalterritory.wordpress.com/tag/wildlife/
5.3 A.3 Recognition features of porifera, cnidaria, platylhelmintha,
annelida, mollusca, arthropoda and chordata.
Chordata (animals with a
backbone) should be easy.
Try using the key to help
identify the rest of the
phyla.
5.3.A3 Recognition features of porifera, cnidaria, platylhelmintha,
annelida, mollusca, arthropoda and chordata.
Can you match the phyla with
the images?
chordata porifera
cnidaria
platylhelmintha
annelida
mollusca
arthropoda
5.3 A.3 Recognition features of porifera, cnidaria, platylhelmintha,
annelida, mollusca, arthropoda and chordata.
Symmetry Segmentation Digestive tract Other features
porifera
(sponges)
None None No mouth or anus • Porous
• attached to rocks
• Filter feeder
cnidaria
(corals, jellyfish)
Radial None Mouth but no anus • Stinging cells
• Tentacles
platylhelmintha
(flatworms)
Bilateral None Mouth but no anus • Flattened body
annelida
(earthworms,
leeches)
Bilateral Very
segmented
Mouth and anus • bristles often present
Mollusca
(oyster, snails,
octopus)
Bilateral Non-visible
segmentation
Mouth and anus • Most have shell made of
CaCO3
Arthropoda
(ant, scorpion, crab)
Bilateral Segmented Mouth and anus • Exoskeleton
• jointed appendages
Chordata
(fish, birds,
mammals)
Bilateral Segmented Mouth and anus • notochord
• hollow dorsal nerve cord
• (some have ) pharyngeal slits
A summary of key features that can be used to distinguish between animal phyla
5.3 S.1 Construction of dichotomous keys for use in identifying
specimens.
5.3.S1 Construction of dichotomous keys for use in identifying specimens.
5.3.U.6 In a natural classification, the genus and accompanying higher taxa consist of
all the species that have evolved from one common ancestral species.
Natural classification groups together species that share a common ancestor from
which they evolved. This is called the Darwinian principle of common descent
.
• Members of a group share important
attributes or 'homologous’ traits that are
inherited from common ancestors. For
example Lions share more traits with
Jaguars than with Leopards.
• Grouping together birds, bats and bees
because they fly would be an artificial
classification as they do not share a
common ancestor and evolved the ability
to fly independently.
• Natural classification is not
straightforward as convergent evolution
can make distantly related organisms
appear similar and adaptive radiation
can make similar organisms appear very
different from each other.
5.3 U.7 Taxonomists sometimes reclassify groups of species when new evidence shows that a
previous taxon contains species that have evolved from different ancestral species.
• Historically classification
systems have been revised
repeatedly based on emerging
evidence.
• Recent evidence from genetic
studies of ribosomal RNA has
shown that "prokaryotes" are
far more diverse than anyone
had suspected.
• Ribosomal RNA is found in all
organisms and evolves slowly
so is a good way to track
evolution over long time
periods.
Previously in the second half of the 20th century
all living organisms were classified into five
kingdoms. This included prokaryotes being placed
in one kingdom and eukaryotes were split-up into
the remaining four kingdoms.
http://academic.pgcc.edu/~kroberts/Lecture/Chapter%204/04-23_WhittakerTax_L.jpg
5.3.U.8 Natural classifications help in identification of species and allow
the prediction of characteristics shared by species within a group.
If a new species of Ant is discovered
then scientists would predict that the
species should possess amongst other
characteristics six jointed legs, a head,
thorax, abdomen, elbowed antennae,
‘antibiotic’ secretory glands. If the
species does not match the expected
set of characteristics this brings into
question either the classification of the
species or of Ants as a family.
Natural classification is very helpful
when dealing with new species:
“New species of legless
amphibian discovered in remote
Cambodian rainforest”
http://www.abc.net.au/news/2015-01-17/new-species-of-legless-
amphibian-found-in-cambodia/6022048
Dichotomous keys can be used to help
identify the species. The keys can place a
specimen with the most closely related
species, genus, family or phyla using
natural classification. To what level of
classification a specimen can be placed
depends on how unique it is.
10.3 Gene Pools and Speciation
Essential idea: Gene pools change over time.
Understandings
Statement Guidance
10.3 U.1 A gene pool consists of all the genes
and their different alleles, present in
an interbreeding population.
10.3 U.2 Evolution requires that allele
frequencies change with time in
populations.
Punctuated equilibrium implies long
periods without appreciable change and
short periods of rapid evolution.
10.3 U.3 Reproductive isolation of populations
can be temporal, behavioral or
geographic.
10.3 U.4 Speciation due to divergence of
isolated populations can be gradual.
10.3 U.5 Speciation can occur abruptly.
Applications and Skills
Statement Utilization
10.3 A.1 Identifying examples of directional,
stabilizing and disruptive selection.
10.3 A.2 Speciation in the genus Alliumby
polyploidy.
Many crop species have been created to be
polyploid. Polyploidy increases allelic
diversity and permits novel phenotypes to
be generated. It also leads to hybrid vigor.
10.3 S.1 Comparison of allele frequencies of
geographically isolated
populations.
10.3 U1 A gene pool consists of all the genes and their different alleles,
present in an interbreeding population
Speciation
•A species a group of individuals who
produce offspring after mating. This
make individual of that species
reproductively isolated from other
species.
•A gene pool is the set of all genes, in
an interbreeding population.
http://data1.whicdn.com/images/63849/large.jpghttp://arkansasagnews.uark.edu/monarchs95.jpg
10.3 U.2 Evolution requires that allele frequencies change with time in
populations.
If the allele frequencies of a population are not in equilibrium then the
frequencies are changing or evolving. The following processes facilitate evolution
by either adding or removing genetic variation from a population:
•Mutation
•Migration (Gene Flow)
•Genetic Drift
•Unequal Mating and/or Fertilization Success (Sexual Selection)
•Unequal Viability (Natural Selection)
Gene pool: The collection of genes in a population
Because diploids have only two versions of each gene, each has only a small fraction
of possible alleles in a population
Genotype: The genetic makeup of an individual at a given locus, taking into account the
two possible alleles
Genotype frequency is the proportion of a given genotype in the population
Allele frequency refers to the proportion of a particular allele, such as A or a
Phenotype: the traits of an individual
Phenotype frequency is the proportion of a given phenotype in the population
Phenotype frequency is influenced by the dominance characteristic of an allele
10.3 U.2 Evolution requires that allele frequencies change with time in
populations.
Frequencies add up to 1.0
e.g. — a population has two alleles, A and a with A is dominant over a
The allele frequencies must sum to 1.0
(frequency of A) + (frequency of a) = 1.0
The genotype frequencies must sum to 1.0
(frequency of AA) + (frequency of Aa) + (frequency of aa) = 1.0
The phenotype frequencies must sum to 1.0
(frequency of AA and Aa phenotype) + (frequency of aa phenotype) = 1.0
Imagine 2 alleles, A and a
p is the frequency of A q the frequency of a
So, p + q = 1
The mathematical equivalent of a random mating can be given by multiplying this
relationship by itself
Therefore, (p + q)2
= 1 = p2
+ 2pq + q2
p2
= frequency of AA 2pq = frequency of Aa q2
= frequency of aa
Given this condition, we can always work out the frequencies of each allele in a sexual
population.
10.3 U.2 Evolution requires that allele frequencies change with time in
populations.
10.3 U.2 Evolution requires that allele frequencies change with time in
populations.
•Evolution is the cumulative change in allele frequency or heritable characteristics in a
population over time
•The cumulative change can occur as a result of genetic changes and/or selective
pressures which favor certain heritable characteristics over other less favorable
characteristics
•These populations have to be reproductively isolated, thus preventing gene flow
between populations
P equals the dominant gene
Q equals the recessive gene
10.3 S.1 Comparison of allele frequencies of geographically isolated
populations
• Cod fish have a gene that codes for an
integral membrane protein called
pantophysin.
• Two alleles of the gene, PanIA
and PanIB
,
code for versions of pantophysin, that
differ by four amino acids in one region of
the protein.
• Samples were collected from 23 locations
in the North Atlantic (numbered 1–23 in
each pie chart), on the map to the right.
• The frequency of an allele can vary from
0.0 to 1.0.
PanIA
light grey sectors of the pie charts show
the allele frequency for the PanIA
gene
PanIB
black sectors show the allele frequency
for the PanIB
gene.
• The biggest difference in allele frequency
occurs in the Cod fish isolated at the two
extremes of the map.
10.3 U3 Reproductive isolation of populations can be temporal,
behavioral or geographic.
• Reproductive isolation of populations occurs when barriers or
mechanisms prevent two populations from interbreeding, keeping
their gene pools isolated from each other.
• There are different types of reproductive isolation including
temporal, behavioral, and geographic
How and why do new species originate?
• Species are created by a series of
evolutionary processes
– populations become isolated
• geographically isolated
• reproductively isolated
– isolated populations
evolve independently
• Isolation
– allopatric
• geographic separation
– sympatric
• still live in same area
10.3 U3 Reproductive isolation of populations can be temporal,
behavioral or geographic.
10.3 U3 Reproductive isolation of populations can be temporal,
behavioral or geographic.
Temporal isolation
•Species that breed during different times
of day, different seasons, or different
years cannot mix gametes
– reproductive isolation
– sympatric speciation
• “same country”
Eastern Spotted Skunk (Top Right)
& Western Spotted Skunk (Bottom
Right) overlap in range but Eastern
mates in late winter & Western
mates in late summer
Eastern Spotted Skunk (Top Right)
& Western Spotted Skunk (Bottom
Right) overlap in range but Eastern
mates in late winter & Western
mates in late summer
http://upload.wikimedia.org/wikipedia/
commons/f/f2/Spilogale_putorius_(2).jp
g
http://upload.wikimedia.org/wikipe
dia/commons/9/98/Spilogale_gracili
s_amphiala.jpg
10.3 U3 Reproductive isolation of populations can be temporal,
behavioral or geographic.
Behavioral Isolation
•In most animal species, members of the two sexes must first search for each other
and come together.
•Unique behavioral patterns & rituals isolate species
 identifies members of species attract mates of same species
 courtship rituals, mating calls
 reproductive isolation
Blue footed boobies mate
only after a courtship display
unique to their species
Blue footed boobies mate
only after a courtship display
unique to their specieshttp://upload.wikimedia.org/wikipedia/commo
ns/a/aa/Bluefooted_Booby_Comparison.jpg
So…what is a species?
Western MeadowlarkWestern Meadowlark
Eastern Meadowlark
Distinct species:
songs & behaviors are different
enough to prevent interbreeding
Distinct species:
songs & behaviors are different
enough to prevent interbreeding
10.3 U3 Reproductive isolation of populations can be temporal,
behavioral or geographic.
10.3 U3 Reproductive isolation of populations can be temporal,
behavioral or geographic.
Geographic Isolation
Species occur in different areas
– physical barrier
– allopatric speciationallopatric speciation
• “other country”
Harris’s Antelope
Squirrel inhabits the
canyon’s south rim
(L). Just a few miles
away on the north
rim (R) lives the
closely related
White-tailed
Antelope Squirrel
Harris’s Antelope
Squirrel inhabits the
canyon’s south rim
(L). Just a few miles
away on the north
rim (R) lives the
closely related
White-tailed
Antelope Squirrel
10.3 A.1 Identifying examples of directional, stabilizing and disruptive
selection.
• If no selection occurs to a population (for
whatever means), population doesn’t
change with succeeding generations.
• If selection pressure is applied then those
not receiving selection pressure tend to
predominate…
 Stabilizing: the extremes are selected
against; center stays same and grows
in numbers
 Directional: one tail of the distribution
is selected against and the opposite
tail grows in numbers
 Disruptive: a mid-group is selected
against; the tails are allowed to
predominate and grow compared to
middle
As an example: in Humans we have
selected for a babies birth weight. This
protects the mother and the babies
health.
10.3 A.1 Identifying examples of directional, stabilizing and disruptive
selection.
Directional Selection:
•Selection that removes
individuals from one end
of a phenotypic
distribution and thus
causes a shift in the
distribution towards the
other end.
•Over time, the favored
extreme will become
more common and
the other extreme will be
less common or lost.
10.3 A.1 Identifying examples of directional, stabilizing and disruptive
selection.
Stabilizing Selection:
A type of selection that removes
individuals from both ends of a
phenotypic distribution, thus
maintaining the same distribution
mean. This occurs when natural
selection favors
the intermediate phenotypes.
Over time, the intermediate
states become more common and
each extreme variation will
become less common or lost.
Same mouse example where
medium colored fur is favored
over dark or light fur color.
10.3 A.1 Identifying examples of directional, stabilizing and disruptive
selection.
Disruptive Selection:
•Removes individuals from the
center of a phenotype. This
occurs when natural
selection favors both ends of the
phenotypic variation.
•Over time, the two extreme
variations will become more
common and the intermediate
states will be less common or
lost.
•This can lead to two new
species.
10.4 U.4 Speciation due to divergence of isolated populations can be
gradual.
• Speciation can occur gradually over long periods of time, with several intermediate
forms in between species leading to today’s current species. This can be seen in
some of the more complete fossil records, like the whale or the horse.
• In some species, large gaps were evident for certain species in the fossil record. This
imperfections in the fossil record, maybe the result of transitional species have not
been discovered yet or abrupt speciation.
http://www.sivatherium.narod.ru/library/Dixon/pics_01/p0010_e.gif
Gradualism
•Gradual divergence over long spans of
time
– assume that big changes occur as
the accumulation of many small
ones
10.4 U.4 Speciation due to divergence of isolated populations can be
gradual.
http://cnx.org/resources/22b17901c8ce6510b03e2f89df0bc072/graphics1.png
10.3 U.5 Speciation can occur abruptly.
Punctuated Equilibrium
Species remain stable for long
periods of time (several million
years) interrupted by periods of
significant change, during which
time a new species may evolve.
 rapid bursts of change
 long periods of little or no
change
 species undergo rapid change
when they 1st
bud from
parent population
10.3 U.5 Speciation can occur abruptly.
http://static.skynetblogs.be/media/130852/12.11.jpg
Over 75% of all life on Earth was lost during the late
Devonian mass extinction which took place about 375-359
million years ago
10.3 U.5 Speciation can occur abruptly.
https://evolutionliteracy.files.wordpress.com/2014/09/t
rilobites-evolution-literacy-g-paz-y-mino-c-photo.jpg
Over 97% of all life on Earth was lost during theOver 97% of all life on Earth was lost during the
End-Permian mass extinction which took place 252End-Permian mass extinction which took place 252
million years agomillion years ago
10.3 U.5 Speciation can occur abruptly.
http://www.gohobby.com/wp-
content/uploads/2012/11/Velociraptor-
Jurassic-Park.jpeg
Over 50% of all life on Earth was lost during the TriassicOver 50% of all life on Earth was lost during the Triassic
mass extinction which took place 201 million years agomass extinction which took place 201 million years ago
10.3 U.5 Speciation can occur abruptly.
https://evolutionliteracy.files.wordpress.com/2014/09/t
rilobites-evolution-literacy-g-paz-y-mino-c-photo.jpg
Over 80% of all life on Earth was lost during the endOver 80% of all life on Earth was lost during the end
Cretaceous. The mass extinction took place 252 millionCretaceous. The mass extinction took place 252 million
years agoyears ago
Gradualism
Punctuated Equilibrium
10.3 U.5 Speciation can occur abruptly.
10.3 A.2 Speciation in the genus Alliumby polyploidy.
• Polyploidy organisms contain more
than two pairs of the same
chromosomes.
• A likely advantage is it allows
for additional raw materials (i.e.
DNA, genes) for evolution. Every
gene is theoretically free to
evolve without substantial negative
effect.
• Polyploidy plants tend to be
larger. The reproductive organs
and fruit, in particular, are usually
enlarged in polyploidy. The likely
mechanism for this is simple: more
DNA results in a larger nucleus,
which results in larger cells,
especially in the reproductive
organs. http://www.vims.edu/newsandevents/topst
ories/_images/diploid_triploid_250.jpg
Oysters
10.3 A.2 Speciation in the genus Alliumby polyploidy.
• The genus Allium comprises monocot
flowering plants and includes the
onion, garlic, chives, scallion, shallot,
and the leek.
• In many of these species of plants,
chromosome doubling has created a
large number of different phenotypes.
• This results is a number of
reproductively isolated but similar
populations.
Examples: of this are seen in 7 natural
populations Allium grayi. They showed
• tetraploid (2n=32)
• pentaploid (2n=40)
• hexaploid (2n=48) http://i.dailymail.co.uk/i/pix/2008/09/12/article-1054890-
029CF17900000578-854_233x364.jpg
10.3 A.2 Speciation in the genus Alliumby polyploidy.
Allium grayi tetraploid (2n=32)
tetraploid (2n=32)
10.3 A.2 Speciation in the genus Alliumby polyploidy.
pentaploid (2n=40)
10.3 A.2 Speciation in the genus Alliumby polyploidy.
http://upload.wikimedia.org/wikipedia/commons/7/79/Allium_tulipifolium_(inflorescence).jpg
hexaploid (2n=48)
5.4 Cladistics
Essential idea: The ancestry of groups of species can be deduced by comparing their base or amino acid
sequences.
Understandings
Statement Guidance
5.4.U.1 A clade is a group of organisms that have evolved from a common
ancestor.
5.4.U.2 Evidence for which species are part of a clade can be obtained from
the base sequences of a gene or the corresponding amino acid
sequence of a protein.
5.4.U.3 Sequence differences accumulate gradually so there is a positive
correlation between the number of differences between two species
and the time since they diverged from a common ancestor.
5.4.U.4 Traits can be analogous or homologous.
5.4.U.5 Cladograms are tree diagrams that show the most probable sequence
of divergence in clades.
5.4.U.6 Evidence from cladistics has shown that classifications of some groups
based on structure did not correspond with the evolutionary origins
of a group or species.
Applications and Skills
Statement Guidance
5.4.A.1 Cladograms including humans and other primates.
5.4.A.2 Reclassification of the figwort family using evidence from
cladistics.
5.4 S..1 Analysis of cladograms to deduce evolutionary relationships.
5.4 U.1 A Clade is a group of organisms that have
evolved from a common ancestor
• Cladistics (From the
ancient Greek for
"branch") is a method
of classifying species
of organisms into
groups called clades,
which consist of an
ancestor organism
and all its
descendants (and
nothing else).
5.4 U.1 A Clade is a group of organisms that have
evolved from a common ancestor
http://upload.wikimedia.org/wikipedia/commons/6/6b/Lutjanus_kasmira_school.jpg
http://upload.wikimedia.org/wikipedia/commons/2/2b/Tiktaalik_roseae_life_restor.jpg
5.4 U.1 A Clade is a group of organisms that have
evolved from a common ancestor
TiktaalikTiktaalik
•Represents the evolutionary transitionRepresents the evolutionary transition
from fish to amphibians. And as such thefrom fish to amphibians. And as such the
common ancestor to every animal in thecommon ancestor to every animal in the
Clade after the fish.Clade after the fish.
5.4 U.1 A Clade is a group of organisms that have
evolved from a common ancestor
http://upload.wikimedia.org/wikipedia/commons/1/19/Caerulea3_crop.jpg
5.4 U.1 A Clade is a group of organisms that have
evolved from a common ancestor
http://upload.wikimedia.org/wikipedia/commons/d/dc/Furcifer_pardalis_-Z%C3%BCrich_Zoo-8a.jpg
Archaeopteryx is a famous example transitional fossils – it gives evidence for the evolution of
birds from reptiles like dinosaurs.
http://commons.wikimedia.org/wiki/File:Archaeopteryx_lithographica_%28Berlin_specimen%29.jpg
http://commons.wikimedia.org/wiki/File:Archaeopteryx_NT.jpg
Bird features:
•feathers
Dinosaur features include:
•jaws with sharp teeth
•three fingers with claws
•long bony tail
5.4 U.1 A Clade is a group of organisms that have
evolved from a common ancestor
5.4 U.1 A Clade is a group of organisms that have
evolved from a common ancestor
http://upload.wikimedia.org/wikipedia/commons/0/03/Mountain_Bluebird.jpg
Likewise, birds share the
common characteristics of
feathers
They too form a clade
Mammals have the unique homologousMammals have the unique homologous
characteristic of producing milkcharacteristic of producing milk
They form a cladeThey form a clade
5.4 U.1 A Clade is a group of organisms that have
evolved from a common ancestor
http://images.nationalgeographic.com/wpf/media-
live/photos/000/334/cache/freshwater-mammals-hippo_33402_600x450.jpg
For example, Fish,
Amphibians, Reptiles,
Birds, Mammals, and
all descendants from
a common ancestor to
form a clade
5.4 U.1 A Clade is a group of organisms that have
evolved from a common ancestor
http://bridgeurl.com/xrmmmk/all
Vertebrate
Hair Shelled
eggs
Amniotic Egg
Four Limbs
Bony Skeleton
Each clade
is determined by
common characteristics
of its members that are
different from that of the
other species from which
it has diverged
Morphology (or there outward appearance) is only
one part of the story in cladistics. DNA and the
amino acids they code for are the primary basis for
grouping organisms into clades and determining
likely paths of evolutionary descent
Ex: Crocodiles are more closely related to birds than lizards…
5.4 U.2 Evidence for which species are part of a clade can be obtained
from the base sequences of a gene or the corresponding amino acid
sequence of a protein.
All known organisms use
DNA as genetic material
The genetic code is
universal. Gene
sequences inserted in
different organisms
express the same proteins
5.4 U.2 Evidence for which species are part of a clade can be obtained
from the base sequences of a gene or the corresponding amino acid
sequence of a protein.
The same 20 amino
acids are used to
make all proteins
http://commons.wikimedia.org/wiki/File:Protein_primary_structure.svg
Taking the example of the protein cytochrome c.
It is not identical in all species because single
point mutations in the DNA that codes for it can
lead to different amino acids making up the
protein.
Both humans and chimpanzees have identical
cytochrome c molecules, while rhesus monkeys
share all but one of the amino acids.
This suggests that humans and chimpanzees are
more closely related to each other than to rhesus
monkeys.
http://www.flickr.com/photos/stuffinhergoose/571672799
5.4 U.2 Evidence for which species are part of a clade can be obtained
from the base sequences of a gene or the corresponding amino acid
sequence of a protein.
I didn’t want to beI didn’t want to be
closely related toclosely related to
stinking humansstinking humans
anywayanyway!
Molecular biology
Protein and DNA Structures Reveal Associations Between
Organisms
• Nuclear DNA code is highly conserved across phyla – although there
are variations, there are no alternate codes
• Nuclear DNA can be used to show associations between organisms
when comparing very long suspected evolutionary times
• Ribosomal RNA and mitochondrial DNA & RNA more useful when
comparing shorter evolutionary times… they are inherently more
variable over time because they are subjected to fewer selection
pressures.
• Small changes are seen in the DNA code between closely related
species.
• Monkeys, apes, and humans clearly have common ancestry
5.4 U.3 Sequence differences accumulate gradually so there is a positive
correlation between the number of differences between two species
and the time since they diverged from a common ancestor.
Base Sequence Comparisons
• Divergence (difference) in
nucleotide base sequence
allows us to draw
relationships between
different organisms.
• Here, differences in
nucleotide base sequence
of humans and other
primates compared
• Chimps closest, spider
monkeys most dissimilar
5.4 U.3 Sequence differences accumulate gradually so there is a positive
correlation between the number of differences between two species
and the time since they diverged from a common ancestor.
Molecular Clocks
• DNA undergoes relatively
steady rates of mutation over
time
• More divergence in structure
is assumed to mean more
time has passed
• Changes in homologous DNA
from different species allows
biologists to construct
molecular clocks based on the
rates of change in known and
homologous DNA
• This can aid in the dating of
branching points in the
evolutionary record
5.4 U.3 Sequence differences accumulate gradually so there is a positive
correlation between the number of differences between two species
and the time since they diverged from a common ancestor.
The assumption is that these changes occur at a regular rate. (which
may not always be the case)
Therefore if species A had 5 differences from species B and 10
differences from species C, then the lineages for A and C must have
split twice as long ago as for A and B
C B A
Time
spines
tendrils
succulent leaves
colored leaves
Homologous structures
leaves
needles
5.4 U.4 Traits can be analogous or homologous.
Analogous structures
• Separate evolution of structures
similar functions
similar external form
different internal structure &
development
different origin
no evolutionary relationship
Solving a similar problem with a similar solutionSolving a similar problem with a similar solution
http://upload.wikimedia.org/wikipedia/commons/5/5c/Male_-
_black_phase_-_short_tail_hawk.JPG
http://www.redorbit.com/media/uploads/2004/1
0/40_03aa91083d476b07bcc9228e134d6c56.jpg
Convergent evolution
5.4 U.4 Traits can be analogous or homologous.
Convergent evolution
• Fish: aquatic vertebratesvertebrates
• Humpback Whale: aquatic mammalsmammals
similar adaptations to life in the sea
not closely related
5.4 U.4 Traits can be analogous or homologous.
Convergent evolution
• Flight evolved in 3 separate
animal groups
– evolved similar “solution” to
similar “problems”
– analogous structuresanalogous structures
http://upload.wikimedia.org/wikipedia/commons
/7/77/Big-eared-townsend-fledermaus.jpg
http://upload.wikimedia.org/wikipedia/commons/e/e0/
5.4 U.4 Traits can be analogous or homologous.
5.4.5 Cladograms are tree diagrams that show the most
probable sequence of divergence in clades.
• These two cladograms are identical (although they don’t look it)
• The shape and the order of the terminal nodes does not matter.
• The only information to be gathered from the cladograms below is the order of
nesting of sister clades and the relative relatedness of species
http://commons.wikimedia.org/wiki/File:Identical_cladograms.svg
Human HumanChimp ChimpGorilla Gorilla
Root
Terminal nodes Sister clades: have a
common ancestor
Out group: Defines
the ancestral
characters
Nodes:
Common ancestors
http://www.studentsoftheworld.info/infopays/photos/PER/orig/lamas.jpg
5.4 U.6 Evidence from cladistics has shown that classification of some
groups based on structure did not correspond with the evolutionary
origins of a group or species.
http://www.scratchwireless.com/pad/wp-content/uploads/2015/02/SheepFlock.jpg
5.4 U.6 Evidence from cladistics has shown that classification of some
groups based on structure did not correspond with the evolutionary
origins of a group or species.
http://ianadamsphotography.com/news/wp-content/uploads/2014/12/Bactrian-Camels-the-Wilds.jpg
5.4U.6 Evidence from cladistics has shown that classification of some
groups based on structure did not correspond with the evolutionary
origins of a group or species.
Evolutionary Links
Classification allows us to see evolutionary relationships. Organisms
that are grouped together share a lot of similar features (homologous
structures). These shared characteristics help us see how organisms
have evolved from a common ancestor. HOWEVER, morphology (or
there outward appearance) has its limitations in terms of evolutionary
classification and DNA/ Amino Acid evidence is now far more accurate
and trustworthy…
http://www.flickr.com/photos/doug88888/3458057235/http://www.flickr.com/photos/mrapplegate/2423991076/
e.g. Llamas were
originally compared to
sheep but a study of
their genetics later
placed them in the
camel family
5.4 U.6 Evidence from cladistics has shown that classification of some
groups based on structure did not correspond with the evolutionary
origins of a group or species.
This is part of a molecular phylogeny of all of the
living primates. It clearly shows chimpanzees (Pan)
as more closely related to humans than to gorillas.
It was made by comparing 34,927 base pairs
sequenced from 54 genes taken from each
of a single species in each genus.
5.4 U.7 Analyze cladograms including humans and other primates.
5.4 S.1 Analyze cladograms to deduce evolutionary relationships.
1
2
3
DCBA
Which two species
are most closely-
related by evolution?
Which node
represents the
earliest speciation /
divergence?
Which species is D
more closely related
to; A or B?
Characters Shark Frog Kangaroo Human
Vertebrae X X X X
Two pairs of limbs X X X
Mammary glands X X
Placenta X
1) Compile a table of the characters being compared
Modified from:
http://www.bu.edu/gk12/eric/cladogram.pdf
2) Use the data to construct
a Venn diagram,
Start with the
characteristic
shared by all
taxa in the
biggest circle
and work
inwards
Shark Frog Kangaroo Human
Mammary Glands
Lungs
Vertebrae
Placenta
3) Convert the Venn diagram into a cladogram
Characters Sponge Jellyfish Flatworm Earth-
worm
Snail Fruit fly Starfish Human
Cells with flagella X X X X X X X X
Symmetry X X X X X X X
Bilateral symmetry X X X X X X
Mesoderm X X X X X
Head develops first X X X
Anus develops first X X
Segmented body X X
Calcified shell X
Chitinous Exoskeleton X
Water Vascular system X
Vertebrae X
Another Example:
Cells with flagella: Sponge
Symmetry: Jellyfish
Bilateral symmetry: Flatworm
Mesoderm
Head develops first Anus develops first
Segmented Body:
Earthworm Calcified
Shell:
SnailChitinous
exoskeleton:
Fruit fly
Water
Vascular
system:
Starfish
Vertebrae:
Human
Flagella
Mesoderm
Bilateral symmetry
Symmetry
Vertebrae
Anus develops first
Chitinous
shell
Head develops
first
Sponge StarfishFruit flySnail
Flat-
worm EarthwormJellyfish Human
Water
vascular
system
Calcified
shell
Segmented body
• Morphology was used to classify
the Figworts. Until recently,
Figworts were the 8th
largest
family of angiosperms (flowering
plants). It grew from 16 genera
in 1789 to 275 genera
• Flowers of plants in Figworts
tend to be pretty uniform in
their appearance, typically
having corollas with bilateral
symmetry
• Taxonomists recently examined
chloroplast genes and found the
5000 figwort species should be
split into 5 different clades
rather than just one.
5.4 A.1 Discuss reclassification of the figwort family using evidence from
cladistics.
http://www.jardinexotiqueroscoff.com/site/uploads/pictures/plante
/800x800/scrophulariaceae-diascia-rigescens-13.jpg
5.4 A.1 Discuss reclassification of the figwort family using
evidence from cladistics.
http://upload.wikimedia.org/wikipedia/commons/2/2e/2007_Hippuris_vulgaris.jpg
Hippuris vulgaris (out)
5.4 A.1 Discuss reclassification of the figwort family using
evidence from cladistics.
http://upload.wikimedia.org/wikipedia/commons/4/40/Castilleja_angustifolia_1.jpg
Applegate Indian paintbrush (out)
5.4 A.1 Discuss reclassification of the figwort family using
evidence from cladistics.
Snapdragon (out)
• Botanists in the 18th and 19th
centuries used plant taxonomy to
separate out groups.
• Now with the use of modern
techniques, less than half of the
original species remain in the
Figwort family; now only the 36th
largest among angiosperms
• Reclassification was helpful since
old Figwort family was too large
and dissimilar to be a helpful
grouping
• We should consider ourselves
fortunate to be a part of what is
one of the eras of greatest
advancement in the field it is a
tremendous age of discovery
No longer a
Figwort. Sad

More Related Content

What's hot

10.3 gene pools and speciation
10.3 gene pools and speciation10.3 gene pools and speciation
10.3 gene pools and speciationBob Smullen
 
6.1 digestion HL Year One
6.1 digestion HL Year One6.1 digestion HL Year One
6.1 digestion HL Year OneBob Smullen
 
8.3 photosynthesis
8.3 photosynthesis8.3 photosynthesis
8.3 photosynthesisBob Smullen
 
IB Option H Further Human Physiology PPT
IB Option H Further Human Physiology PPTIB Option H Further Human Physiology PPT
IB Option H Further Human Physiology PPTFernanda Silva
 
IB Biology : 5.2 Natural Selection
IB Biology : 5.2 Natural SelectionIB Biology : 5.2 Natural Selection
IB Biology : 5.2 Natural Selectiondinafarhah
 
IB Biology 5.3 Slides: Classification & Taxonomy
IB Biology 5.3 Slides: Classification & TaxonomyIB Biology 5.3 Slides: Classification & Taxonomy
IB Biology 5.3 Slides: Classification & TaxonomyJacob Cedarbaum
 
IB Biology 3.1 Slides: Genes
IB Biology 3.1 Slides: GenesIB Biology 3.1 Slides: Genes
IB Biology 3.1 Slides: GenesJacob Cedarbaum
 
6.3 defence (chris paine)
6.3 defence (chris paine)6.3 defence (chris paine)
6.3 defence (chris paine)cartlidge
 
IB Biology 3.2 Slides: Chromosomes
IB Biology 3.2 Slides: ChromosomesIB Biology 3.2 Slides: Chromosomes
IB Biology 3.2 Slides: ChromosomesJacob Cedarbaum
 
Igcse biology edexcel 3.13 3.33
Igcse biology edexcel 3.13 3.33Igcse biology edexcel 3.13 3.33
Igcse biology edexcel 3.13 3.33Marc Rodriguez
 
IB Biology 2.5 Slides: Enzymes
IB Biology 2.5 Slides: EnzymesIB Biology 2.5 Slides: Enzymes
IB Biology 2.5 Slides: EnzymesJacob Cedarbaum
 
IB Biology Core 6.6: reproduction
IB Biology Core 6.6: reproductionIB Biology Core 6.6: reproduction
IB Biology Core 6.6: reproductionJason de Nys
 
26254477 ap-biology-cells-chapter-8-the-cell-membrane-2008-teacher
26254477 ap-biology-cells-chapter-8-the-cell-membrane-2008-teacher26254477 ap-biology-cells-chapter-8-the-cell-membrane-2008-teacher
26254477 ap-biology-cells-chapter-8-the-cell-membrane-2008-teacherGuruMASTURABINTIMUHA
 

What's hot (20)

10.3 gene pools and speciation
10.3 gene pools and speciation10.3 gene pools and speciation
10.3 gene pools and speciation
 
6.1 digestion HL Year One
6.1 digestion HL Year One6.1 digestion HL Year One
6.1 digestion HL Year One
 
8.3 photosynthesis
8.3 photosynthesis8.3 photosynthesis
8.3 photosynthesis
 
IB Option H Further Human Physiology PPT
IB Option H Further Human Physiology PPTIB Option H Further Human Physiology PPT
IB Option H Further Human Physiology PPT
 
IB Biology : 5.2 Natural Selection
IB Biology : 5.2 Natural SelectionIB Biology : 5.2 Natural Selection
IB Biology : 5.2 Natural Selection
 
A) Variation
A) VariationA) Variation
A) Variation
 
IB Biology 5.3 Slides: Classification & Taxonomy
IB Biology 5.3 Slides: Classification & TaxonomyIB Biology 5.3 Slides: Classification & Taxonomy
IB Biology 5.3 Slides: Classification & Taxonomy
 
IB Biology 3.1 Slides: Genes
IB Biology 3.1 Slides: GenesIB Biology 3.1 Slides: Genes
IB Biology 3.1 Slides: Genes
 
6.3 defence (chris paine)
6.3 defence (chris paine)6.3 defence (chris paine)
6.3 defence (chris paine)
 
IB Biology 3.2 Slides: Chromosomes
IB Biology 3.2 Slides: ChromosomesIB Biology 3.2 Slides: Chromosomes
IB Biology 3.2 Slides: Chromosomes
 
10.1 meiosis
10.1 meiosis10.1 meiosis
10.1 meiosis
 
Mitosis vs meiosis worksheet
Mitosis vs meiosis worksheetMitosis vs meiosis worksheet
Mitosis vs meiosis worksheet
 
Igcse biology edexcel 3.13 3.33
Igcse biology edexcel 3.13 3.33Igcse biology edexcel 3.13 3.33
Igcse biology edexcel 3.13 3.33
 
Diffusion and osmosis
Diffusion and osmosisDiffusion and osmosis
Diffusion and osmosis
 
2.3 Notes
2.3 Notes2.3 Notes
2.3 Notes
 
3.4 slides inheritance
3.4 slides   inheritance3.4 slides   inheritance
3.4 slides inheritance
 
2.2 water
2.2 water 2.2 water
2.2 water
 
IB Biology 2.5 Slides: Enzymes
IB Biology 2.5 Slides: EnzymesIB Biology 2.5 Slides: Enzymes
IB Biology 2.5 Slides: Enzymes
 
IB Biology Core 6.6: reproduction
IB Biology Core 6.6: reproductionIB Biology Core 6.6: reproduction
IB Biology Core 6.6: reproduction
 
26254477 ap-biology-cells-chapter-8-the-cell-membrane-2008-teacher
26254477 ap-biology-cells-chapter-8-the-cell-membrane-2008-teacher26254477 ap-biology-cells-chapter-8-the-cell-membrane-2008-teacher
26254477 ap-biology-cells-chapter-8-the-cell-membrane-2008-teacher
 

Similar to IB Biology Evolution 2015

5.1 evidence for evolution
5.1 evidence for evolution5.1 evidence for evolution
5.1 evidence for evolutionBob Smullen
 
Topic 6: Evolution
Topic 6: Evolution Topic 6: Evolution
Topic 6: Evolution Bob Smullen
 
Chapter 15 16 Notes
Chapter 15 16 NotesChapter 15 16 Notes
Chapter 15 16 NotesTia Hohler
 
16 Chapter
16 Chapter16 Chapter
16 ChapterCms
 
Evolution unit notes
Evolution unit notesEvolution unit notes
Evolution unit notesjschmied
 
15 Darwin’S Theory Of Evolution (Version 2)
15  Darwin’S Theory Of Evolution (Version 2)15  Darwin’S Theory Of Evolution (Version 2)
15 Darwin’S Theory Of Evolution (Version 2)ZBTHS
 
15 darwin’s theory of evolution (version 2)
15  darwin’s theory of evolution (version 2)15  darwin’s theory of evolution (version 2)
15 darwin’s theory of evolution (version 2)guest1941ca
 
Chapter 13 notes
Chapter 13 notesChapter 13 notes
Chapter 13 notes021dsw
 
Evolution notes #1
Evolution notes #1Evolution notes #1
Evolution notes #1wja10255
 
Evidence of Evolution (3).ppt
Evidence of Evolution (3).pptEvidence of Evolution (3).ppt
Evidence of Evolution (3).pptShella69
 
Ch15,16,17 evolution2ppt
Ch15,16,17 evolution2pptCh15,16,17 evolution2ppt
Ch15,16,17 evolution2pptalexito65
 
EVOLUTION.pptx
EVOLUTION.pptxEVOLUTION.pptx
EVOLUTION.pptxmikeebio1
 

Similar to IB Biology Evolution 2015 (20)

5.1 evidence for evolution
5.1 evidence for evolution5.1 evidence for evolution
5.1 evidence for evolution
 
Topic 6: Evolution
Topic 6: Evolution Topic 6: Evolution
Topic 6: Evolution
 
Evolution 1 5
Evolution 1 5Evolution 1 5
Evolution 1 5
 
Chapter 15 16 Notes
Chapter 15 16 NotesChapter 15 16 Notes
Chapter 15 16 Notes
 
16 Chapter
16 Chapter16 Chapter
16 Chapter
 
EVOLUTION CORE
EVOLUTION COREEVOLUTION CORE
EVOLUTION CORE
 
Evolution unit notes
Evolution unit notesEvolution unit notes
Evolution unit notes
 
15 Darwin’S Theory Of Evolution (Version 2)
15  Darwin’S Theory Of Evolution (Version 2)15  Darwin’S Theory Of Evolution (Version 2)
15 Darwin’S Theory Of Evolution (Version 2)
 
15 darwin’s theory of evolution (version 2)
15  darwin’s theory of evolution (version 2)15  darwin’s theory of evolution (version 2)
15 darwin’s theory of evolution (version 2)
 
The Evolution of Living Things
The Evolution of Living ThingsThe Evolution of Living Things
The Evolution of Living Things
 
evolution_ppt.pptx
evolution_ppt.pptxevolution_ppt.pptx
evolution_ppt.pptx
 
evolution_ppt.pptx
evolution_ppt.pptxevolution_ppt.pptx
evolution_ppt.pptx
 
Evolution.pptx
Evolution.pptxEvolution.pptx
Evolution.pptx
 
Evolution Science Grade 10
Evolution Science Grade 10Evolution Science Grade 10
Evolution Science Grade 10
 
Chapter 13 notes
Chapter 13 notesChapter 13 notes
Chapter 13 notes
 
evolution (1).ppt
evolution (1).pptevolution (1).ppt
evolution (1).ppt
 
Evolution notes #1
Evolution notes #1Evolution notes #1
Evolution notes #1
 
Evidence of Evolution (3).ppt
Evidence of Evolution (3).pptEvidence of Evolution (3).ppt
Evidence of Evolution (3).ppt
 
Ch15,16,17 evolution2ppt
Ch15,16,17 evolution2pptCh15,16,17 evolution2ppt
Ch15,16,17 evolution2ppt
 
EVOLUTION.pptx
EVOLUTION.pptxEVOLUTION.pptx
EVOLUTION.pptx
 

More from Bob Smullen

1. complete stats notes
1. complete stats notes1. complete stats notes
1. complete stats notesBob Smullen
 
Endocrine System
Endocrine SystemEndocrine System
Endocrine SystemBob Smullen
 
IB Biology Human Reproduction
IB Biology Human Reproduction IB Biology Human Reproduction
IB Biology Human Reproduction Bob Smullen
 
Topic 8: Ecology Option C Part 2
Topic 8: Ecology Option C Part 2Topic 8: Ecology Option C Part 2
Topic 8: Ecology Option C Part 2Bob Smullen
 
Topic 8: Ecology Option C Part 1
Topic 8: Ecology Option C Part 1Topic 8: Ecology Option C Part 1
Topic 8: Ecology Option C Part 1Bob Smullen
 
Topic 7: Plant Science
Topic 7: Plant ScienceTopic 7: Plant Science
Topic 7: Plant ScienceBob Smullen
 
Topic Five: Genetics
Topic Five: GeneticsTopic Five: Genetics
Topic Five: GeneticsBob Smullen
 
Topic 3: Nucleic Acid
Topic 3: Nucleic AcidTopic 3: Nucleic Acid
Topic 3: Nucleic AcidBob Smullen
 
Topic 2: Biochemistry
Topic 2: Biochemistry Topic 2: Biochemistry
Topic 2: Biochemistry Bob Smullen
 
6.5 neurons and synapses
6.5 neurons and synapses 6.5 neurons and synapses
6.5 neurons and synapses Bob Smullen
 
Immune system hl
Immune system hlImmune system hl
Immune system hlBob Smullen
 
6.2 and 6.4 transport and respiration
6.2 and 6.4  transport and respiration6.2 and 6.4  transport and respiration
6.2 and 6.4 transport and respirationBob Smullen
 
Ecology Optional Topic Student Notes
Ecology Optional Topic Student NotesEcology Optional Topic Student Notes
Ecology Optional Topic Student NotesBob Smullen
 
C.6 nitrogen cycle .pptx
C.6 nitrogen cycle .pptxC.6 nitrogen cycle .pptx
C.6 nitrogen cycle .pptxBob Smullen
 
C.5 population.pptx
C.5 population.pptxC.5 population.pptx
C.5 population.pptxBob Smullen
 
C.4 Conservation of Biodiversity
C.4 Conservation of BiodiversityC.4 Conservation of Biodiversity
C.4 Conservation of BiodiversityBob Smullen
 

More from Bob Smullen (20)

1. complete stats notes
1. complete stats notes1. complete stats notes
1. complete stats notes
 
Topic One: Cell
Topic One: CellTopic One: Cell
Topic One: Cell
 
Endocrine System
Endocrine SystemEndocrine System
Endocrine System
 
IB Biology Human Reproduction
IB Biology Human Reproduction IB Biology Human Reproduction
IB Biology Human Reproduction
 
Topic 8: Ecology Option C Part 2
Topic 8: Ecology Option C Part 2Topic 8: Ecology Option C Part 2
Topic 8: Ecology Option C Part 2
 
Topic 8: Ecology Option C Part 1
Topic 8: Ecology Option C Part 1Topic 8: Ecology Option C Part 1
Topic 8: Ecology Option C Part 1
 
Topic 7: Plant Science
Topic 7: Plant ScienceTopic 7: Plant Science
Topic 7: Plant Science
 
Topic Five: Genetics
Topic Five: GeneticsTopic Five: Genetics
Topic Five: Genetics
 
Topic 3: Nucleic Acid
Topic 3: Nucleic AcidTopic 3: Nucleic Acid
Topic 3: Nucleic Acid
 
Topic 2: Biochemistry
Topic 2: Biochemistry Topic 2: Biochemistry
Topic 2: Biochemistry
 
11.3 kidney
11.3 kidney11.3 kidney
11.3 kidney
 
11.2 Movement
11.2 Movement 11.2 Movement
11.2 Movement
 
6.5 neurons and synapses
6.5 neurons and synapses 6.5 neurons and synapses
6.5 neurons and synapses
 
Immune system hl
Immune system hlImmune system hl
Immune system hl
 
Ia headings
Ia headingsIa headings
Ia headings
 
6.2 and 6.4 transport and respiration
6.2 and 6.4  transport and respiration6.2 and 6.4  transport and respiration
6.2 and 6.4 transport and respiration
 
Ecology Optional Topic Student Notes
Ecology Optional Topic Student NotesEcology Optional Topic Student Notes
Ecology Optional Topic Student Notes
 
C.6 nitrogen cycle .pptx
C.6 nitrogen cycle .pptxC.6 nitrogen cycle .pptx
C.6 nitrogen cycle .pptx
 
C.5 population.pptx
C.5 population.pptxC.5 population.pptx
C.5 population.pptx
 
C.4 Conservation of Biodiversity
C.4 Conservation of BiodiversityC.4 Conservation of Biodiversity
C.4 Conservation of Biodiversity
 

Recently uploaded

Module for Grade 9 for Asynchronous/Distance learning
Module for Grade 9 for Asynchronous/Distance learningModule for Grade 9 for Asynchronous/Distance learning
Module for Grade 9 for Asynchronous/Distance learninglevieagacer
 
POGONATUM : morphology, anatomy, reproduction etc.
POGONATUM : morphology, anatomy, reproduction etc.POGONATUM : morphology, anatomy, reproduction etc.
POGONATUM : morphology, anatomy, reproduction etc.Cherry
 
Genome organization in virus,bacteria and eukaryotes.pptx
Genome organization in virus,bacteria and eukaryotes.pptxGenome organization in virus,bacteria and eukaryotes.pptx
Genome organization in virus,bacteria and eukaryotes.pptxCherry
 
Bhiwandi Bhiwandi ❤CALL GIRL 7870993772 ❤CALL GIRLS ESCORT SERVICE In Bhiwan...
Bhiwandi Bhiwandi ❤CALL GIRL 7870993772 ❤CALL GIRLS  ESCORT SERVICE In Bhiwan...Bhiwandi Bhiwandi ❤CALL GIRL 7870993772 ❤CALL GIRLS  ESCORT SERVICE In Bhiwan...
Bhiwandi Bhiwandi ❤CALL GIRL 7870993772 ❤CALL GIRLS ESCORT SERVICE In Bhiwan...Monika Rani
 
FAIRSpectra - Enabling the FAIRification of Analytical Science
FAIRSpectra - Enabling the FAIRification of Analytical ScienceFAIRSpectra - Enabling the FAIRification of Analytical Science
FAIRSpectra - Enabling the FAIRification of Analytical ScienceAlex Henderson
 
module for grade 9 for distance learning
module for grade 9 for distance learningmodule for grade 9 for distance learning
module for grade 9 for distance learninglevieagacer
 
Role of AI in seed science Predictive modelling and Beyond.pptx
Role of AI in seed science  Predictive modelling and  Beyond.pptxRole of AI in seed science  Predictive modelling and  Beyond.pptx
Role of AI in seed science Predictive modelling and Beyond.pptxArvind Kumar
 
Climate Change Impacts on Terrestrial and Aquatic Ecosystems.pptx
Climate Change Impacts on Terrestrial and Aquatic Ecosystems.pptxClimate Change Impacts on Terrestrial and Aquatic Ecosystems.pptx
Climate Change Impacts on Terrestrial and Aquatic Ecosystems.pptxDiariAli
 
The Mariana Trench remarkable geological features on Earth.pptx
The Mariana Trench remarkable geological features on Earth.pptxThe Mariana Trench remarkable geological features on Earth.pptx
The Mariana Trench remarkable geological features on Earth.pptxseri bangash
 
Cyathodium bryophyte: morphology, anatomy, reproduction etc.
Cyathodium bryophyte: morphology, anatomy, reproduction etc.Cyathodium bryophyte: morphology, anatomy, reproduction etc.
Cyathodium bryophyte: morphology, anatomy, reproduction etc.Cherry
 
Genetics and epigenetics of ADHD and comorbid conditions
Genetics and epigenetics of ADHD and comorbid conditionsGenetics and epigenetics of ADHD and comorbid conditions
Genetics and epigenetics of ADHD and comorbid conditionsbassianu17
 
Concept of gene and Complementation test.pdf
Concept of gene and Complementation test.pdfConcept of gene and Complementation test.pdf
Concept of gene and Complementation test.pdfCherry
 
Use of mutants in understanding seedling development.pptx
Use of mutants in understanding seedling development.pptxUse of mutants in understanding seedling development.pptx
Use of mutants in understanding seedling development.pptxRenuJangid3
 
Asymmetry in the atmosphere of the ultra-hot Jupiter WASP-76 b
Asymmetry in the atmosphere of the ultra-hot Jupiter WASP-76 bAsymmetry in the atmosphere of the ultra-hot Jupiter WASP-76 b
Asymmetry in the atmosphere of the ultra-hot Jupiter WASP-76 bSérgio Sacani
 
THE ROLE OF BIOTECHNOLOGY IN THE ECONOMIC UPLIFT.pptx
THE ROLE OF BIOTECHNOLOGY IN THE ECONOMIC UPLIFT.pptxTHE ROLE OF BIOTECHNOLOGY IN THE ECONOMIC UPLIFT.pptx
THE ROLE OF BIOTECHNOLOGY IN THE ECONOMIC UPLIFT.pptxANSARKHAN96
 
Digital Dentistry.Digital Dentistryvv.pptx
Digital Dentistry.Digital Dentistryvv.pptxDigital Dentistry.Digital Dentistryvv.pptx
Digital Dentistry.Digital Dentistryvv.pptxMohamedFarag457087
 
TransientOffsetin14CAftertheCarringtonEventRecordedbyPolarTreeRings
TransientOffsetin14CAftertheCarringtonEventRecordedbyPolarTreeRingsTransientOffsetin14CAftertheCarringtonEventRecordedbyPolarTreeRings
TransientOffsetin14CAftertheCarringtonEventRecordedbyPolarTreeRingsSérgio Sacani
 
Site specific recombination and transposition.........pdf
Site specific recombination and transposition.........pdfSite specific recombination and transposition.........pdf
Site specific recombination and transposition.........pdfCherry
 

Recently uploaded (20)

Module for Grade 9 for Asynchronous/Distance learning
Module for Grade 9 for Asynchronous/Distance learningModule for Grade 9 for Asynchronous/Distance learning
Module for Grade 9 for Asynchronous/Distance learning
 
POGONATUM : morphology, anatomy, reproduction etc.
POGONATUM : morphology, anatomy, reproduction etc.POGONATUM : morphology, anatomy, reproduction etc.
POGONATUM : morphology, anatomy, reproduction etc.
 
Genome organization in virus,bacteria and eukaryotes.pptx
Genome organization in virus,bacteria and eukaryotes.pptxGenome organization in virus,bacteria and eukaryotes.pptx
Genome organization in virus,bacteria and eukaryotes.pptx
 
Bhiwandi Bhiwandi ❤CALL GIRL 7870993772 ❤CALL GIRLS ESCORT SERVICE In Bhiwan...
Bhiwandi Bhiwandi ❤CALL GIRL 7870993772 ❤CALL GIRLS  ESCORT SERVICE In Bhiwan...Bhiwandi Bhiwandi ❤CALL GIRL 7870993772 ❤CALL GIRLS  ESCORT SERVICE In Bhiwan...
Bhiwandi Bhiwandi ❤CALL GIRL 7870993772 ❤CALL GIRLS ESCORT SERVICE In Bhiwan...
 
FAIRSpectra - Enabling the FAIRification of Analytical Science
FAIRSpectra - Enabling the FAIRification of Analytical ScienceFAIRSpectra - Enabling the FAIRification of Analytical Science
FAIRSpectra - Enabling the FAIRification of Analytical Science
 
module for grade 9 for distance learning
module for grade 9 for distance learningmodule for grade 9 for distance learning
module for grade 9 for distance learning
 
Role of AI in seed science Predictive modelling and Beyond.pptx
Role of AI in seed science  Predictive modelling and  Beyond.pptxRole of AI in seed science  Predictive modelling and  Beyond.pptx
Role of AI in seed science Predictive modelling and Beyond.pptx
 
Climate Change Impacts on Terrestrial and Aquatic Ecosystems.pptx
Climate Change Impacts on Terrestrial and Aquatic Ecosystems.pptxClimate Change Impacts on Terrestrial and Aquatic Ecosystems.pptx
Climate Change Impacts on Terrestrial and Aquatic Ecosystems.pptx
 
The Mariana Trench remarkable geological features on Earth.pptx
The Mariana Trench remarkable geological features on Earth.pptxThe Mariana Trench remarkable geological features on Earth.pptx
The Mariana Trench remarkable geological features on Earth.pptx
 
Cyathodium bryophyte: morphology, anatomy, reproduction etc.
Cyathodium bryophyte: morphology, anatomy, reproduction etc.Cyathodium bryophyte: morphology, anatomy, reproduction etc.
Cyathodium bryophyte: morphology, anatomy, reproduction etc.
 
Genetics and epigenetics of ADHD and comorbid conditions
Genetics and epigenetics of ADHD and comorbid conditionsGenetics and epigenetics of ADHD and comorbid conditions
Genetics and epigenetics of ADHD and comorbid conditions
 
Concept of gene and Complementation test.pdf
Concept of gene and Complementation test.pdfConcept of gene and Complementation test.pdf
Concept of gene and Complementation test.pdf
 
Use of mutants in understanding seedling development.pptx
Use of mutants in understanding seedling development.pptxUse of mutants in understanding seedling development.pptx
Use of mutants in understanding seedling development.pptx
 
Asymmetry in the atmosphere of the ultra-hot Jupiter WASP-76 b
Asymmetry in the atmosphere of the ultra-hot Jupiter WASP-76 bAsymmetry in the atmosphere of the ultra-hot Jupiter WASP-76 b
Asymmetry in the atmosphere of the ultra-hot Jupiter WASP-76 b
 
PATNA CALL GIRLS 8617370543 LOW PRICE ESCORT SERVICE
PATNA CALL GIRLS 8617370543 LOW PRICE ESCORT SERVICEPATNA CALL GIRLS 8617370543 LOW PRICE ESCORT SERVICE
PATNA CALL GIRLS 8617370543 LOW PRICE ESCORT SERVICE
 
THE ROLE OF BIOTECHNOLOGY IN THE ECONOMIC UPLIFT.pptx
THE ROLE OF BIOTECHNOLOGY IN THE ECONOMIC UPLIFT.pptxTHE ROLE OF BIOTECHNOLOGY IN THE ECONOMIC UPLIFT.pptx
THE ROLE OF BIOTECHNOLOGY IN THE ECONOMIC UPLIFT.pptx
 
Digital Dentistry.Digital Dentistryvv.pptx
Digital Dentistry.Digital Dentistryvv.pptxDigital Dentistry.Digital Dentistryvv.pptx
Digital Dentistry.Digital Dentistryvv.pptx
 
TransientOffsetin14CAftertheCarringtonEventRecordedbyPolarTreeRings
TransientOffsetin14CAftertheCarringtonEventRecordedbyPolarTreeRingsTransientOffsetin14CAftertheCarringtonEventRecordedbyPolarTreeRings
TransientOffsetin14CAftertheCarringtonEventRecordedbyPolarTreeRings
 
Site specific recombination and transposition.........pdf
Site specific recombination and transposition.........pdfSite specific recombination and transposition.........pdf
Site specific recombination and transposition.........pdf
 
Clean In Place(CIP).pptx .
Clean In Place(CIP).pptx                 .Clean In Place(CIP).pptx                 .
Clean In Place(CIP).pptx .
 

IB Biology Evolution 2015

  • 2. 5.1 Evidence for Evolution Essential idea: There is overwhelming evidence for the evolution of life on Earth.
  • 3. Understandings Statement Guidance 5.1 U.1 Evolution occurs when heritable characteristics of a species change. 5.1 U.2 The fossil record provides evidence for evolution. 5.1 U.3 Selective breeding of domesticated animals shows that artificial selection can cause evolution. 5.1 U.4 Evolution of homologous structures by adaptive radiation explains similarities in structure when there are differences in function. 5.1 U.5 Populations of a species can gradually diverge into separate species by evolution. 5.1 U.6 Continuous variation across the geographical range of related populations matches the concept of gradual divergence.
  • 4. Applications and Skills Statement Guidance 5.2 A.1 Development of melanistic insects in polluted areas. 5.2 A.2 Comparison of the pentadactyl limb of mammals, birds, amphibians and reptiles with different methods of locomotion.
  • 5. Evolution is the accumulated inherited changes in a population over time Evolution is one of the most powerful unifying concepts in science and is a critical underpinning to modern biology. It has been stated that without evolution biology, biology makes no sense. Dobzhansky, 1973 5.1 U.1 Evolution occurs when heritable characteristics of a species change.
  • 6.
  • 7. But the Fossil recordBut the Fossil record …… OBSERVATIONOBSERVATION
  • 8.
  • 9.
  • 10.
  • 11.
  • 12.
  • 13.
  • 14.
  • 15.
  • 16. Evidence supporting evolution I. Fossil record • transition species I. Anatomical record • homologous & vestigial structures • embryology & development I. Biogeography (Contential Drift) II. Molecular record (Neo-Darwinsim) • protein & DNA sequence 5.1 U.1 Evolution occurs when heritable characteristics of a species change.
  • 17.
  • 18. 5.1 U.1 Evolution occurs when heritable characteristics of a species change. The raw genetic material (variation) is hidden there http://upload.wikimedia.org/wikipedia/commons/9/90/Rock_Dove_ (Feral_Pigeon)_(Columba_livia)_-_geograph.org.uk_-_1309587.jpg
  • 19. 5.1 U.1 Evolution occurs when heritable characteristics of a species change.
  • 20. 5.1 U.1 Evolution occurs when heritable characteristics of a species change. http://4.bp.blogspot.com/- 6EXGifOabDY/T75wOIZARKI/AAAAAAAAEkk/OSmkn 25kUhE/s1600/darwin-finches.jpg
  • 21. 5.1 U.2 The fossil record provides evidence for evolution. Mount Everest 29,002 ft above sea level29,002 ft above sea level
  • 22. Hillary’s Step Fossilized sea shells located just a few feet away from the top of the world
  • 23. 5.1 U.2 The fossil record provides evidence for evolution. Fossil Record • Sedimentary rock is laid down over time… new on top, older rocks below • As one digs down, find related fossils, which are progressively older as one digs deeper • Consistent and steady increases in size/complexity of structures or the whole organism, or just the opposite, are seen in successive stratigraphic layers Oldest Youngest
  • 24. 5.1 U.2 The fossil record provides evidence for evolution. • Layers of sedimentary rock contain fossils – new layers cover older ones, creating a record over time – fossils within layers show that a succession of organisms have populated Earth throughout a long period of time
  • 25. The fossil record provides the dimension of time to the study of evolution – the layer of rock in which a fossil is found can be dated and therefore used to deduce the age of the fossil. http://sciencelearn.org.nz/Contexts/Dating-the-Past/Sci-Media/Images/Fossils-in-sedimentary-rock 5.1 U.2 The fossil record provides evidence for evolution.
  • 26. http://sciencelearn.org.nz/Contexts/Dating-the-Past/Sci-Media/Images/Fossils-in-sedimentary-rock 5.1 U.2 The fossil record provides evidence for evolution. There are gaps in the fossil record due to: •Special circumstances are required for fossilization to occur •Only hard parts of an organism are preserved •Fossils can be damaged so that only fragments remain to be discovered The fossil record is the sum of all discovered and undiscovered fossils and their relative placement in rock.
  • 27. Fossil Preservation • Petrified • Prints and molds • Resins which turn to Amber • Tar • Peat which is acidic preventing decay • Frozen in Ice or Snow • Sediments which turn to rock 5.1 U.2 The fossil record provides evidence for evolution. http://upload.wikimedia.org/wikipedia/commons/d/de/Ambre_Dominique_Moustique.jpg
  • 28. 5.1 U.2 The fossil record provides evidence for evolution.
  • 29. 5.1 U.2 The fossil record provides evidence for evolution. Radioactive Dating • Unstable atomic isotopes that decay over time. Organisms incorporate these isotopes in their bodies. This can be detected and used to radioactive dating a fossil, because radioactive decay follows a predictable exponential decay with time. Half-life is the period of time it takes for a substance undergoing decay to decrease by half. Example below
  • 30. 5.1 U.2 The fossil record provides evidence for evolution. • For instance, organisms take up C, both as 14 C and 12 C but the 14 C decays away, so that one can determine how old the fossil is by the ratio of 14 C to 12 C in the fossil. The older it is, the greater the relative quantity of 12 C vs. 14 C. Then, as with 14 C dating, the age in half lives can be deduced from the decay curve Half life of 14 C is 5730 years, so it is useful for dating samples that are between 1000 & 100,000 years old
  • 31. 5.1 U.2 The fossil record provides evidence for evolution. Potassium-Argon dating • Proportions of parent 40 K atoms and daughter 40 Ar atoms are measured • Half-life of 40 K is 1250 million years so it is very useful for dating samples older than 100,000 years old.
  • 32. 5.1 U.3 Selective breeding of domesticated animals shows that artificial selection can cause evolution. Artificial selection Wild Mustard Plant http://www.evolutionevidenc e.org/wp- content/uploads/2013/08/mu stardselection1.jpg http://upload.wikimedia.org/wikipedia/commons/2/2f/Wi ld_Mustard.jpg
  • 33. 5.1 U.3 Selective breeding of domesticated animals shows that artificial selection can cause evolution. https://phaven-prod.s3.amazonaws.com/files/image_part/asset/954254/z9zJXMj-QvJF- DjAAnbdUsdnL2I/large_Brassica_oleracea_cauliflower_broccoli_etc_DP347.jpg
  • 34. Selective breeding 5.1 U.3 Selective breeding of domesticated animals shows that artificial selection can cause evolution.
  • 35. Comparative Anatomy • Homologous structures • Analogous structures Convergent evolution Parallel Evolution • Vestigial Organs • Embryology 5.2 A.2 Comparison of the pentadactyl limb of mammals, birds, amphibians and reptiles with different methods of locomotion.
  • 36. Homologous structures Pentadactly limb) similarities in characteristics resulting from common ancestry Divergent Evolution 5.2 A.2 Comparison of the pentadactyl limb of mammals, birds, amphibians and reptiles with different methods of locomotion.
  • 37. Homologous structures • Similar structure • Similar development • Different functions • Evidence of close evolutionary relationship – recent common ancestor 5.2 A.2 Comparison of the pentadactyl limb of mammals, birds, amphibians and reptiles with different methods of locomotion.
  • 38. Vestigial Structures • describes a characteristic of organisms that have seemingly lost all or most of its original function through evolution. • Fossil record supports the hypothesis that whales are derived from ancient vertebrates • Vestigial hind limbs are present in modern whales internal bones. Vestigial limbs are found in many animals, including the python. 5.2 A.2 Comparison of the pentadactyl limb of mammals, birds, amphibians and reptiles with different methods of locomotion.
  • 39. Embryology • Similar features seen in developmental stages of related organisms • Gill pouches and tails seen in developing vertebrates • They have a common ancestor 5.2 A.2 Comparison of the pentadactyl limb of mammals, birds, amphibians and reptiles with different methods of locomotion.
  • 40. The climate of the Galapagos Islands varies seasonally and yearly. Coastal areas and higher elevations also show a large temperature difference. Ages of the Galapagos Island 5.1 U.4 Evolution of homologous structures by adaptive radiation explains similarities in structure when there are differences in function.
  • 41. Darwin found… birds Finch? Sparrow? Woodpecker? Warbler? Collected manyCollected many different birds on thedifferent birds on the Galapagos Islands.Galapagos Islands. Thought he foundThought he found very different kinds…very different kinds…
  • 42. Darwin was amazed to find out: All 14 species of birds were finches… Finch? Sparrow? Woodpecker? Warbler? But Darwin found… a lot of finches Large Ground Finch Small Ground Finch Warbler Finch But there is only one species of finch on the mainland! Veg. Tree Finch
  • 43. Correlation of species to food source SeedSeed eaterseaters FlowerFlower eaterseaters InsectInsect eaterseaters
  • 44. Hawaiian violets (Viola) – Nine taxa, seven species distributed over most islands – Species occupy several different habitats across five islands • Dry forest • Dry cliff • Stream bank • Swamp (cloud) forest • Open bog – Species growing in same habitat on different islands are almost identical morphologically, anatomically 5.1 U.5 Populations of a species can gradually diverge into separate species by evolution.
  • 45. Ages of the Hawaiian Islands Kauai = 5.1 my Hawaii = 400,000-180,000 my Maui Nui complex = 1.9 my-800,000 y Oahu = 3.7-2.6 my
  • 46. Topography of Kauai Waimea Canyon (extremely arid) Alakai Swamp/Mt Waialeale (wettest place on earth) Sandy or rocky Coastal sites Low-elevation Moist forest High-elevation wet forest, cliffs
  • 47. Some Viola species on Kauai Viola tracheliifolia (treelet, dry forest) Viola wailenalenae (shrub, swamp) Viola kauaiensis (herb, open bog)
  • 48. 5.1 A.1 Development of melanistic insects in polluted areas. http://upload.wikimedia.org/wikipedia/commons http://en.wikipedia.org/wiki/Peppered_moth_evolution #mediaviewer/File:Biston.betularia.f.carbonaria.7209.jp g Example of evolution taking place •The peppered moth…. Two forms (morphs) the gray mottled form and the dark form. Changes in relative numbers was hypothesized to be the result of selective predation by birds. High industrial pollution make the darker moth less likely to be seen. •Melanin gives color to moths Black is a mutation of the white form (morphs), it is dominant. With industrial pollution the black allele became favorable. Increase in population of the dominant allele. Clean air, return of lichen , increase in recessive allele.
  • 49. 5.1 A.1 Development of melanistic insects in polluted areas. http://upload.wikimedia.org/wikipedia/commons/b/b7/Lichte_en_zwarte_versie_berkenspanner.jpg
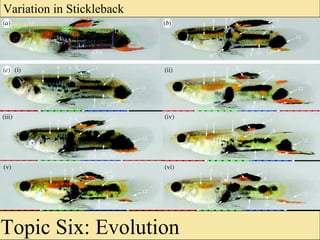
  • 50. 5.1 U.6 Continuous variation across the geographical range of related populations matches the concept of gradual divergence. • Geographic variation is the term used to refer to differences between populations. Differences in phenotype associated with local environment • For instance, yarrow plants vary with geographical location across the Sierra Nevada
  • 51. Essential idea: The diversity of life has evolved and continues to evolve by natural selection. 5.1 Natural Selection https://s-media-cache-ak0.pinimg.com/736x/51/3d/86/513d86a093998ac870e98e052dde0ed3.jpg
  • 52. Understandings Statement Guidance 5.1.U.1 Natural selection can only occur if there is variation among members of the same species. 5.1.U.2 Mutation, meiosis and sexual reproduction cause variation between individuals in a species 5.1.U.3 Adaptations are characteristics that make an individual suited to its environment and way of life. 5.1.U.4 Species tend to produce more offspring than the environment can support. 5.1.U.5 Individuals that are better adapted tend to survive and produce more offspring while the less well adapted tend to die or produce fewer offspring 5.1. U.6 Individuals that reproduce pass on characteristics to their offspring. [Students should be clear that characteristics acquired during the lifetime of an individual are not heritable. The term Lamarckism is not required.] 5.1 U.7 Natural selection increases the frequency of characteristics that make individuals better adapted and decreases the frequency of other characteristics leading to changes within the species.
  • 53. Applications and Skills Statement Guidance 5.2 A.1 Changes in beaks of finches on Daphne Major. 5.2 A.2 Evolution of antibiotic resistance in bacteria.
  • 54. Mechanism for Evolution Natural Selection The ultimate goal of any population is that it must produce the next generation. This is complicated by four basic characteristics of life: 1. Variation among individuals means they individually have different ability to obtain resources. Sexual reproduction promotes variation in a species. 2. Reproduction Individuals that survive and then reproduce transmit these variations to their offspring. *The environment is the agent of natural selection determining which species will survive. 3. Overpopulation Each generation produces more offspring then the environment can support. 4. Competition with finite resources along with an increase in the population there is a competition of those resources leading, a survival of the fittest.
  • 55. 5.2 U.1 Natural selection can only occur if there is variation among members of the same species. Variation among individuals means they individually have different ability to obtain resources. Sexual reproduction promotes variation in a species. http://upload.wikimedia.org/wikipedia/commons/thumb/5/53/Theba_geminata_variability.jpg/1280px-Theba_geminata_variability.jpg
  • 56. 1. Frequency of Genes (Genetic Variation) • Inheritable differences among individuals • Raw material of evolution • Happens in 3 ways A. Mutations B. Recombination (meiosis) C. Fertilization 5.2 U.2 Mutation, meiosis and sexual reproduction cause variation between individuals in a species. http://media-2.web.britannica.com/eb-media/70/81270-004-3B7A77F2.jpg
  • 57. A. Mutations • Permanent change in genetic variation • Only source of new alleles • Do not arise out of need • Causes of mutation – Spontaneous occurrence – Radiation – Chemicals – Transposons 5.2 U.2 Mutation, meiosis and sexual reproduction cause variation between individuals in a species. http://www.britannica.com/EBchecked/topic/376514/Merychippus
  • 58. Results of Mutations • Harmful Non-adaptive Eliminated by selection • Beneficial Adaptive Selected and persist • Neutral Neither adaptive nor non- adaptive May or may not persist in gene pool 5.2 U.2 Mutation, meiosis and sexual reproduction cause variation between individuals in a species. http://4.bp.blogspot.com/-- zKT77cA4Rc/URACaqRE7kI/AAAAAAAAAFI/ZktOQD8BRkY/s1 600/horse_evolution.gif
  • 59. Example of a gene mutation: phenylketonuria (PKU) • C to T base-substitution mutation results in wrong amino acid (similar to sickle-cell mutation) • Individuals can not metabolize amino acid phenylalanine an enzyme needed to degrade phenylalanine is not made so it accumulates in the brain and causes developmental disabilities. 5.2 U.2 Mutation, meiosis and sexual reproduction cause variation between individuals in a species.
  • 60. Example of a point mutation
  • 61. Example of a chromosomal mutation: Klinefelter’s syndrome: • receipt of an extra ‘X’ chromosome by males-> result is feminization of secondary sex characteristics, sterility and learning impairment may be present. • Chromosomal mutations tend to have less evolutionary significance because they typically cause death or sterility and will not be passed on.
  • 62. B. Recombination • Major source of genetic variation • Two processes Segregation Independent assortment 5.2 U.2 Mutation, meiosis and sexual reproduction cause variation between individuals in a species.
  • 63. C. Fertilization 5.2 U.2 Mutation, meiosis and sexual reproduction cause variation between individuals in a species.
  • 64. 5.2 U.3 Adaptations are characteristics that make an individual suited to its environment and way of life. http://www.gerlachnaturephoto.com/Yellowstone/Bison3791_MASTER_For_Web.jpg • Where and how an organism lives is largely due to its specific adaptations that allow it to survive and reproduce in a particular area or habitat • In other words their structure allows them to function in that environment • Polar bears are well adapted to life in the Arctic. They have a large layer of blubber to keep them warm. They are strong swimmers, aided by their strong forearms and layer of blubber for buoyancy. They have hollow fur to aid in insulation as well. For plants, cacti have water storage tissue and spines (prevent water loss) because of the infrequent rainfall in the desert. • Adaptations develop over time through natural selection
  • 65. 5.2 U.4 Species tend to produce more offspring than the environment can support. http://evolutionbyfl.weebly.com/uploads/3/9/7/9/39791607/5832564_orig.jpg • Populations tend to produce more offspring than the environment. • For example, fish produce thousands of eggs but only few make it to adulthood. • When parents don’t spend a lot or even any time caring for their young, they produce many offspring. This is a reproductive method used to make sure some offspring make it to the next generation. • Overpopulation and a limited amount of resources creates competition within a population.
  • 66. 5.2 U.5 Individuals that are better adapted tend to survive and produce more offspring while the less well adapted tend to die or produce fewer offspring. • Within a population, there is genetic variation between the individuals in the population. • The organisms with the beneficial characteristics will be able to out-compete the other individuals with the less beneficial or harmful genetic traits for limited resources and mates. • These individuals will survive and reproduce and pass these genetic traits onto the next generation of offspring. • Organisms with less desirable traits will die or produce less offspring
  • 67. LaMarck • Organisms adapted to their environments by acquiring traits – change in their life time • Disuse organisms lost parts because they did not use them — like the missing eyes & digestive system of the tapeworm • Perfection with Use & Need the constant use of an organ leads that organ to increase in size — like the muscles of a blacksmith or the large ears of a night-flying bat – transmit acquired characteristics to next generation Modern Theory: Mechanism for Evolution 5.2 U.6 Individuals that reproduce pass on characteristics to their offspring. [Students should be clear that characteristics acquired during the lifetime of an individual are not heritable. The term Lamarckism is not required.]
  • 68. 5.2 U.6 Individuals that reproduce pass on characteristics to their offspring. [Students should be clear that characteristics acquired during the lifetime of an individual are not heritable. The term Lamarckism is not required.]
  • 69. 5.2 U.7 Natural selection increases the frequency of characteristics that make individuals better adapted and decreases the frequency of other characteristics leading to changes within the species.
  • 70. Populations evolve • Natural selection acts on individuals – differential survival • “survival of the fittest” – differential reproductive success • who bears more offspring • Populations evolve – genetic makeup of population changes over time – favorable traits (greater fitness) become more common Presence of lactate dehydrogenase Mummichog 5.2 U.7 Natural selection increases the frequency of characteristics that make individuals better adapted and decreases the frequency of other characteristics leading to changes within the species.
  • 71. Distribution of genes (population genetics) •is the study of genetic variability in a population *Extension of Mendelian genetics •Populations are individuals of the same species that live in the same locations Exhibit variation in traits •Examination of the assemblage of traits reveals genetic information and shows the kind and proportion of alleles in a population 5.2 U.7 Natural selection increases the frequency of characteristics that make individuals better adapted and decreases the frequency of other characteristics leading to changes within the species.
  • 72. Genes and Populations • Gene pool: The collection of genes in a population Because diploids have only two versions of each gene, each has only a small fraction of possible alleles in a population • Genotype: The genetic makeup of an individual at a given locus, taking into account the two possible alleles Genotype frequencyGenotype frequency is the proportion of a given genotype in the population Allele frequencyAllele frequency refers to the proportion of a particular allele, such as A or a • Phenotype: the traits of an individual Phenotype frequencyPhenotype frequency is the proportion of a given phenotype in the population Phenotype frequency is influenced by the dominance characteristic of an allele 5.2 U.7 Natural selection increases the frequency of characteristics that make individuals better adapted and decreases the frequency of other characteristics leading to changes within the species.
  • 73. Alleles and Population Genetics • Although individuals are affected by the process of natural selection, it is the makeup of the population that is critical for determining the subsequent generations • Changes in the gene pool refer to changes in the frequency of the alleles • If the allele frequencies in a population do not undergo change over time, we say that the population is in genetic equilibrium 5.2 U.7 Natural selection increases the frequency of characteristics that make individuals better adapted and decreases the frequency of other characteristics leading to changes within the species.
  • 74. Warbler finch Woodpecker finch Small insectivorous tree finch Large insectivorous tree finch Vegetarian tree finch Cactus finch Sharp-beaked finch Small ground finch Medium ground finch Large ground finch Insect eaters Bud eater Seed eaters Cactus eater Warbler finch Treefinches Ground finches Darwin’s finches • Differences in beaks – associated with eating different foods – survival & reproduction of beneficial adaptations to foods available on islands 5.2 A.1 Changes in beaks of finches on Daphne Major.
  • 75. Darwin’s finches • Darwin’s conclusions – small populations of original South American finches landed on islands • variation in beaks enabled individuals to gather food successfully in the different environments – over many generations, the populations of finches changed anatomically & behaviorally • accumulation of advantageous traits in population • emergence of different species 5.2 A.1 Changes in beaks of finches on Daphne Major.
  • 76. Darwin’s finches • Differences in beaks allowed some finches to… – successfully compete – successfully feed – successfully reproduce • pass successful traits onto their offspring 5.2 A.1 Changes in beaks of finches on Daphne Major.
  • 77. 5.2 A.1 Changes in beaks of finches on Daphne Major. Changes on the island story * https://whyevolutionistrue.files.wordpress.com/2014/08/05jpessa1-master675.jpg
  • 78. Antibiotic resistance story* http://www.blueplanetgreenliving.com/wp-content/uploads/2009/08/Pill-bottles.jpg • Antibiotics kill bacteria directly or weaken the bacteria so your immune system can fight and destroy the invading pathogen. • Some bacteria might not die because of changes within their DNA. These changes could be caused by mutations within their genome or the transfer of an antibiotic resistant gene from another bacterium. • Resistance is more likely to occur if the proper amounts of antibiotics aren’t taken or if a patient doesn’t finish the prescription. • These resistant bacteria will survive and reproduce, creating more identical resistant bacteria. • These resistant bacteria will make the person sick again in the future. • However if given the same antibiotic, these bacteria will no longer be destroyed. • Another antibiotic can be prescribed to kill these new resistant bacteria. • Resistance can be passed onto other pathogenic bacteria, creating more species of resistant bacteria. 5.2 A.2 Evolution of antibiotic resistance in bacteria.
  • 79. 5.3 Classification of biodiversity • Essential idea: Species are named and classified using an internationally agreed system.
  • 80. Understandings Statement Guidance 5.3 U.1 The binomial system of names for species is universal among biologists and has been agreed and developed at a series of congresses. 5.3 U.2 When species are discovered they are given scientific names using the binomial system. 5.3 U.3 Taxonomists classify species using a hierarchy of taxa. 5.3 U.4 All organisms are classified into three domains. Archaea, eubacteria and eukaryote should be used for the three domains. Members of these domains should be referred to as archaeans, bacteria and eukaryotes. Viruses are not classified as living organisms. 5.3 U.5 The principal taxa for classifying eukaryotes are kingdom, phylum, class, order, family, genus and species. 5.3 U.6 In a natural classification, the genus and accompanying higher taxa consist of all the species that have evolved from one common ancestral species. 5.3 U.7 Taxonomists sometimes reclassify groups of species when new evidence shows that a previous taxon contains species that have evolved from different ancestral species. 5.3 U.8 Natural classifications help in identification of species and allow the prediction of characteristics shared by species within a group.
  • 81. Applications and Skills Statement Guidance 5.3 A.1 Classification of one plant and one animal species from domain to species level. 5.3 A.2 Recognition features of bryophyta, filicinophyta, coniferophyta and angiospermophyta. Students should know which plant phyla have vascular tissue, but other internal details are not required. 5.3 A.3 Recognition features of porifera, cnidaria, platylhelmintha, annelida, mollusca, arthropoda and chordata. Recognition features expected for the selected animal phyla are those that are most useful in distinguishing the groups from each other and full descriptions of the characteristics of each phylum are not needed. 5.3 A.4 Recognition of features of birds, mammals, amphibians, reptiles and fish. 5.3 S.1 Construction of dichotomous keys for use in identifying specimens.
  • 82. • Formal two naming system of classifying species. • Originally developed by Swedish naturalist Carolus Linnaeus. • Currently, many scientists and specialists meet in a series of International Congresses of Zoology which meet in different cities every 4 years • They meet to discuss their findings regarding genetics, animal behavior and classification • A main topic is the binomial nomenclature system and decisions regarding the classification of new organisms or the reclassification of old ones because of new evidence regarding ancestry. • The main objectives with regards to using the binomial nomenclature system developed are to • Make sure each organism has a unique name that cannot be confused with another organism • The name can be universally understood regardless of the nationality or culture that is using the name • Stability exists within the system by not allowing people to change the name without 5.3 U.1 The binomial system of names for species is universal among biologists and has been agreed and developed at a series of congresses. http://iszscon2012.haifa.ac.il/ http://www.ibc2017.cn/index.html
  • 83. 5.3 U.2 When species are discovered they are given scientific names using the binomial system.
  • 84. 5.3 U.2 When species are discovered they are given scientific names using the binomial system. https://d2m2lkhawsaq1u.cloudfront.net/uploads/trial /1128697-charles-darwin.jpg_1396593169.png
  • 85.
  • 86.
  • 87.
  • 88. 5.3 U.2 When species are discovered they are given scientific names using the binomial system.
  • 89. 5.3 U.2 When species are discovered they are given scientific names using the binomial system.
  • 90. 5.3 U.2 When species are discovered they are given scientific names using the binomial system.
  • 91. 5.3.U3 Taxonomists classify species using a hierarchy of taxa. 5.3.U5 The principal taxa for classifying eukaryotes are kingdom, phylum, class, order, family, genus and species. Not all domains use the same taxa – the example above is for Eukaryotes
  • 92. 5.3 U.5 The principal taxa for classifying eukaryotes are kingdom, phylum, class, order, family, genus and species.
  • 93. 5.3 U.5 The principal taxa for classifying eukaryotes are kingdom, phylum, class, order, family, genus and species. Dear King Philip Come Over For Good Spaghetti
  • 94. • Revision of the classification system lead to a new level of taxon called domains. • The Prokaryotae are now divided into two domains, the Bacteria and the Archaea • These are organisms that do not have a membrane bound nucleus and their DNA is not associated with proteins. • The Bacteria domain consists of Eubacteria and archaebacteria are classified as Archaeans. • The Eukarya domain includes eukaryotes, or organisms that have a membrane bound nucleus. This domain is further subdivided into the kingdoms Protista, Fungi, Plantae, and Animalia • Groups organisms primarily based on differences in ribosomal RNA structure. Ribosomal RNA is a molecular building block for ribosomes. 5.3 U.4 All organisms are classified into three domains.
  • 95. 5.3 U.4 All organisms are classified into three domains. Archaea Bacteria (Eubacteria) Eukaryota Examples are often, but always, extremophiles: •Sulfolobus sp. grow in volcanic springs with optimal growth occurring at pH 2-3 and temperatures of 75-80 °C •Halobacterium sp. (lives in water with high salt concentrations) • Staphylococcus aureus (above) can cause skin infections and respiratory disease • Cyanobacteria sp. Are photosynthetic • Rhizobium sp. live symbiotically with plants and fix nitrogen Includes several kingdoms including fungi, animals and plants. Examples range from algae to Humans. • No nuclear membrane • RNA and biochemistry distinct from bacteria • No nuclear membrane • Nuclear membrane Features and examples of each domain: http://en.wikipedia.org/wiki/Three-domain_system
  • 96. 5.3 A.1 Classification of one plant and one animal species from domain to species level. Learn a mnemonic, one animal example and one plant example: Domain Does Eukaryota Eukaryota Kingdom Kennard Animalia Plantae Phylum Play Chordata Spermatophyta Class Classical Mammalia Eudicotyledons Order Or Primates Magnoliidae Family Folk Hominidae Ranunculales Genus Guitar Homo Ranunculus Species Songs? Sapiens Acris Human Meadow Buttercup http://commons.wikimedia.org/wiki/File:Masai_Woman.jpg http://commons.wikimedia.org/wiki/File:Ranunculus_macro.jpg Dear King Philip Come Over For Good Spaghetti
  • 97. Plant Kingdom Diversity The plant kingdom has within it 4 major groups: • Bryophytes (mosses & liverworts) • Filicinophytes (Ferns) • Coniferophytes (Conifers & Pines) • Angiospermophytes ( Flowering Plants) 5.3 A.2 Recognition features of bryophyta, filicinophyta, coniferophyta and angiospermophyta.
  • 98. 5.3 A.2 Recognition features of bryophyta, filicinophyta, coniferophyta and angiospermophyta. 1. Bryophytes 3. Coniferophytes 4. Angiosperms 2. Filicinophytes
  • 99. 5.3 A.2 Recognition features of bryophyta, filicinophyta, coniferophyta and angiospermophyta. Leaves, roots and stems Vascular tissue Reproductive structures Bryophytes (mosses, hornworts and liverworts) • No roots, but structures similar to root hairs called rhizoids • Mosses have simple leaves and stems • Liverworts have a flattened thallus None Spores produced in capsules, which develop at the end of a stalk Filicinophytes (ferns) • Roots present • Short non-woody stems. • Leaves usually divided into pairs of leaflets Yes Spores produced in sporangia on the underside of the leaves Coniferophytes (conifer shrubs and trees) • Roots, present • Woody stems • Leaves usually narrow with a thick waxy cuticle Yes Seeds develop from ovules in female cones. Male cones produce pollen. Angiospermophytes (flowering plants) • Leaves and roots variable in structure • Stems maybe woody (shrubs and trees) Yes Seeds develop from ovules in ovaries, inside flowers. Seeds are dispersed by fruits which develop from the ovaries.
  • 100. 5.3 A.4 Recognition of features of birds, mammals, amphibians, reptiles and fish. The most familiar animal from the chordata phyla belong the to subphylum vertebrata. Can you match the different classes with the images? http://commons.wikimedia.org/ Fish (Agnatha, Chondrichthyes, Osteichthyes) Birds (aves) Mammals (mammalia) Amphibians (amphibia) Reptiles (reptilia)
  • 101. 5.3 A.4 Recognition of features of birds, mammals, amphibians, reptiles and fish. Limbs Gas Exchange Reproduction Other features Mammals 4 Pentadactyl limbs Lungs with alveoli • Internal fertilization • Give birth to live young • Mammary glands secrete milk • Hairs growing from the skin • Teeth including living tissue birds 4 Pentadactyl limbs, 2 limbs modified as wings Lungs with parabronchial tubes • Internal fertilization • Hard shells around the eggs • Feathers growing from skin • Beak but no teeth reptiles 4 Pentadactyl limbs Lungs with extensive folding • Internal fertilization • Soft shells around eggs • Dry scaly impermeable skin • Simple teeth – no living tissue amphibians 4 Pentadactyl limbs Simple lungs with small internal folds and moist surfaces • External fertilization in water • Protective jelly around eggs • Larval stage lives in water • Soft moist permeable skin fish Fins Gills • External fertilization in most species • Scales grow from the skin • with a single gill slit • Swim bladder for buoyancy A summary of key features that can be used to distinguish between the vertebrate classes
  • 102. 5.3.A3 Recognition features of porifera, cnidaria, platylhelmintha, annelida, mollusca, arthropoda and chordata. chordata porifera cnidaria platylhelmintha annelida mollusca arthropoda What about other phyla? Can you match the names with the images?
  • 108. Phylum: Arthropoda (Insects, Crustaceans, Spiders, Scorpions, Millipedes) http://animals-pics.com/bird-eating-tarantula-size/33/go-back-gallery-for-goliath-bird-eating-spider-size-comparison/
  • 110. 5.3 A.3 Recognition features of porifera, cnidaria, platylhelmintha, annelida, mollusca, arthropoda and chordata. Chordata (animals with a backbone) should be easy. Try using the key to help identify the rest of the phyla.
  • 111. 5.3.A3 Recognition features of porifera, cnidaria, platylhelmintha, annelida, mollusca, arthropoda and chordata. Can you match the phyla with the images? chordata porifera cnidaria platylhelmintha annelida mollusca arthropoda
  • 112. 5.3 A.3 Recognition features of porifera, cnidaria, platylhelmintha, annelida, mollusca, arthropoda and chordata. Symmetry Segmentation Digestive tract Other features porifera (sponges) None None No mouth or anus • Porous • attached to rocks • Filter feeder cnidaria (corals, jellyfish) Radial None Mouth but no anus • Stinging cells • Tentacles platylhelmintha (flatworms) Bilateral None Mouth but no anus • Flattened body annelida (earthworms, leeches) Bilateral Very segmented Mouth and anus • bristles often present Mollusca (oyster, snails, octopus) Bilateral Non-visible segmentation Mouth and anus • Most have shell made of CaCO3 Arthropoda (ant, scorpion, crab) Bilateral Segmented Mouth and anus • Exoskeleton • jointed appendages Chordata (fish, birds, mammals) Bilateral Segmented Mouth and anus • notochord • hollow dorsal nerve cord • (some have ) pharyngeal slits A summary of key features that can be used to distinguish between animal phyla
  • 113. 5.3 S.1 Construction of dichotomous keys for use in identifying specimens.
  • 114.
  • 115. 5.3.S1 Construction of dichotomous keys for use in identifying specimens.
  • 116. 5.3.U.6 In a natural classification, the genus and accompanying higher taxa consist of all the species that have evolved from one common ancestral species. Natural classification groups together species that share a common ancestor from which they evolved. This is called the Darwinian principle of common descent . • Members of a group share important attributes or 'homologous’ traits that are inherited from common ancestors. For example Lions share more traits with Jaguars than with Leopards. • Grouping together birds, bats and bees because they fly would be an artificial classification as they do not share a common ancestor and evolved the ability to fly independently. • Natural classification is not straightforward as convergent evolution can make distantly related organisms appear similar and adaptive radiation can make similar organisms appear very different from each other.
  • 117. 5.3 U.7 Taxonomists sometimes reclassify groups of species when new evidence shows that a previous taxon contains species that have evolved from different ancestral species. • Historically classification systems have been revised repeatedly based on emerging evidence. • Recent evidence from genetic studies of ribosomal RNA has shown that "prokaryotes" are far more diverse than anyone had suspected. • Ribosomal RNA is found in all organisms and evolves slowly so is a good way to track evolution over long time periods. Previously in the second half of the 20th century all living organisms were classified into five kingdoms. This included prokaryotes being placed in one kingdom and eukaryotes were split-up into the remaining four kingdoms. http://academic.pgcc.edu/~kroberts/Lecture/Chapter%204/04-23_WhittakerTax_L.jpg
  • 118. 5.3.U.8 Natural classifications help in identification of species and allow the prediction of characteristics shared by species within a group. If a new species of Ant is discovered then scientists would predict that the species should possess amongst other characteristics six jointed legs, a head, thorax, abdomen, elbowed antennae, ‘antibiotic’ secretory glands. If the species does not match the expected set of characteristics this brings into question either the classification of the species or of Ants as a family. Natural classification is very helpful when dealing with new species: “New species of legless amphibian discovered in remote Cambodian rainforest” http://www.abc.net.au/news/2015-01-17/new-species-of-legless- amphibian-found-in-cambodia/6022048 Dichotomous keys can be used to help identify the species. The keys can place a specimen with the most closely related species, genus, family or phyla using natural classification. To what level of classification a specimen can be placed depends on how unique it is.
  • 119. 10.3 Gene Pools and Speciation Essential idea: Gene pools change over time.
  • 120. Understandings Statement Guidance 10.3 U.1 A gene pool consists of all the genes and their different alleles, present in an interbreeding population. 10.3 U.2 Evolution requires that allele frequencies change with time in populations. Punctuated equilibrium implies long periods without appreciable change and short periods of rapid evolution. 10.3 U.3 Reproductive isolation of populations can be temporal, behavioral or geographic. 10.3 U.4 Speciation due to divergence of isolated populations can be gradual. 10.3 U.5 Speciation can occur abruptly.
  • 121. Applications and Skills Statement Utilization 10.3 A.1 Identifying examples of directional, stabilizing and disruptive selection. 10.3 A.2 Speciation in the genus Alliumby polyploidy. Many crop species have been created to be polyploid. Polyploidy increases allelic diversity and permits novel phenotypes to be generated. It also leads to hybrid vigor. 10.3 S.1 Comparison of allele frequencies of geographically isolated populations.
  • 122. 10.3 U1 A gene pool consists of all the genes and their different alleles, present in an interbreeding population Speciation •A species a group of individuals who produce offspring after mating. This make individual of that species reproductively isolated from other species. •A gene pool is the set of all genes, in an interbreeding population. http://data1.whicdn.com/images/63849/large.jpghttp://arkansasagnews.uark.edu/monarchs95.jpg
  • 123. 10.3 U.2 Evolution requires that allele frequencies change with time in populations. If the allele frequencies of a population are not in equilibrium then the frequencies are changing or evolving. The following processes facilitate evolution by either adding or removing genetic variation from a population: •Mutation •Migration (Gene Flow) •Genetic Drift •Unequal Mating and/or Fertilization Success (Sexual Selection) •Unequal Viability (Natural Selection) Gene pool: The collection of genes in a population Because diploids have only two versions of each gene, each has only a small fraction of possible alleles in a population Genotype: The genetic makeup of an individual at a given locus, taking into account the two possible alleles Genotype frequency is the proportion of a given genotype in the population Allele frequency refers to the proportion of a particular allele, such as A or a Phenotype: the traits of an individual Phenotype frequency is the proportion of a given phenotype in the population Phenotype frequency is influenced by the dominance characteristic of an allele
  • 124. 10.3 U.2 Evolution requires that allele frequencies change with time in populations.
  • 125. Frequencies add up to 1.0 e.g. — a population has two alleles, A and a with A is dominant over a The allele frequencies must sum to 1.0 (frequency of A) + (frequency of a) = 1.0 The genotype frequencies must sum to 1.0 (frequency of AA) + (frequency of Aa) + (frequency of aa) = 1.0 The phenotype frequencies must sum to 1.0 (frequency of AA and Aa phenotype) + (frequency of aa phenotype) = 1.0 Imagine 2 alleles, A and a p is the frequency of A q the frequency of a So, p + q = 1 The mathematical equivalent of a random mating can be given by multiplying this relationship by itself Therefore, (p + q)2 = 1 = p2 + 2pq + q2 p2 = frequency of AA 2pq = frequency of Aa q2 = frequency of aa Given this condition, we can always work out the frequencies of each allele in a sexual population. 10.3 U.2 Evolution requires that allele frequencies change with time in populations.
  • 126. 10.3 U.2 Evolution requires that allele frequencies change with time in populations. •Evolution is the cumulative change in allele frequency or heritable characteristics in a population over time •The cumulative change can occur as a result of genetic changes and/or selective pressures which favor certain heritable characteristics over other less favorable characteristics •These populations have to be reproductively isolated, thus preventing gene flow between populations P equals the dominant gene Q equals the recessive gene
  • 127. 10.3 S.1 Comparison of allele frequencies of geographically isolated populations • Cod fish have a gene that codes for an integral membrane protein called pantophysin. • Two alleles of the gene, PanIA and PanIB , code for versions of pantophysin, that differ by four amino acids in one region of the protein. • Samples were collected from 23 locations in the North Atlantic (numbered 1–23 in each pie chart), on the map to the right. • The frequency of an allele can vary from 0.0 to 1.0. PanIA light grey sectors of the pie charts show the allele frequency for the PanIA gene PanIB black sectors show the allele frequency for the PanIB gene. • The biggest difference in allele frequency occurs in the Cod fish isolated at the two extremes of the map.
  • 128. 10.3 U3 Reproductive isolation of populations can be temporal, behavioral or geographic. • Reproductive isolation of populations occurs when barriers or mechanisms prevent two populations from interbreeding, keeping their gene pools isolated from each other. • There are different types of reproductive isolation including temporal, behavioral, and geographic
  • 129. How and why do new species originate? • Species are created by a series of evolutionary processes – populations become isolated • geographically isolated • reproductively isolated – isolated populations evolve independently • Isolation – allopatric • geographic separation – sympatric • still live in same area 10.3 U3 Reproductive isolation of populations can be temporal, behavioral or geographic.
  • 130. 10.3 U3 Reproductive isolation of populations can be temporal, behavioral or geographic. Temporal isolation •Species that breed during different times of day, different seasons, or different years cannot mix gametes – reproductive isolation – sympatric speciation • “same country” Eastern Spotted Skunk (Top Right) & Western Spotted Skunk (Bottom Right) overlap in range but Eastern mates in late winter & Western mates in late summer Eastern Spotted Skunk (Top Right) & Western Spotted Skunk (Bottom Right) overlap in range but Eastern mates in late winter & Western mates in late summer http://upload.wikimedia.org/wikipedia/ commons/f/f2/Spilogale_putorius_(2).jp g http://upload.wikimedia.org/wikipe dia/commons/9/98/Spilogale_gracili s_amphiala.jpg
  • 131. 10.3 U3 Reproductive isolation of populations can be temporal, behavioral or geographic. Behavioral Isolation •In most animal species, members of the two sexes must first search for each other and come together. •Unique behavioral patterns & rituals isolate species  identifies members of species attract mates of same species  courtship rituals, mating calls  reproductive isolation Blue footed boobies mate only after a courtship display unique to their species Blue footed boobies mate only after a courtship display unique to their specieshttp://upload.wikimedia.org/wikipedia/commo ns/a/aa/Bluefooted_Booby_Comparison.jpg
  • 132. So…what is a species? Western MeadowlarkWestern Meadowlark Eastern Meadowlark Distinct species: songs & behaviors are different enough to prevent interbreeding Distinct species: songs & behaviors are different enough to prevent interbreeding 10.3 U3 Reproductive isolation of populations can be temporal, behavioral or geographic.
  • 133. 10.3 U3 Reproductive isolation of populations can be temporal, behavioral or geographic. Geographic Isolation Species occur in different areas – physical barrier – allopatric speciationallopatric speciation • “other country” Harris’s Antelope Squirrel inhabits the canyon’s south rim (L). Just a few miles away on the north rim (R) lives the closely related White-tailed Antelope Squirrel Harris’s Antelope Squirrel inhabits the canyon’s south rim (L). Just a few miles away on the north rim (R) lives the closely related White-tailed Antelope Squirrel
  • 134. 10.3 A.1 Identifying examples of directional, stabilizing and disruptive selection. • If no selection occurs to a population (for whatever means), population doesn’t change with succeeding generations. • If selection pressure is applied then those not receiving selection pressure tend to predominate…  Stabilizing: the extremes are selected against; center stays same and grows in numbers  Directional: one tail of the distribution is selected against and the opposite tail grows in numbers  Disruptive: a mid-group is selected against; the tails are allowed to predominate and grow compared to middle As an example: in Humans we have selected for a babies birth weight. This protects the mother and the babies health.
  • 135. 10.3 A.1 Identifying examples of directional, stabilizing and disruptive selection. Directional Selection: •Selection that removes individuals from one end of a phenotypic distribution and thus causes a shift in the distribution towards the other end. •Over time, the favored extreme will become more common and the other extreme will be less common or lost.
  • 136. 10.3 A.1 Identifying examples of directional, stabilizing and disruptive selection. Stabilizing Selection: A type of selection that removes individuals from both ends of a phenotypic distribution, thus maintaining the same distribution mean. This occurs when natural selection favors the intermediate phenotypes. Over time, the intermediate states become more common and each extreme variation will become less common or lost. Same mouse example where medium colored fur is favored over dark or light fur color.
  • 137. 10.3 A.1 Identifying examples of directional, stabilizing and disruptive selection. Disruptive Selection: •Removes individuals from the center of a phenotype. This occurs when natural selection favors both ends of the phenotypic variation. •Over time, the two extreme variations will become more common and the intermediate states will be less common or lost. •This can lead to two new species.
  • 138. 10.4 U.4 Speciation due to divergence of isolated populations can be gradual. • Speciation can occur gradually over long periods of time, with several intermediate forms in between species leading to today’s current species. This can be seen in some of the more complete fossil records, like the whale or the horse. • In some species, large gaps were evident for certain species in the fossil record. This imperfections in the fossil record, maybe the result of transitional species have not been discovered yet or abrupt speciation. http://www.sivatherium.narod.ru/library/Dixon/pics_01/p0010_e.gif
  • 139. Gradualism •Gradual divergence over long spans of time – assume that big changes occur as the accumulation of many small ones 10.4 U.4 Speciation due to divergence of isolated populations can be gradual. http://cnx.org/resources/22b17901c8ce6510b03e2f89df0bc072/graphics1.png
  • 140. 10.3 U.5 Speciation can occur abruptly. Punctuated Equilibrium Species remain stable for long periods of time (several million years) interrupted by periods of significant change, during which time a new species may evolve.  rapid bursts of change  long periods of little or no change  species undergo rapid change when they 1st bud from parent population
  • 141. 10.3 U.5 Speciation can occur abruptly. http://static.skynetblogs.be/media/130852/12.11.jpg Over 75% of all life on Earth was lost during the late Devonian mass extinction which took place about 375-359 million years ago
  • 142. 10.3 U.5 Speciation can occur abruptly. https://evolutionliteracy.files.wordpress.com/2014/09/t rilobites-evolution-literacy-g-paz-y-mino-c-photo.jpg Over 97% of all life on Earth was lost during theOver 97% of all life on Earth was lost during the End-Permian mass extinction which took place 252End-Permian mass extinction which took place 252 million years agomillion years ago
  • 143. 10.3 U.5 Speciation can occur abruptly. http://www.gohobby.com/wp- content/uploads/2012/11/Velociraptor- Jurassic-Park.jpeg Over 50% of all life on Earth was lost during the TriassicOver 50% of all life on Earth was lost during the Triassic mass extinction which took place 201 million years agomass extinction which took place 201 million years ago
  • 144. 10.3 U.5 Speciation can occur abruptly. https://evolutionliteracy.files.wordpress.com/2014/09/t rilobites-evolution-literacy-g-paz-y-mino-c-photo.jpg Over 80% of all life on Earth was lost during the endOver 80% of all life on Earth was lost during the end Cretaceous. The mass extinction took place 252 millionCretaceous. The mass extinction took place 252 million years agoyears ago
  • 145. Gradualism Punctuated Equilibrium 10.3 U.5 Speciation can occur abruptly.
  • 146. 10.3 A.2 Speciation in the genus Alliumby polyploidy. • Polyploidy organisms contain more than two pairs of the same chromosomes. • A likely advantage is it allows for additional raw materials (i.e. DNA, genes) for evolution. Every gene is theoretically free to evolve without substantial negative effect. • Polyploidy plants tend to be larger. The reproductive organs and fruit, in particular, are usually enlarged in polyploidy. The likely mechanism for this is simple: more DNA results in a larger nucleus, which results in larger cells, especially in the reproductive organs. http://www.vims.edu/newsandevents/topst ories/_images/diploid_triploid_250.jpg Oysters
  • 147. 10.3 A.2 Speciation in the genus Alliumby polyploidy.
  • 148. 10.3 A.2 Speciation in the genus Alliumby polyploidy. • The genus Allium comprises monocot flowering plants and includes the onion, garlic, chives, scallion, shallot, and the leek. • In many of these species of plants, chromosome doubling has created a large number of different phenotypes. • This results is a number of reproductively isolated but similar populations. Examples: of this are seen in 7 natural populations Allium grayi. They showed • tetraploid (2n=32) • pentaploid (2n=40) • hexaploid (2n=48) http://i.dailymail.co.uk/i/pix/2008/09/12/article-1054890- 029CF17900000578-854_233x364.jpg
  • 149. 10.3 A.2 Speciation in the genus Alliumby polyploidy. Allium grayi tetraploid (2n=32) tetraploid (2n=32)
  • 150. 10.3 A.2 Speciation in the genus Alliumby polyploidy. pentaploid (2n=40)
  • 151. 10.3 A.2 Speciation in the genus Alliumby polyploidy. http://upload.wikimedia.org/wikipedia/commons/7/79/Allium_tulipifolium_(inflorescence).jpg hexaploid (2n=48)
  • 152. 5.4 Cladistics Essential idea: The ancestry of groups of species can be deduced by comparing their base or amino acid sequences.
  • 153.
  • 154. Understandings Statement Guidance 5.4.U.1 A clade is a group of organisms that have evolved from a common ancestor. 5.4.U.2 Evidence for which species are part of a clade can be obtained from the base sequences of a gene or the corresponding amino acid sequence of a protein. 5.4.U.3 Sequence differences accumulate gradually so there is a positive correlation between the number of differences between two species and the time since they diverged from a common ancestor. 5.4.U.4 Traits can be analogous or homologous. 5.4.U.5 Cladograms are tree diagrams that show the most probable sequence of divergence in clades. 5.4.U.6 Evidence from cladistics has shown that classifications of some groups based on structure did not correspond with the evolutionary origins of a group or species.
  • 155. Applications and Skills Statement Guidance 5.4.A.1 Cladograms including humans and other primates. 5.4.A.2 Reclassification of the figwort family using evidence from cladistics. 5.4 S..1 Analysis of cladograms to deduce evolutionary relationships.
  • 156. 5.4 U.1 A Clade is a group of organisms that have evolved from a common ancestor • Cladistics (From the ancient Greek for "branch") is a method of classifying species of organisms into groups called clades, which consist of an ancestor organism and all its descendants (and nothing else).
  • 157. 5.4 U.1 A Clade is a group of organisms that have evolved from a common ancestor http://upload.wikimedia.org/wikipedia/commons/6/6b/Lutjanus_kasmira_school.jpg
  • 158. http://upload.wikimedia.org/wikipedia/commons/2/2b/Tiktaalik_roseae_life_restor.jpg 5.4 U.1 A Clade is a group of organisms that have evolved from a common ancestor TiktaalikTiktaalik •Represents the evolutionary transitionRepresents the evolutionary transition from fish to amphibians. And as such thefrom fish to amphibians. And as such the common ancestor to every animal in thecommon ancestor to every animal in the Clade after the fish.Clade after the fish.
  • 159. 5.4 U.1 A Clade is a group of organisms that have evolved from a common ancestor http://upload.wikimedia.org/wikipedia/commons/1/19/Caerulea3_crop.jpg
  • 160. 5.4 U.1 A Clade is a group of organisms that have evolved from a common ancestor http://upload.wikimedia.org/wikipedia/commons/d/dc/Furcifer_pardalis_-Z%C3%BCrich_Zoo-8a.jpg
  • 161. Archaeopteryx is a famous example transitional fossils – it gives evidence for the evolution of birds from reptiles like dinosaurs. http://commons.wikimedia.org/wiki/File:Archaeopteryx_lithographica_%28Berlin_specimen%29.jpg http://commons.wikimedia.org/wiki/File:Archaeopteryx_NT.jpg Bird features: •feathers Dinosaur features include: •jaws with sharp teeth •three fingers with claws •long bony tail 5.4 U.1 A Clade is a group of organisms that have evolved from a common ancestor
  • 162. 5.4 U.1 A Clade is a group of organisms that have evolved from a common ancestor http://upload.wikimedia.org/wikipedia/commons/0/03/Mountain_Bluebird.jpg Likewise, birds share the common characteristics of feathers They too form a clade
  • 163. Mammals have the unique homologousMammals have the unique homologous characteristic of producing milkcharacteristic of producing milk They form a cladeThey form a clade 5.4 U.1 A Clade is a group of organisms that have evolved from a common ancestor http://images.nationalgeographic.com/wpf/media- live/photos/000/334/cache/freshwater-mammals-hippo_33402_600x450.jpg
  • 164. For example, Fish, Amphibians, Reptiles, Birds, Mammals, and all descendants from a common ancestor to form a clade 5.4 U.1 A Clade is a group of organisms that have evolved from a common ancestor
  • 165.
  • 166. http://bridgeurl.com/xrmmmk/all Vertebrate Hair Shelled eggs Amniotic Egg Four Limbs Bony Skeleton Each clade is determined by common characteristics of its members that are different from that of the other species from which it has diverged
  • 167. Morphology (or there outward appearance) is only one part of the story in cladistics. DNA and the amino acids they code for are the primary basis for grouping organisms into clades and determining likely paths of evolutionary descent Ex: Crocodiles are more closely related to birds than lizards… 5.4 U.2 Evidence for which species are part of a clade can be obtained from the base sequences of a gene or the corresponding amino acid sequence of a protein.
  • 168. All known organisms use DNA as genetic material The genetic code is universal. Gene sequences inserted in different organisms express the same proteins 5.4 U.2 Evidence for which species are part of a clade can be obtained from the base sequences of a gene or the corresponding amino acid sequence of a protein.
  • 169. The same 20 amino acids are used to make all proteins http://commons.wikimedia.org/wiki/File:Protein_primary_structure.svg
  • 170.
  • 171.
  • 172. Taking the example of the protein cytochrome c. It is not identical in all species because single point mutations in the DNA that codes for it can lead to different amino acids making up the protein. Both humans and chimpanzees have identical cytochrome c molecules, while rhesus monkeys share all but one of the amino acids. This suggests that humans and chimpanzees are more closely related to each other than to rhesus monkeys. http://www.flickr.com/photos/stuffinhergoose/571672799 5.4 U.2 Evidence for which species are part of a clade can be obtained from the base sequences of a gene or the corresponding amino acid sequence of a protein. I didn’t want to beI didn’t want to be closely related toclosely related to stinking humansstinking humans anywayanyway!
  • 173. Molecular biology Protein and DNA Structures Reveal Associations Between Organisms • Nuclear DNA code is highly conserved across phyla – although there are variations, there are no alternate codes • Nuclear DNA can be used to show associations between organisms when comparing very long suspected evolutionary times • Ribosomal RNA and mitochondrial DNA & RNA more useful when comparing shorter evolutionary times… they are inherently more variable over time because they are subjected to fewer selection pressures. • Small changes are seen in the DNA code between closely related species. • Monkeys, apes, and humans clearly have common ancestry 5.4 U.3 Sequence differences accumulate gradually so there is a positive correlation between the number of differences between two species and the time since they diverged from a common ancestor.
  • 174. Base Sequence Comparisons • Divergence (difference) in nucleotide base sequence allows us to draw relationships between different organisms. • Here, differences in nucleotide base sequence of humans and other primates compared • Chimps closest, spider monkeys most dissimilar 5.4 U.3 Sequence differences accumulate gradually so there is a positive correlation between the number of differences between two species and the time since they diverged from a common ancestor.
  • 175. Molecular Clocks • DNA undergoes relatively steady rates of mutation over time • More divergence in structure is assumed to mean more time has passed • Changes in homologous DNA from different species allows biologists to construct molecular clocks based on the rates of change in known and homologous DNA • This can aid in the dating of branching points in the evolutionary record 5.4 U.3 Sequence differences accumulate gradually so there is a positive correlation between the number of differences between two species and the time since they diverged from a common ancestor.
  • 176. The assumption is that these changes occur at a regular rate. (which may not always be the case) Therefore if species A had 5 differences from species B and 10 differences from species C, then the lineages for A and C must have split twice as long ago as for A and B C B A Time
  • 177. spines tendrils succulent leaves colored leaves Homologous structures leaves needles 5.4 U.4 Traits can be analogous or homologous.
  • 178. Analogous structures • Separate evolution of structures similar functions similar external form different internal structure & development different origin no evolutionary relationship Solving a similar problem with a similar solutionSolving a similar problem with a similar solution http://upload.wikimedia.org/wikipedia/commons/5/5c/Male_- _black_phase_-_short_tail_hawk.JPG http://www.redorbit.com/media/uploads/2004/1 0/40_03aa91083d476b07bcc9228e134d6c56.jpg Convergent evolution 5.4 U.4 Traits can be analogous or homologous.
  • 179. Convergent evolution • Fish: aquatic vertebratesvertebrates • Humpback Whale: aquatic mammalsmammals similar adaptations to life in the sea not closely related 5.4 U.4 Traits can be analogous or homologous.
  • 180. 5.4 U.4 Traits can be analogous or homologous.
  • 181. Convergent evolution • Flight evolved in 3 separate animal groups – evolved similar “solution” to similar “problems” – analogous structuresanalogous structures http://upload.wikimedia.org/wikipedia/commons /7/77/Big-eared-townsend-fledermaus.jpg http://upload.wikimedia.org/wikipedia/commons/e/e0/ 5.4 U.4 Traits can be analogous or homologous.
  • 182. 5.4.5 Cladograms are tree diagrams that show the most probable sequence of divergence in clades. • These two cladograms are identical (although they don’t look it) • The shape and the order of the terminal nodes does not matter. • The only information to be gathered from the cladograms below is the order of nesting of sister clades and the relative relatedness of species http://commons.wikimedia.org/wiki/File:Identical_cladograms.svg
  • 183. Human HumanChimp ChimpGorilla Gorilla Root Terminal nodes Sister clades: have a common ancestor Out group: Defines the ancestral characters Nodes: Common ancestors
  • 184.
  • 185. http://www.studentsoftheworld.info/infopays/photos/PER/orig/lamas.jpg 5.4 U.6 Evidence from cladistics has shown that classification of some groups based on structure did not correspond with the evolutionary origins of a group or species.
  • 186. http://www.scratchwireless.com/pad/wp-content/uploads/2015/02/SheepFlock.jpg 5.4 U.6 Evidence from cladistics has shown that classification of some groups based on structure did not correspond with the evolutionary origins of a group or species.
  • 187. http://ianadamsphotography.com/news/wp-content/uploads/2014/12/Bactrian-Camels-the-Wilds.jpg 5.4U.6 Evidence from cladistics has shown that classification of some groups based on structure did not correspond with the evolutionary origins of a group or species.
  • 188. Evolutionary Links Classification allows us to see evolutionary relationships. Organisms that are grouped together share a lot of similar features (homologous structures). These shared characteristics help us see how organisms have evolved from a common ancestor. HOWEVER, morphology (or there outward appearance) has its limitations in terms of evolutionary classification and DNA/ Amino Acid evidence is now far more accurate and trustworthy… http://www.flickr.com/photos/doug88888/3458057235/http://www.flickr.com/photos/mrapplegate/2423991076/ e.g. Llamas were originally compared to sheep but a study of their genetics later placed them in the camel family 5.4 U.6 Evidence from cladistics has shown that classification of some groups based on structure did not correspond with the evolutionary origins of a group or species.
  • 189. This is part of a molecular phylogeny of all of the living primates. It clearly shows chimpanzees (Pan) as more closely related to humans than to gorillas. It was made by comparing 34,927 base pairs sequenced from 54 genes taken from each of a single species in each genus. 5.4 U.7 Analyze cladograms including humans and other primates.
  • 190. 5.4 S.1 Analyze cladograms to deduce evolutionary relationships. 1 2 3 DCBA Which two species are most closely- related by evolution? Which node represents the earliest speciation / divergence? Which species is D more closely related to; A or B?
  • 191.
  • 192.
  • 193. Characters Shark Frog Kangaroo Human Vertebrae X X X X Two pairs of limbs X X X Mammary glands X X Placenta X 1) Compile a table of the characters being compared Modified from: http://www.bu.edu/gk12/eric/cladogram.pdf
  • 194. 2) Use the data to construct a Venn diagram, Start with the characteristic shared by all taxa in the biggest circle and work inwards
  • 195. Shark Frog Kangaroo Human Mammary Glands Lungs Vertebrae Placenta 3) Convert the Venn diagram into a cladogram
  • 196. Characters Sponge Jellyfish Flatworm Earth- worm Snail Fruit fly Starfish Human Cells with flagella X X X X X X X X Symmetry X X X X X X X Bilateral symmetry X X X X X X Mesoderm X X X X X Head develops first X X X Anus develops first X X Segmented body X X Calcified shell X Chitinous Exoskeleton X Water Vascular system X Vertebrae X Another Example:
  • 197. Cells with flagella: Sponge Symmetry: Jellyfish Bilateral symmetry: Flatworm Mesoderm Head develops first Anus develops first Segmented Body: Earthworm Calcified Shell: SnailChitinous exoskeleton: Fruit fly Water Vascular system: Starfish Vertebrae: Human
  • 198. Flagella Mesoderm Bilateral symmetry Symmetry Vertebrae Anus develops first Chitinous shell Head develops first Sponge StarfishFruit flySnail Flat- worm EarthwormJellyfish Human Water vascular system Calcified shell Segmented body
  • 199. • Morphology was used to classify the Figworts. Until recently, Figworts were the 8th largest family of angiosperms (flowering plants). It grew from 16 genera in 1789 to 275 genera • Flowers of plants in Figworts tend to be pretty uniform in their appearance, typically having corollas with bilateral symmetry • Taxonomists recently examined chloroplast genes and found the 5000 figwort species should be split into 5 different clades rather than just one. 5.4 A.1 Discuss reclassification of the figwort family using evidence from cladistics. http://www.jardinexotiqueroscoff.com/site/uploads/pictures/plante /800x800/scrophulariaceae-diascia-rigescens-13.jpg
  • 200. 5.4 A.1 Discuss reclassification of the figwort family using evidence from cladistics. http://upload.wikimedia.org/wikipedia/commons/2/2e/2007_Hippuris_vulgaris.jpg Hippuris vulgaris (out)
  • 201. 5.4 A.1 Discuss reclassification of the figwort family using evidence from cladistics. http://upload.wikimedia.org/wikipedia/commons/4/40/Castilleja_angustifolia_1.jpg Applegate Indian paintbrush (out)
  • 202. 5.4 A.1 Discuss reclassification of the figwort family using evidence from cladistics. Snapdragon (out)
  • 203. • Botanists in the 18th and 19th centuries used plant taxonomy to separate out groups. • Now with the use of modern techniques, less than half of the original species remain in the Figwort family; now only the 36th largest among angiosperms • Reclassification was helpful since old Figwort family was too large and dissimilar to be a helpful grouping • We should consider ourselves fortunate to be a part of what is one of the eras of greatest advancement in the field it is a tremendous age of discovery No longer a Figwort. Sad

Editor's Notes

  1. Lamarck noted how well-adapted organisms were to their environments, and believed that fossils could be understood as less perfect forms which had perished in the struggle for increasing perfection. He explained adaptation as a result of change caused by environmental pressures.
  2. Humans re so diverse but considered one species, whereas these Meadowlarks look so similar but are considered different species. MeadowlarksSimilar body & colorations, but are distinct biological species because their songs & other behaviors are different enough to prevent interbreeding