Week7 Quiz Help Excel File
•Télécharger en tant que XLS, PDF•
10 j'aime•1,240 vues

Excel File that goes with Week 7 Quiz Examples

Recommandé
Contenu connexe
Tendances
Tendances (13)
Similaire à Week7 Quiz Help Excel File
Similaire à Week7 Quiz Help Excel File (20)
Plus de Brent Heard
Plus de Brent Heard (20)
Dernier
Dernier (20)
Week7 Quiz Help Excel File
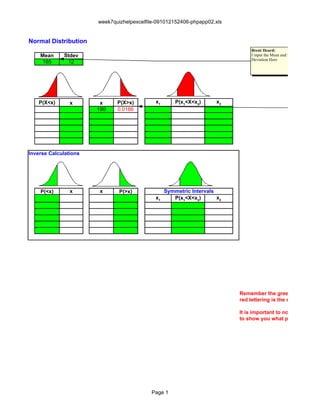
- 1. week7quizhelpexcelfile-091012152406-phpapp02.xls Normal Distribution Brent Heard: Mean Stdev I input the Mean and Standard Deviation Here 165 12 P(X<x) x x P(X>x) x1 P(x1<X<x2) x2 190 0.0186 Inverse Calculations P(<x) x x P(>x) Symmetric Intervals x1 P(x1<X<x2) x2 Remember the green areas are w red lettering is the resulting calc It is important to note that the ca to show you what part of the gra Page 1
- 2. week7quizhelpexcelfile-091012152406-phpapp02.xls nt Heard: ut the Mean and Standard ation Here Brent Heard: This gives me the "greaterthan probability" OR Bob scored in the top 2% of the class or specifically the top 1.86% 0 ber the green areas are where you can input your information, and the ering is the resulting calculation. ortant to note that the cartoon graphs are not actual graphs, but serve only you what part of the graph is being calculated. Page 2
- 3. Need Z Score? Mean 35 Standard Deviation 6 Value 41 Z Score 1 Brent Heard: Make sure you look at the formula so that you can understand the math Need Value associate with Z Score? Mean 35 Standard Deviation 6 Z Score -2 Brent Heard: Value 23 Make sure you look at the formula so that you can understand the math
- 4. Note that these are areas from left to right under the curve, the table in your book is also a good option. Z Score Area Z Score Area Z Score Area Z Score Area Z Score Area Z Score -3 0.0013 -2.49 0.0064 -1.98 0.0239 -1.47 0.0708 -0.96 0.1685 -0.45 -2.99 0.0014 -2.48 0.0066 -1.97 0.0244 -1.46 0.0721 -0.95 0.1711 -0.44 -2.98 0.0014 -2.47 0.0068 -1.96 0.0250 -1.45 0.0735 -0.94 0.1736 -0.43 -2.97 0.0015 -2.46 0.0069 -1.95 0.0256 -1.44 0.0749 -0.93 0.1762 -0.42 -2.96 0.0015 -2.45 0.0071 -1.94 0.0262 -1.43 0.0764 -0.92 0.1788 -0.41 -2.95 0.0016 -2.44 0.0073 -1.93 0.0268 -1.42 0.0778 -0.91 0.1814 -0.4 -2.94 0.0016 -2.43 0.0075 -1.92 0.0274 -1.41 0.0793 -0.9 0.1841 -0.39 -2.93 0.0017 -2.42 0.0078 -1.91 0.0281 -1.4 0.0808 -0.89 0.1867 -0.38 -2.92 0.0018 -2.41 0.0080 -1.9 0.0287 -1.39 0.0823 -0.88 0.1894 -0.37 -2.91 0.0018 -2.4 0.0082 -1.89 0.0294 -1.38 0.0838 -0.87 0.1922 -0.36 -2.9 0.0019 -2.39 0.0084 -1.88 0.0301 -1.37 0.0853 -0.86 0.1949 -0.35 -2.89 0.0019 -2.38 0.0087 -1.87 0.0307 -1.36 0.0869 -0.85 0.1977 -0.34 -2.88 0.0020 -2.37 0.0089 -1.86 0.0314 -1.35 0.0885 -0.84 0.2005 -0.33 -2.87 0.0021 -2.36 0.0091 -1.85 0.0322 -1.34 0.0901 -0.83 0.2033 -0.32 -2.86 0.0021 -2.35 0.0094 -1.84 0.0329 -1.33 0.0918 -0.82 0.2061 -0.31 -2.85 0.0022 -2.34 0.0096 -1.83 0.0336 -1.32 0.0934 -0.81 0.2090 -0.3 -2.84 0.0023 -2.33 0.0099 -1.82 0.0344 -1.31 0.0951 -0.8 0.2119 -0.29 -2.83 0.0023 -2.32 0.0102 -1.81 0.0351 -1.3 0.0968 -0.79 0.2148 -0.28 -2.82 0.0024 -2.31 0.0104 -1.8 0.0359 -1.29 0.0985 -0.78 0.2177 -0.27 -2.81 0.0025 -2.3 0.0107 -1.79 0.0367 -1.28 0.1003 -0.77 0.2206 -0.26 -2.8 0.0026 -2.29 0.0110 -1.78 0.0375 -1.27 0.1020 -0.76 0.2236 -0.25 -2.79 0.0026 -2.28 0.0113 -1.77 0.0384 -1.26 0.1038 -0.75 0.2266 -0.24 -2.78 0.0027 -2.27 0.0116 -1.76 0.0392 -1.25 0.1056 -0.74 0.2296 -0.23 -2.77 0.0028 -2.26 0.0119 -1.75 0.0401 -1.24 0.1075 -0.73 0.2327 -0.22 -2.76 0.0029 -2.25 0.0122 -1.74 0.0409 -1.23 0.1093 -0.72 0.2358 -0.21 -2.75 0.0030 -2.24 0.0125 -1.73 0.0418 -1.22 0.1112 -0.71 0.2389 -0.2 -2.74 0.0031 -2.23 0.0129 -1.72 0.0427 -1.21 0.1131 -0.7 0.2420 -0.19 -2.73 0.0032 -2.22 0.0132 -1.71 0.0436 -1.2 0.1151 -0.69 0.2451 -0.18 -2.72 0.0033 -2.21 0.0136 -1.7 0.0446 -1.19 0.1170 -0.68 0.2483 -0.17 -2.71 0.0034 -2.2 0.0139 -1.69 0.0455 -1.18 0.1190 -0.67 0.2514 -0.16 -2.7 0.0035 -2.19 0.0143 -1.68 0.0465 -1.17 0.1210 -0.66 0.2546 -0.15 -2.69 0.0036 -2.18 0.0146 -1.67 0.0475 -1.16 0.1230 -0.65 0.2578 -0.14 -2.68 0.0037 -2.17 0.0150 -1.66 0.0485 -1.15 0.1251 -0.64 0.2611 -0.13 -2.67 0.0038 -2.16 0.0154 -1.65 0.0495 -1.14 0.1271 -0.63 0.2643 -0.12 -2.66 0.0039 -2.15 0.0158 -1.64 0.0505 -1.13 0.1292 -0.62 0.2676 -0.11 -2.65 0.0040 -2.14 0.0162 -1.63 0.0516 -1.12 0.1314 -0.61 0.2709 -0.1 -2.64 0.0041 -2.13 0.0166 -1.62 0.0526 -1.11 0.1335 -0.6 0.2743 -0.09 -2.63 0.0043 -2.12 0.0170 -1.61 0.0537 -1.1 0.1357 -0.59 0.2776 -0.08 -2.62 0.0044 -2.11 0.0174 -1.6 0.0548 -1.09 0.1379 -0.58 0.2810 -0.07 -2.61 0.0045 -2.1 0.0179 -1.59 0.0559 -1.08 0.1401 -0.57 0.2843 -0.06 -2.6 0.0047 -2.09 0.0183 -1.58 0.0571 -1.07 0.1423 -0.56 0.2877 -0.05 -2.59 0.0048 -2.08 0.0188 -1.57 0.0582 -1.06 0.1446 -0.55 0.2912 -0.04 -2.58 0.0049 -2.07 0.0192 -1.56 0.0594 -1.05 0.1469 -0.54 0.2946 -0.03 -2.57 0.0051 -2.06 0.0197 -1.55 0.0606 -1.04 0.1492 -0.53 0.2981 -0.02 -2.56 0.0052 -2.05 0.0202 -1.54 0.0618 -1.03 0.1515 -0.52 0.3015 -0.01 -2.55 0.0054 -2.04 0.0207 -1.53 0.0630 -1.02 0.1539 -0.51 0.3050 0 -2.54 0.0055 -2.03 0.0212 -1.52 0.0643 -1.01 0.1562 -0.5 0.3085 0.01 -2.53 0.0057 -2.02 0.0217 -1.51 0.0655 -1 0.1587 -0.49 0.3121 0.02 -2.52 0.0059 -2.01 0.0222 -1.5 0.0668 -0.99 0.1611 -0.48 0.3156 0.03 -2.51 0.0060 -2 0.0228 -1.49 0.0681 -0.98 0.1635 -0.47 0.3192 0.04
- 5. -2.5 0.0062 -1.99 0.0233 -1.48 0.0694 -0.97 0.1660 -0.46 0.3228 0.05
- 6. Area Z Score Area Z Score Area Z Score Area Z Score Area Z Score 0.3264 0.06 0.5239 0.57 0.7157 1.08 0.8599 1.59 0.9441 2.1 0.3300 0.07 0.5279 0.58 0.7190 1.09 0.8621 1.6 0.9452 2.11 0.3336 0.08 0.5319 0.59 0.7224 1.1 0.8643 1.61 0.9463 2.12 0.3372 0.09 0.5359 0.6 0.7257 1.11 0.8665 1.62 0.9474 2.13 0.3409 0.1 0.5398 0.61 0.7291 1.12 0.8686 1.63 0.9484 2.14 0.3446 0.11 0.5438 0.62 0.7324 1.13 0.8708 1.64 0.9495 2.15 0.3483 0.12 0.5478 0.63 0.7357 1.14 0.8729 1.65 0.9505 2.16 0.3520 0.13 0.5517 0.64 0.7389 1.15 0.8749 1.66 0.9515 2.17 0.3557 0.14 0.5557 0.65 0.7422 1.16 0.8770 1.67 0.9525 2.18 0.3594 0.15 0.5596 0.66 0.7454 1.17 0.8790 1.68 0.9535 2.19 0.3632 0.16 0.5636 0.67 0.7486 1.18 0.8810 1.69 0.9545 2.2 0.3669 0.17 0.5675 0.68 0.7517 1.19 0.8830 1.7 0.9554 2.21 0.3707 0.18 0.5714 0.69 0.7549 1.2 0.8849 1.71 0.9564 2.22 0.3745 0.19 0.5753 0.7 0.7580 1.21 0.8869 1.72 0.9573 2.23 0.3783 0.2 0.5793 0.71 0.7611 1.22 0.8888 1.73 0.9582 2.24 0.3821 0.21 0.5832 0.72 0.7642 1.23 0.8907 1.74 0.9591 2.25 0.3859 0.22 0.5871 0.73 0.7673 1.24 0.8925 1.75 0.9599 2.26 0.3897 0.23 0.5910 0.74 0.7704 1.25 0.8944 1.76 0.9608 2.27 0.3936 0.24 0.5948 0.75 0.7734 1.26 0.8962 1.77 0.9616 2.28 0.3974 0.25 0.5987 0.76 0.7764 1.27 0.8980 1.78 0.9625 2.29 0.4013 0.26 0.6026 0.77 0.7794 1.28 0.8997 1.79 0.9633 2.3 0.4052 0.27 0.6064 0.78 0.7823 1.29 0.9015 1.8 0.9641 2.31 0.4090 0.28 0.6103 0.79 0.7852 1.3 0.9032 1.81 0.9649 2.32 0.4129 0.29 0.6141 0.8 0.7881 1.31 0.9049 1.82 0.9656 2.33 0.4168 0.3 0.6179 0.81 0.7910 1.32 0.9066 1.83 0.9664 2.34 0.4207 0.31 0.6217 0.82 0.7939 1.33 0.9082 1.84 0.9671 2.35 0.4247 0.32 0.6255 0.83 0.7967 1.34 0.9099 1.85 0.9678 2.36 0.4286 0.33 0.6293 0.84 0.7995 1.35 0.9115 1.86 0.9686 2.37 0.4325 0.34 0.6331 0.85 0.8023 1.36 0.9131 1.87 0.9693 2.38 0.4364 0.35 0.6368 0.86 0.8051 1.37 0.9147 1.88 0.9699 2.39 0.4404 0.36 0.6406 0.87 0.8078 1.38 0.9162 1.89 0.9706 2.4 0.4443 0.37 0.6443 0.88 0.8106 1.39 0.9177 1.9 0.9713 2.41 0.4483 0.38 0.6480 0.89 0.8133 1.4 0.9192 1.91 0.9719 2.42 0.4522 0.39 0.6517 0.9 0.8159 1.41 0.9207 1.92 0.9726 2.43 0.4562 0.4 0.6554 0.91 0.8186 1.42 0.9222 1.93 0.9732 2.44 0.4602 0.41 0.6591 0.92 0.8212 1.43 0.9236 1.94 0.9738 2.45 0.4641 HP0.42 Authorized0.6628 Customer: 0.93 0.8238 1.44 0.9251 1.95 0.9744 2.46 0.4681 0.43 0.6664 Answer to z score that 0.94 0.8264 1.45 0.9265 1.96 0.9750 2.47 corresponds to an area of . 0.4721 0.44 be 0.6700 4840 would -0.04 0.95 0.8289 1.46 0.9279 1.97 0.9756 2.48 0.4761 0.45 0.6736 0.96 0.8315 1.47 0.9292 1.98 0.9761 2.49 0.4801 0.46 0.6772 0.97 0.8340 1.48 0.9306 1.99 0.9767 2.5 0.4840 0.47 0.6808 0.98 0.8365 1.49 0.9319 2 0.9772 2.51 0.4880 0.48 0.6844 0.99 0.8389 1.5 0.9332 2.01 0.9778 2.52 0.4920 0.49 0.6879 1 0.8413 1.51 0.9345 2.02 0.9783 2.53 0.4960 0.5 0.6915 1.01 0.8438 1.52 0.9357 2.03 0.9788 2.54 0.5000 0.51 0.6950 1.02 0.8461 1.53 0.9370 2.04 0.9793 2.55 0.5040 0.52 0.6985 1.03 0.8485 1.54 0.9382 2.05 0.9798 2.56 0.5080 0.53 0.7019 1.04 0.8508 1.55 0.9394 2.06 0.9803 2.57 0.5120 0.54 0.7054 1.05 0.8531 1.56 0.9406 2.07 0.9808 2.58 0.5160 0.55 0.7088 1.06 0.8554 1.57 0.9418 2.08 0.9812 2.59
- 7. 0.5199 0.56 0.7123 1.07 0.8577 1.58 0.9429 2.09 0.9817 2.6
- 8. Area Z Score Area 0.9821 2.61 0.9955 0.9826 2.62 0.9956 0.9830 2.63 0.9957 0.9834 2.64 0.9959 0.9838 2.65 0.9960 0.9842 2.66 0.9961 0.9846 2.67 0.9962 0.9850 2.68 0.9963 0.9854 2.69 0.9964 0.9857 2.7 0.9965 0.9861 2.71 0.9966 0.9864 2.72 0.9967 0.9868 2.73 0.9968 0.9871 2.74 0.9969 0.9875 2.75 0.9970 0.9878 2.76 0.9971 0.9881 2.77 0.9972 0.9884 2.78 0.9973 0.9887 2.79 0.9974 0.9890 2.8 0.9974 0.9893 2.81 0.9975 0.9896 2.82 0.9976 0.9898 2.83 0.9977 0.9901 2.84 0.9977 0.9904 2.85 0.9978 0.9906 2.86 0.9979 0.9909 2.87 0.9979 0.9911 2.88 0.9980 0.9913 2.89 0.9981 0.9916 2.9 0.9981 0.9918 2.91 0.9982 0.9920 2.92 0.9982 0.9922 2.93 0.9983 0.9925 2.94 0.9984 0.9927 2.95 0.9984 0.9929 2.96 0.9985 0.9931 2.97 0.9985 0.9932 2.98 0.9986 0.9934 2.99 0.9986 0.9936 3 0.9987 0.9938 3.01 0.9987 0.9940 3.02 0.9987 0.9941 3.03 0.9988 0.9943 3.04 0.9988 0.9945 3.05 0.9989 0.9946 3.06 0.9989 0.9948 3.07 0.9989 0.9949 3.08 0.9990 0.9951 3.09 0.9990 0.9952 3.1 0.9990
- 9. 0.9953 3.11 0.9991
- 10. Normal Distribution Mean Stdev Br 82 4 Ii De P(X<x) x x P(X>x) x1 P(x1<X<x2) x2 80.00 0.5328 86.00 Inverse Calculations P(<x) x x P(>x) Symmetric Intervals x1 P(x1<X<x2) x2
- 11. Brent Heard: I input the Mean and Standard Deviation Here Brent Heard: I put the two values here and see the Brent Heard: probability is 0.5328 Remember the green areas are where you can input your information, and the red lettering is the resulting calculation. It is important to note that the cartoon graphs are not actual graphs, but serve only to show you what part of the graph is being calculated.