More Related Content
Similar to Over 250,000 financial (1)
Similar to Over 250,000 financial (1) (15)
More from Stephen Abram (20)
Over 250,000 financial (1)
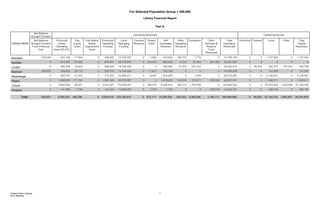
- 1. For Selected Population Group > 250,000
Library Financial Report
Part A
Library Name
Net Balance
Brought Forward
Operating Revenues Capital Revenues
Net Balance
Brought Forward
From Previous
Year
Provincial
Library
Operating
Grant (PLOG)
Pay
Equity
Grant
First Nation
Salary
Supplement
Grant
Provincial
Operating
Funding
Local
Operating
Funding
Contract
Revenue
Project
Grant
Self
Generated
Revenue
Other
Operating
Revenue
Donations Debt
Services &
Reserve
Fund
Revenues
Total
Operating
Revenues
Provincial Federal Local Other Total
Capital
Revenues
Brampton 140,000 341,185 17,644 0 358,829 13,740,257 0 4,690 574,922 108,707 1,775 0 14,789,180 0 0 1,127,000 0 1,127,000
Hamilton 0 812,043 137,408 0 949,451 28,145,940 0 314,243 608,000 2,215 20,255 281,493 30,321,597 0 0 0 0 0
London 0 580,209 18,620 0 598,829 18,780,000 0 0 849,062 31,072 231,447 0 20,490,410 0 98,025 222,727 130,047 450,799
Markham 399,037 208,662 20,116 0 228,778 13,108,454 0 11,413 732,193 0 0 0 14,080,838 0 0 131,000 0 131,000
Mississauga 0 693,781 21,422 0 715,203 23,969,911 0 8,091 1,324,203 0 1,059 0 26,018,467 0 0 2,148,561 0 2,148,561
Ottawa 0 1,208,583 171,745 0 1,380,328 40,578,587 0 0 1,918,220 142,335 313,271 605,000 44,937,741 0 0 7,346,011 0 7,346,011
Toronto 0 5,505,920 68,007 0 5,573,927 170,436,261 0 330,370 6,436,913 349,013 1,797,548 0 184,924,032 0 0 25,810,825 1,538,480 27,349,305
Vaughan 0 141,898 1,336 0 143,234 13,990,223 0 3,310 7,316 0 0 278,618 14,422,701 0 0 358,194 0 358,194
Total : 539,037 9,492,281 456,298 0 9,948,579 322,749,633 0 672,117 12,450,829 633,342 2,365,355 1,165,111 349,984,966 0 98,025 37,144,318 1,668,527 38,910,870
Ontario Public Libraries 1
2014 Statistics
- 2. For Selected Population Group > 250,000
Library Financial Report
Part B
Library Name
Operating Expenditures Capital
Expenditures
Materials Staff
Training
Staffing Contract Payments
to Library Board
Facilities/
Utilities
Phone &
Fax
Dedicated
Internet
Connectivity
Computer
Equipment &
Services
Other Operating
Expenditures
Debt Charges & Transfer to
Government Services
Funds Returned to
Government Sources
Total Operating
Expenditues
Capital
Expenditues
Brampton 1,585,852 84,175 10,486,808 0 1,956,252 67,171 41,055 575,216 580,888 67,076 0 15,444,493 878,103
Hamilton 3,431,976 153,926 19,648,354 0 4,430,232 116,893 140,301 99,290 1,343,209 957,416 0 30,321,597 0
London 2,001,023 105,173 14,361,024 0 2,837,211 47,053 178,993 305,545 346,036 241,735 0 20,423,793 450,799
Markham 2,895,778 77,103 9,317,295 0 1,255,336 15,728 0 0 251,561 0 0 13,812,801 131,000
Mississauga 2,657,034 65,853 20,560,498 0 2,310,581 4,399 0 116,002 304,100 0 0 26,018,467 2,086,000
Ottawa 5,258,489 303,248 31,381,227 0 4,144,498 32,746 0 1,115,549 2,402,543 3,355,934 0 47,994,234 8,121,552
Toronto 17,854,135 366,617 140,395,647 0 15,076,680 728,507 0 4,598,325 7,815,516 795,353 0 187,630,780 11,202,174
Vaughan 2,415,941 33,343 9,878,494 0 794,498 22,648 10,098 254,172 1,013,507 0 0 14,422,701 358,194
Total : 38,100,228 1,189,438 256,029,347 0 32,805,288 1,035,145 370,447 7,064,099 14,057,360 5,417,514 0 356,068,866 23,227,822
Ontario Public Libraries 2
2014 Statistics
- 3. For Selected Population Group > 250,000
Library Financial Report
Graph
Operating Funds as % of Total Operating Revenue
0.00
20.00
40.00
60.00
80.00
100.00
Provincial
Operating
Funding
Local Operating
Funding
Contract
Revenue
Project Grant Donations Self Generated
Revenue
Debt Services &
Reserve Fund
Revenues
Other Operating
Revenue
2.84
92.22
0.19 0.68
3.56
0.33 0.18
Materials & Salaries Expenses as % of Total Operating Expenditures
0.00
10.00
20.00
30.00
40.00
50.00
60.00
70.00
80.00
Materials Staff Training Staffing
10.70
0.33
71.90
Ontario Public Libraries 3
2014 Statistics