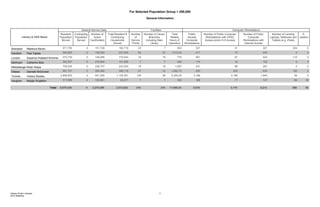
1. For Selected Population Group > 250,000
General Information
Library & CEO Name
General Service Data Facilities Computer Workstations
Resident
Population
Served
Contracting
Population
Served
Number of
Active
Cardholders
Total Resident &
Contracting
Households
Served
Number
of
Service
Points
Number of Library
Branches
Including Main
Library
Total
Weekly
Hours of
Operation
Public
Access
Computer
Workstations
Number of Public Computer
Workstations with OPAC
Access and/or ILS Access
Number of Public
Computer
Workstations with
Internet Access
Number of Lending
Laptops, Netbooks and
Tablets (e.g. iPads)
E-
readers
Brampton Rebecca Raven 571,700 0 151,728 160,710 23 7 903 321 31 321 204 0
Hamilton Paul Takala 545,850 0 158,593 221,000 62 23 1,013.24 477 73 404 0 0
London Susanna Hubbard Krimmer 373,730 0 148,085 170,543 16 16 775 601 67 424 110 0
Markham Catherine Biss 342,037 0 218,500 101,599 7 7 440 174 16 152 0 0
Mississauga Rose Vespa 759,000 0 236,757 243,000 18 18 1,087 431 88 291 0 0
Ottawa Danielle McDonald 951,727 0 285,480 398,119 57 33 1,692.75 630 630 630 150 0
Toronto Vickery Bowles 2,808,503 0 941,265 1,125,391 128 99 5,355.25 2,188 2,188 1,844 56 0
Vaughan Margie Singleton 317,889 0 129,901 93,271 7 7 393 188 17 147 66 35
Total : 6,670,436 0 2,270,309 2,513,633 318 210 11,659.24 5,010 3,110 4,213 586 35
Ontario Public Libraries 1
2014 Statistics
2. For Selected Population Group > 250,000
General Information
Graph
Service Points per 1,000 and 10,000 Population
0.00
0.10
0.20
0.30
0.40
0.50
Service Points per 1,000 Population Service Points per 10,000 Population
0.05
0.48
Ontario Public Libraries 2
2014 Statistics