1. For Selected Population Group > 250,000
Library Personnel Report
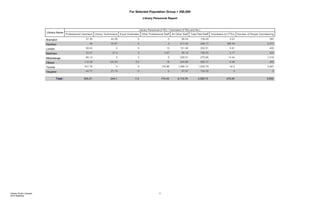
Library Name
Library Personnel (FTE) / Volunteers (FTEs and No.)
Professional Librarians Library Technicians Excel Graduates Other Professional Staff All Other Staff Total Paid Staff Volunteers (in FTEs) Number of People Volunteering
Brampton 27.39 44.56 0 0 66.54 138.49 4.91 393
Hamilton 46 33.57 0 3 211.54 294.11 396.49 3,073
London 58.43 0 0 13 131.49 202.91 5.61 409
Markham 33.41 21.4 2 4.57 95.14 156.53 0.17 420
Mississauga 66.14 0 0 0 209.51 275.66 14.44 1,016
Ottawa 112.28 122.83 5.2 18 224.86 483.17 6.46 260
Toronto 431.79 0 0 135.86 1,088.14 1,655.79 42.2 3,087
Vaughan 44.77 21.74 0 0 87.57 154.09 0 0
Total : 820.21 244.1 7.2 174.43 2,114.79 3,360.75 470.28 8,658
Ontario Public Libraries 1
2014 Statistics
2. For Selected Population Group > 250,000
Library Personnel Report
Graph
% of Total Paid Staff
0.00
4.00
8.00
12.00
16.00
20.00
24.00
28.00
Library Technicians as % Total Paid Staff Professional Librarians as % Total Paid Staff
24.41
7.26
Average Numbers per Service Point
0.00
2.00
4.00
6.00
8.00
10.00
12.00
Library Technicians Professional Librarians Total Paid Staff Total Volunteers
0.77
2.58
10.57
1.48
Ontario Public Libraries 2
2014 Statistics