Fibonacci And Elliott Wave Relationships
•
28 likes•17,414 views

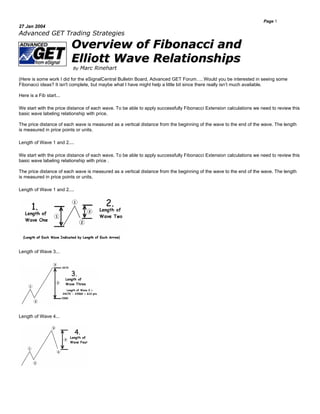
http://www.thechartist.com.au We start with the price distance of each wave. To be able to apply successfully Fibonacci Extension calculations we need to review this basic wave labeling relationship with price.

Recommended
More Related Content
Viewers also liked
Viewers also liked (12)
Recently uploaded
Recently uploaded (20)
Fibonacci And Elliott Wave Relationships
- 1. Page 1 27 Jan 2004 Advanced GET Trading Strategies Overview of Fibonacci and Elliott Wave Relationships By Marc Rinehart (Here is some work I did for the eSignalCentral Bulletin Board, Advanced GET Forum…. Would you be interested in seeing some Fibonacci ideas? It isn't complete, but maybe what I have might help a little bit since there really isn’t much available. Here is a Fib start... We start with the price distance of each wave. To be able to apply successfully Fibonacci Extension calculations we need to review this basic wave labeling relationship with price. The price distance of each wave is measured as a vertical distance from the beginning of the wave to the end of the wave. The length is measured in price points or units. Length of Wave 1 and 2.... We start with the price distance of each wave. To be able to apply successfully Fibonacci Extension calculations we need to review this basic wave labeling relationship with price . The price distance of each wave is measured as a vertical distance from the beginning of the wave to the end of the wave. The length is measured in price points or units. Length of Wave 1 and 2.... Length of Wave 3... Length of Wave 4...
- 2. Page 2 Length of Wave 5... Now before we start on how to calculate a Fibonacci Extension, let's introduce what Fibonacci and 'Extensions' actually are, how does it relate to Elliott Wave theory..... Fibonacci ratios are mathematical ratios derived from the Fibonacci sequence. The Fibonacci sequence is the work of Leonardo Fibonacci, circa 1180 ACE. The Fibonacci sequence is used in many applications, including engineering, space studies, stock market actions, and many other fields. Fibonacci is a proven approach for measure price movement relationships. For Elliott Wave theorists, it means Fibonacci numbers are tools to help guide us in our interpretation where we think price movements will go, based on human 'fear and greed' actions, reactions, or over-reactions factors. The most common Fibonacci ratios used in the stock markets are: 1 - 1.618 - 2.618 - 4.23 - 6.85 (multiples) 0.14 - 0.25 - 0.38 - 0.5 & 0.618 (ratios) There are other numbers, but these are the ones we tend to focus on for defining at least the short-term wave patterns. Our ultimate goal here is to return to the question, "How do I calculate a Fibonacci extension?" But we need to continue to work with some basic, yet very important information if we want to finally see how Fibonacci extension calculations interplay in all this.... Have you ever wondered why wave counts are labeled when and were? Do you wonder the same about Wave (i.e., - 5) projections? The first wave in an Elliott sequence is Wave 1. Later on when we want to calculate a Fibonacci Extension calculation, remember, this is the area at which we will start our calculation. We start our Fib Exe at the beginning of a new Elliott Wave sequence. Wave 2 is always related to Wave 1....
- 3. Page 3 The most common retracements we look for in a typical Wave 2 pullback are either a 50% or 62% retracement of Wave 1.... While we are on the subject of Wave 2's, here are a some statistical information behind Wave 2's. We typically expect only 12% of Wave 2's to hold 38% retracements of Wave 1.... We anticipate 73% of Wave 2 retracements between 50% to 60%.... We anticipate 15% of Wave 2's to retrace below the 62%.... Once we have seen evidence of Wave 2 holding, we can use the Fibonacci Extension to calculate some Wave 3 targets. Wave 3 is related to Wave 1. Typically we monitor for the following Fibonacci relationships: Wave 3 = either 1.62 x length of Wave 1 or 2.62 x the length of Wave 1 or 4.25 x the length of Wave 1 The most common multiples of Wave 1 to Wave 3 are the 1.62 and 2.62 numbers. (If Wave 3 is extending, we typically monitor for 4.25 or higher ratios.)
- 4. Page 4 Fibonacci Extension calculation-- Click on the 'Fib Ext' icon. Start a Wave 3 extension calculation by clicking the mouse at the beginning of the sequence, or in this case the bottom of Wave 1. Click the mouse a second time on the end of Wave 1. Then click a 3rd time at the end of Wave 2. (Wave 3 projections or targets should show up on the chart after the second click, and will be locked into place with the final 3rd click of the mouse.) If you wish to toggle 'ON' or 'OFF' a Fibonacci Extension (Fib Ext) number, highlight the either the Fib Ext icon and right click, or highlight a Fib number already drawn and right click. Turn 'off' or 'on' what you want to see displayed. For those unfamiliar with the software, if you wish to toggle 'ON' or 'OFF' a Fibonacci Extension (Fib Ext) number, highlight the either the Fib Ext icon and right click, or highlight a Fib number already drawn and right click. Turn 'off' or 'on' what you want to see displayed. Before we go to Wave 4 pullbacks, I think it might help our understanding of Wave 3's if we delved into-- at least in a very general sense-- some Fibonacci statistics behind a typical Wave 3. I usually never ever quote statistics because I personally believe statistics are deceptive, as trading (and life in general) can be extremely complex. Simple statistics don't do justice for all the variables that interplay in pattern matching behavior. So I relunctantly offer these numbers only as a general guideline for anticipating Wave 3 behaviors. For those of you newer to Elliott Wave it might help you a little bit as you see Wave 3 counts evolve over time and are trying to anticipate Wave 3 completions. Only approximately 2% of the time will a labeled Wave 3 be less than W1.
- 5. Page 5 As a rule, Wave 3 is never the shortest, usually longer than W1 and W2. I posted a while back a PDF file where I talked about this general rule. If you would like to review it, click here. I may be wrong, but I wish the rule said, "Wave 3 should never be the shortest," because it can happen in extremely remote or 2% or the time, if that. (I don't believe it is totally, absolutely impossible, just very very remote.) We anticipate 15% of Wave 3's trade between 1 and 1.60 of Wave 1.... As an aside comment here, when I see a Wave 3 labeled that is only between 1 and 1.6 of Wave 1 and 2, I will typically call a wave count "Wave 1 or A, Wave 2 or B, Wave 3 or C." The reason why I do this is the mathematical relationships of Wave 1-2-3 and Wave A- B-C patterns is the same until Wave 3 finally extends beyond 1.618. When I think this way I tend to avoid trading surprises when a promising Wave 3 building fails and falls into a A-B-C pattern. I always have an alternative plan of escape or reversal strategy until Wave 3 becomes more successful. We can anticipate 45% of the time Wave 3's will push to between 1.6 and 1.75%.... Again, I am always a little bit defensive and will manage a position with tighter trailing stops or escape stategies until I see more conviction in the Wave 3. Once Wave 3 is above 1.75, I begin to breath less deeply, relax a little bit more, and will adopt some conservative strategies to help me better stay with the trend as it becomes even more evident. To me, the 1.60 to 1.75 is the critical junction between a 'last-chance' Wave C failure or a stronger Wave 3 trend continuing to build.
- 6. Page 6 We can anticipate a third or 30% of the time a Wave 3 pushes to approximately the 1.75 to 2.62 range.... When I see a Wave 3 push this far, I personally am elated. I am more confident a higher quality, "possible Type 1 Buy/Sell opportunity" could be created with this type of Wave 3 strength. I am more confident in the possiblity Wave 3 could continue to extend higher in a more complex Wave 3 trend. In general, the odds begin to work 60% or greater in my favor I can manage to find some better quality trades still because everyone else who has yet to trade into this strength is now finally growing convinced with more evidence of strength behind the Wave 3. We can anticipate 8% of Wave 3's will extend beyond 2.62 or higher Fibonacci numbers.... Here is where I wish I had time to add more advanced knowledge. When we see 2.62 or greater Wave 3's in progress, these are the types of markets even non-Elliott Wave traders notice. This is what I think most institutional traders will recognize as "momentum" trading. Momentum trading is where one attempts to buy shallow pullbacks in order to try and catch a piece of what now is recognized as clearly a strong trend in progress. It is like going to Hawaii and surfing the bigger waves. It can be a lot of fun catching one of these bigger waves-- if even close to shore-- but boy can it be dangerous if an entry or exit strategy is not well executed! Ratios for Wave 4 At some point during a Wave 3, it begins to lose energy. During this period, trader's start to wonder, and become willing to lock in some profits. We call this time period a Wave 4 "profit-taking" pullback, or a correction. Once profit-taking is finished, the previous trend returns. Wave 4 is related to Wave 3. Wave 4 is related to Wave 3 by the following standard ratios: Wave 4 = either
- 7. Page 7 24% of Wave 3, or 38% of Wave 3, or 50% of Wave 3, or 62% of Wave 3 Background statistics of Wave 4 Ratios-- We can anticipate only 15% of the time Wave 4 to retrace between 24% to 38%.... If you have followed my charts from the former Advanced GET "Trader's Outlook" and now here at eSignalCentral, you will see I really like to find 25 to 38% retracement setups for Type 1 Buy/Sell ideas. If 25-38% holds, it represents the quickest odds for a return to the strong Wave 3 trend. Here is a very recent real example of a chart I posted. GLW daily was posted at an AGET Forum thread as it began to breakout. Click here to review the real GLW daily example and later results. One consideration at the time of posting, it was holding at a minimal 25% retracement, starting from W2 and ending at Wave 3 top.
- 8. Page 8 We can anticipate 60% of the time Wave 4 to retrace between 30% and 50%.... Here is a sample of what a 30% to 50% Wave 4 pullback might look like.... We can anticipate 15% of the time Wave 4 to retrace between 50% and 62%.... Here is a sample of what a 50% to 62% Wave 4 pullback might look like....
- 9. Page 9 We can anticipate 10% of the time Wave 4 retracing 62% or greater.... Here is a real-time example where HGH2 daily retraced in a Wave 4 more than 62%. This example I posted at the former AGET Trader's Outlook as it retraced below 62% but stopping at 75%. It was shown before it rallied again (see next post).... Here is what came later as it rallied off 75% to trend up again to a newer contract high.... Ratios for Wave 5 Wave 5 has two primary relationships. Wave 5 behavior has a direct correlation to the Fibonacci relationship of Wave 3. Relationship #1- If Wave 3 is greater than 1.62, or extended, Wave 5 ratios are as follows: Wave 5 either = Wave 1, or = 1.62 x Wave 1, or = 2.62 x Wave 1
- 10. Page 10 Relationship #2-- If Wave 3 is less than 1.62, Wave 5 ratios are as follows: When Wave 3 is less than 1.62, Wave 5 will often overextend. The ratio of Wave 5 will be based on the entire length from the beginning of Wave 1 to the top of Wave 3. Extended Wave 5 = either 0.62 x length (beginning of Wave 1 to top of Wave 3) or = length of (beginning of Wave 1 to top of Wave 3) or = 1.62 x length of (beginning of Wave 1 to top of Wave 3) Odds are very good Wave 5 becomes extended if Wave 3 is less than 1.62 X Wave One. Here are some parameters to look for under this condition-- W5 = .62 X Length of 0 to 3 W5 = 1 X Length of 0 to 3 W5 = 1.62 X Length of 0 to 3
- 11. Page 11 Here is an example where Wave 5 = .0618. The Wave 5 Fibonacci Extension calculation starts at the beginning of Wave 1, to end of Wave 3 to end of Wave 4. The calculation is the same no matter what direction the trend is. The example below is generated from a down trend Wave 5.... Even when Wave 5 is extended, we have found many instances where the Wave 5 will often end up inside the ratio values calculated from 0 to 3, where 0 is the start of Wave 1. The length of 0 to 3 is extended from the end of Wave 4. Wave 5 typically ends inside the 62% window. Here is a quick summary illustration....