
Recommended
More Related Content
What's hot
What's hot (20)
Viewers also liked
Viewers also liked (19)
Similar to J0362069073
Similar to J0362069073 (20)
Recently uploaded
Recently uploaded (20)
J0362069073
- 1. The International Journal Of Engineering And Science (IJES) || Volume || 3 || Issue || 6 || Pages || 69-73 || 2014 || ISSN (e): 2319 – 1813 ISSN (p): 2319 – 1805 www.theijes.com The IJES Page 69 Analysis on X-Ray Parameters of Exposure by Measuring X-Ray Tube Voltage and Time of Exposure 1, D.Tilak Raju, 2, K.Shanthi 1, Department of ECE, Vignan’s Institute of Engineering for Woman 2, Department of ECE, Baba Institute of Technology and Sciences ---------------------------------------------------------------ABSTRACT------------------------------------------------------ One of the typical human diagnostic techniques is x-ray. The x-ray examination depends on the range of radiation given to the subject. The radiation from the x- ray depends primarily upon the x-ray tube current (mA) tube voltage (kVp) and exposure time (s). These parameters define the dosage. The aim of this work is to explore and analyze the x-ray exposure parameters levels which helps to diagnose and also has some hazardous health effects upon human exposure or the tissue which is being irradiated. Work has been carried out on people of different age groups ranging from 5yrs – 70 yrs. X -ray projections have been considered and the parameters influencing the radiography are being observed and are tabulated. Relations between the tube voltages (kVp) and exposure time (ms) have been closely observed and analysis have been done. This paper our reference levels for x-ray radiographic projections are carried as per the specifications of AERB and NRPB KEYWORDS - kVp (Kilo Voltage Peak), mA (Milli Amperes) --------------------------------------------------------------------------------------------------------------------------------------- Date of Submission: 30 May 2014 Date of Publication: 15 June 2014 --------------------------------------------------------------------------------------------------------------------------------------- I. INTRODUCTION X-rays are electromagnetic waves or photons not emitted from the nucleus, but normally emitted by energy changes in electrons x-rays are radiations possessing high energy and penetrating capacity. They are classified as ionizing radiation and are extensively used for industrial, medical diagnostic and therapeutic purposes. Digital radiography is becoming a standard technique, due to better quality of images and reduced patient dose. In order to avoid unnecessary radiation dose to the patient, recent experience has shown that there is a need to consider many factors, some of which were not considered in analogue techniques. It is important to keep the radiation doses to patients at a minimum, because the use of X-rays in medicine for diagnosis represents the largest man-made source of public exposure to ionizing radiation. Quality control of X-ray units is necessary to ensure good performance and minimum dose to patients. In quality control, several parameters are measured. By analyzing and also by several recommendations the main parameters are: (a) high voltage applied to the X-ray tube (b) exposure time. Many factors influence the level of radiation dose delivered to the subject undergoing medical x-ray examinations. These can be responsible for large does variations within and between hospitals for standard size subjects, undergoing the same examination. Diagnostic reference levels help to facilitate and encourage the reduction of dose variation from diagnostic center to diagnostic center. For Diagnostic purposes, the optimizations of exposure involve the relationship of three core aspects. i) Choice of radiographic technique ii) Radiation dose to the subject. iii) Diagnostic quantity of the radiographic image. These three aspects are critical for the diagnostic quantity of the radiographic image. The four main exposure parameters are tube potential (kV), tube intensity (mA), exposure time (s) and focus to detector distance (cm). Exposure time and tube intensity could be a unique exposure factor (mAs).The kVp is the factor which controls the energy of the electrons as they move across the tube, or the speed of the electrons. The higher the kVp the greater the impact of the electrons with the target or anode. The greater the kVp the greater the penetration. The ―p‖ stands for peak, therefore kVp means kilo voltage peak. Peak denotes highest voltage attained in a given electrical alternating current. By controlling the energy of the x-ray beam, kVp controls the quality of the beam. Other factor which is mAs means the rate of flow of electrons for a preselected time.
- 2. Analysis on X-Ray Parameters of Exposure by Measuring X-Ray Tube Voltage and Time of Exposure www.theijes.com The IJES Page 70 The mAs also mean mA* time (seconds). We can arrive at specific mAs value with various combinations of mA and s. The mAs control the number of electrons produced at the cathode and subsequently the number of x-rays produced at the anode. The mAs control the quantitative character of the exposure factor. Exposure factors influence and determine the quantity and quality of the x-ray beam. The exposure of subjects is part of their medical diagnosis or treatment. The exposure of individuals is part of health screening programmes. For some objects, e.g. chest there are very large differences in attenuation within the object. Contrast and detail must be visualized over the wide range of x-ray intensities produced by such object. One possible way to achieve diagnostically acceptable contrast and detail is by increasing the kVp, which will produce a narrower distribution of x-ray intensities incident on the film and will reduce the contrast even more, however producing some contrast and detail in relevant x-ray intensity distribution on the film. High kVp depends on the different electron densities between tissues. Thus, bone appears more transparent allowing features behind to be observed. Therefore higher kV produces less variation in attenuation (differential absorption) resulting in lower contrast. Adequate contrast is necessitated in order to demonstrate that many different shades of gray needed to visualize the different tissue component in the chest. Low contrast is required due to different substances composed by chest. The flip side of high kVp is high kV reduces skin dose, but lead to higher depth dose and more scattering of x-rays. In this case the entrance surface dose and system dose are to be considered. The entrance surface dose is the dose entering into the patient. The system dose is that the imaging plate or the detector receives, which is automatically controlled by the system. II. MATERIALS AND METHODS Tests are being conducted and measurements are being observed on a GE X -ray Generator High frequency inverter type generator with a rating of 80kW, For Radiographic purpose tube voltage of (40 - 150 kV) and tube current of 1000 mA. In our study we concentrated on High kVp technique to reduce the radiation dose to the subject. Absorption by the body is the essence, the more mAs (quantity), the more the absorption of the body. The kVp is the (quality) energy behind the mAs. The greater the push, the more penetration to the body, the less that are absorbed (i.e. lower the dose) . The use of high kVp which is above 100 comes with a requirement to use grid to reduce the amount of high energy scatter reaching the film.The assessment of subject’s doses in diagnostic radiology involves statistical data collection, recording of dose metric measurements. Some of reliable information has been gathered from various health care diagnostic centers. Our study basically following the guidelines of AERB was conducted in different x- ray machines. Initial phase of our work has been concentrated on collection of data of different subjects undergoing x-ray radiation. The data collected was primarily focused by systematic random method representing reasonably good geographic spread and size. For each X-ray room, machine specific data such as model, manufacturer, year of installation, waveform, added filtration and other parameters are recorded.The following x-ray projections were studied in our work. Posterior- Anterior (PA) Chest, Lateral (LAT) Skull, PA Skull, AP Pelvis, Hand wrist, Anterior- Posterior (AP) Abdomen, Anterior – Posterior (AP) Forearm and Knee Joint (LAT) and Femur Joint are taken for our study. In all these cases were taken for those whose image quality is diagnostically acceptable. III. RESULTS AND DISCUSSION The results shown in this work allows us to identify the main exposure parameters in different radiological projections. Tube potential results are below 125 kVp. Increasing the kVp attracts more electrons from the filament, increasing the rate of x-ray production. The potential (kVp) at which the machine was operated-radiation output increases strongly with potential. The adjustment of the kilovolt value at the operating console also has a important effect on the dose if a high kilovolt setting is chosen; the radiation is ―Harder‖that is rich in energy and more able to pass through the body. Increasing the kVp resulted in radiation dosage to get to the other side of the patient and be recorded.
- 3. Analysis on X-Ray Parameters of Exposure by Measuring X-Ray Tube Voltage and Time of Exposure www.theijes.com The IJES Page 71 Radiograph projection Age kVp mA Exposure mGy mAs Chest PA Chest PA Chest PA Skull PA Pelvis Hand Abdomen Forearm AP Fermur Joint Knee Joint lateral 10 15 25 27 30 33 35 37 39 40 80.0 120.0 120.0 80.0 75.0 55.0 70.0 55.0 65.0 65.0 318 378 373 318 511 205 370 342 540 251 24 3 4 24 100 17 15 20 73 55 80800 5,900 8,500 80,800 288,900 11,700 27,300 28,456 122,900 80,400 7.77 1.12 1.51 7.77 50.94 3.40 5.65 5.12 18.17 13.81 PA- Posterior Anterior ;Lateral kVp-kilo voll peak-peak tube voltage;mA-tube current;mAs-milli Ampere Seconds;mGy-milligray Table 1 shows the Exposure parameters in 10 different Xray Examinations for different age groups(10-40) In Table 1, We have take 10 x -ray radiographic projections between the age groups of 10 – 40 and observed that there is a relative change in different amount of absorbed dose received by the subject studied, as the AEC is automatically controlled the system dose varies from subject to subject and we can see there is a change in the exposure time the amount of radiation energy varies in proportional, from our observations we inferred that the exposure time is directly proportionate to the amount of radiated energy. Radiograph Projection Age kVp mA Exposure Time(s) mGy mAs Chest PA Chest PA Chest PA Chest PA Skull Pelvis Hand Wrist Abdomen Forearm AP Knee Joint 37 40 40 45 40 40 45 50 50 50 68 70 120.0 120.0 120.0 120.0 80.0 75.0 50.0 80.0 80.0 55.0 65.0 120.0 368 200 372 366 320 668 562 372 322 644 251 370 5 3 5 3 27 26 74 25 20 18 71 5 12,000 6,600 8,400 6,600 74,800 10,230 34,236 32,500 37,356 35,675 121,700 8,700 1.98 1.17 1.60 1.17 8.55 32.90 2.10 13.92 14.96 20.14 17.91 1.67 kVp-kilo voll peak-peak tube voltage;mA-tube current;mAs-milli Ampere Seconds;mGy-milligray Table 2 shows the exposure parameters in 10 different Xray examinations for different age groups(40-70) In Table 2, We have worked out on different ages groups ranging from 40 – 70. Our observations shows that exposure times are drastically varied from one projection to the other projection that is evident in our tabulations. Exposure time is directly proportional to the amount of ionized radiation. Radiograph projection Age kVp mA Exposure time(s) mGy mAs Chest PA Chest PA Chest PA Chest PA Chest PA Chest PA Chest PA Chest PA Chest PA Chest PA Chest PA 50 51 52 53 54 55 56 57 58 59 60 120.0 120.0 120.0 120.0 120.0 120.0 120.0 120.0 120.0 120.0 120.0 371 372 374 371 373 374 369 368 369 368 372 3 3 5 5 4 7 8 7 8 7 2 6.000 0.772 9.300 10.200 7.000 61.800 71.100 60.300 73.500 64.300 0.578 1.019 1.24 1.81 1.93 1.32 2.53 2.91 2.47 2.99 2.68 0.89 Table 3 Shows the Exposure parameters for age groups from 50-60 on chest X ray Examinations
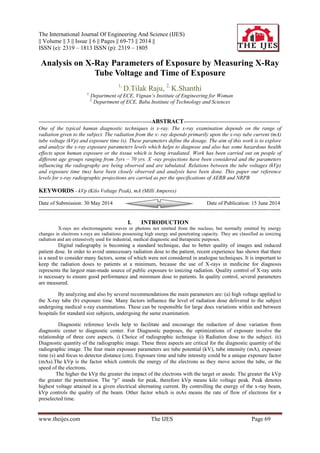
- 4. Analysis on X-Ray Parameters of Exposure by Measuring X-Ray Tube Voltage and Time of Exposure www.theijes.com The IJES Page 72 In Table 3, we have worked on subjects whose age group is in the range of 50 – 60 yrs, the whole x-ray radiographic projections was concentrated on the Posterior - Anterior type of projection, Chest PA X-ray chest PA view gives a good assessment of the cardiac size. It is taken with the film in front of the chest and the X-ray tube behind, from a distance of 180 cms. This view avoids magnification of the heart as the film is close to the anterior chest wall. For the first four observations we have observed that the amount of ionized radiated energy nearly doubles with the exposure time and from there on for the rest of the observations, the radiation energy nearly doubles up with an additional factor varying between 10 % – 20 %. Tube voltage has a great effect on the intensity of chest radiographs. Fig 1. Relation between Exposure Time (ms) and X-ray Projections Tube Voltage (kVp) Fig.1 is in with reference to Table 1 for Exposure Parameters in 10 different X-ray projections for age groups (10-40) Fig.2 is in with reference to Table 2 for Exposure Parameters in 10 different X-ray projections for age groups Fig.3 Relation between Exposure Time (ms) and X-ray Projections Tube Voltage (kVp) Figure 3. is in with reference to Table 3 for Exposure Parameters in 10 different X-ray projections for age groups (50-60)
- 5. Analysis on X-Ray Parameters of Exposure by Measuring X-Ray Tube Voltage and Time of Exposure www.theijes.com The IJES Page 73 IV. CONCLUSION The X ray parameter the kVp governs the penetration of the rays in the body, wholly depends on the kVp setting. This voltage peak setting controls the contrast of the radio graphic image. Optimum kVp resulted in consistent scattering of the beam resulting in sufficient output image. We inferred that there is adequate inverse proportionality between the kVp and mAs, as the kVp is increased the mAs is decreased irrespective of the age groups of different radiographic projections (air filled, fat, muscle& bone joints). Both parameters the kVp and mAs are drastically fluctuated irrespective of the subject’s age groups. From our findings and observations we have come to a conclusion that it is preferable to use high kVp and low mAs combinations, which we observed in table 3, in order to give a comparable radiographic image and with a subject dose being minimized. Our results conclude in choice of altering the kVp, which alters the mAs and there by the radiation dose to the subject on different radiographic projections. V. FUTURE WORK Radiation dose to the subject on different radiographic projections opens up to a new window to proceed further in testing the accuracy and tolerance of the x-ray tube which is being operated. REFERENCES [1]. Johnston, D. A. and Brennan, Effect of Tube Voltage on Image Quality Published online 10.1148/radiol.2352031730 Radiology 2005; 235:642–650. P. C. Reference dose levels for patients undergoing common diagnostic X-ray examinations in Irish hospitals. Br. J. Radiol. 73, 396–402 (2000). [2]. Chida, h. Saito, d. Ito, h. Shimura, m. Zuguchi & y. Takai, FFT Analysis of the X-ray Tube Voltage Waveforms of High- Frequency Generators for Radiographic Systems’. Department of Radiological Technology, Tohoku University School of Health Sciences, and Department of Radiology, Tohoku University School of Medicine, Aobaku, Sendai, Japan. [3]. Radiation Protection Dosimetry (2010), Vol. 141, No. 1, pp. 43–49 doi:10.1093/rpd/ncq138 Advance Access publication 20 April 2010. Relationship between radiographic techniques (Kilovolt and mill ampere-second). [4]. Institute of Physics and Engineering in Mecicine.Recommended standards for the routine performance testing of diagnostic X- ray imaging systems, IPEM report no. 77, York. 2000 [5]. National Council on Radiation Protection and Measurements. Structural shielding design and evaluation for megavoltage x- and gamma-ray radiotherapy facilities. Report No. 151. Bethesda, MD: NCRP; 2005 [6]. Journal of applied clinical medical physics, vol -11, Radiation sky shines from 6Mev medical accelerator. Michael S. Gossman, 1a Patton H. McGinley, 2 Mary B. Rising, 3 A. Jussi Pahikkala4 [7]. Launders JH, Cowen AR. A comparison of the threshold detail detectability of a screen-film combination and computed radiology under conditions relevant to high-kVp chest radiography. Phys Med Biol 1995; 40:1393–1398 [8]. International Commission on Radiological Protection. 1990 Recommendation of the International Commission on Radiological Protection—users’ edition. ICRP Publication 60. Oxford, England: Pergamon, 1992