
Recommended
Recommended
More Related Content
Similar to Describe what a type I and type II error would be for the followin.docx
Similar to Describe what a type I and type II error would be for the followin.docx (18)
More from theodorelove43763
More from theodorelove43763 (20)
Recently uploaded
Recently uploaded (20)
Describe what a type I and type II error would be for the followin.docx
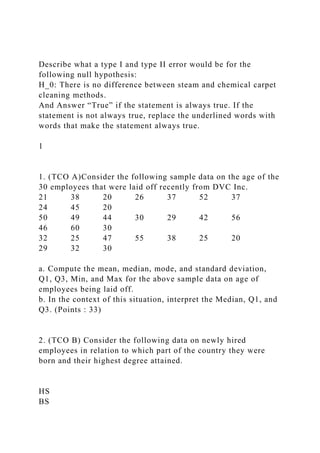
- 1. Describe what a type I and type II error would be for the following null hypothesis: H_0: There is no difference between steam and chemical carpet cleaning methods. And Answer “True” if the statement is always true. If the statement is not always true, replace the underlined words with words that make the statement always true. 1 1. (TCO A)Consider the following sample data on the age of the 30 employees that were laid off recently from DVC Inc. 21 38 20 26 37 52 37 24 45 20 50 49 44 30 29 42 56 46 60 30 32 25 47 55 38 25 20 29 32 30 a. Compute the mean, median, mode, and standard deviation, Q1, Q3, Min, and Max for the above sample data on age of employees being laid off. b. In the context of this situation, interpret the Median, Q1, and Q3. (Points : 33) 2. (TCO B) Consider the following data on newly hired employees in relation to which part of the country they were born and their highest degree attained. HS BS
- 2. MS PHD Total East 3 5 2 1 11 Midwest 7 9 2 0 18 South 5 8 6 2 21 West 1 7 8 6 22 Total 16 29 18 9 72 If you choose one person at random, then find the probability
- 3. that the person a. has a PHD. b. is from the East and has a BS as the highest degree attained. c. has only a HS degree, given that person is from the West. (Points : 18) 3. (TCO B) Squib claims that its new pain reliever is effective in giving relief for headaches within 10 minutes for 95% of users. A random sample of 25 patients is selected. Assuming Squibb is correct, then find the probability that a. exactly 23 patients obtain relief within 10 minutes. b. more than 23 patients obtain relief within 10 minutes. c. at most 22 patients obtain relief within 10 minutes. (Points : 18) 4. (TCO B) At a local supermarket the monthly customer expenditure follows a normal distribution with a mean of $495 and a standard deviation of $121. a. Find the probability that the monthly customer expenditure is less than $300 for a randomly selected customer. b. Find the probability that the monthly customer expenditure is between $300 and $600 for a randomly selected customer. c. The management of a supermarket wants to adopt a new promotional policy giving a free gift to every customer who spends more than a certain amount per month at this supermarket. Management plans to give free gifts to the top 8% of its customers (in terms of their expenditures). How much must a customer spend in a month to qualify for the free gift? (Points : 18) 5. (TCO C) A tool manufacturing company wants to estimate
- 4. the mean number of bolts produced per hour by a specific machine. A simple random sample of 9 hours of performance by this machine is selected and the number of bolts produced each hour is noted. This leads to the following results. Sample Size = 9 Sample Mean = 62.3 bolts/hr Sample Standard Deviation = 6.3 bolts/hr a. Compute the 90% confidence interval for the average number bolts produced per hour. b. Interpret this interval. c. How many hours of performance by this machine should be selected in order to be 90% confident of being within 1 bolt/hr of the population mean number of bolts per hour by this specific machine? (Points : 18) 6. (TCO C) A clock company is concerned about errors in assembly in their custom made clocks. A simple random sample of 120 clocks yields nine clocks with errors in assembly. a. Compute the 99% confidence interval for the proportion of clocks with errors in assembly. b. Interpret this confidence interval. c. How large a sample size will need to be selected if we wish to have a 99% confidence interval that is accurate to within 1.5%? (Points : 18) 7. (TCO D) An article in a trade journal reports that nationwide 28% of liquor purchases are made by women. If B & B Liquor’s proportion of sales to women is significantly different from the national norm, the owners are considering redesigning B & B’s advertising. A random sample of 100 customers is selected resulting in 24 women and 76 men. Does the sample data provide evidence to conclude that less than 28% of B&B’s Use the hypothesis
- 5. testing procedure outlined below. a. Formulate the null and alternative hypotheses. b. State the level of significance. c. Find the critical value (or values), and clearly show the rejection and non-rejection regions. d. Compute the test statistic. e. Decide whether you can reject Ho and accept Ha or not. f. Explain and interpret your conclusion in part e. What does this mean? g. Determine the observed p-value for the hypothesis test and interpret this value. What does this mean? less than 28% of B & B’s customers are women? (Points : 24) 8. (TCO D) Bill Smith is the Worthington Township manager. When citizens request a traffic light, the staff assesses the traffic flow at the requested intersection. Township policy requires the installation of a traffic light when an intersection averages more than 150 vehicles per hour. A random sample of 48 vehicle counts is done. The results are as follows: Sample Size = 48 Sample Mean = 158.3 vehicles/hr. Sample Standard Deviation = 27.6 vehicles/hr. Does the sample data provide evidence to conclude that the Use the hypothesis testing procedure outlined below. a. Formulate the null and alternative hypotheses. b. State the level of significance. c. Find the critical value (or values), and clearly show the rejection and nonrejection regions. d. Compute the test statistic. e. Decide whether you can reject Ho and accept Ha or not.
- 6. f. Explain and interpret your conclusion in part e. What does this mean? g. Find the observed p-value for the hypothesis test and interpret this value. What does this mean? the installation of the traffic light is warranted? (Points : 24) Question 1. 1. (TCO E) Management at New England Life wants to establish the relationship between the number of sales calls made each week (CALLS, X) and the number of sales made each week (SALES, Y). A random sample of 18 life insurance salespeople were surveyed yielding the data found below. CALLS SALES PREDICT 57 18 50 18 2 100 61 18 48 14 58 17 48 13 29
- 8. Correlations: CALLS, SALES Pearson correlation of CALLS and SALES = 0.956 P-Value = 0.000 Regression Analysis: SALES versus CALLS The regression equation is SALES = - 2.39 + 0.351 CALLS Predictor Coef SE Coef T P Constant -2.392 1.231 -1.94 0.070 CALLS 0.35063 0.02674 13.11 0.000 S = 1.50743 R-Sq = 91.5% R-Sq(adj) = 91.0% Analysis of Variance Source DF SS MS F P Regression 1 390.59 390.59 171.89 0.000 Residual Error 16 36.36 2.27 Total 17 426.94 Predicted Values for New Observations
- 9. New Obs Fit SE Fit 95% CI 95% PI 1 15.140 0.389 (14.315, 15.965) (11.839, 18.440) 2 32.672 1.538 (29.412, 35.932) (28.107, 37.237)XX XX denotes a point that is an extreme outlier in the predictors. Values of Predictors for New Observations New Obs CALLS 1 50 2 100 a. Analyze the above output to determine the regression equation. b. Find and interpret βˆ1in the context of this problem. c. Find and interpret the coefficient of determination (r- squared). d. Find and interpret coefficient of correlation. number of calls can be used to predict the sales? Test the utility of this model using a two-tailed test. Find the observed p-value and interpret. f. Find the 95% confidence interval for mean sales for all weeks having 50 calls. Interpret this interval. g. Find the 95% prediction interval for the sales for 1 week having 50 calls. Interpret this interval. h. What can we say about the sales when we had 100 calls in a week? (Points : 48) 4 Question 1. 1. (TCO E) Sam Smith, owner and general manager of Campus Stationery Store, is concerned about the sales behavior of a scanner at the store. He understands that there may be many factors, which may help explain sales, but he
- 10. believes that advertising and price are major determinants of sales. Sam collects the data given below with Y=SALES (# of sales), X1=ADS (# of ads), X2= PRICE ($) SALES ADS PRICE Predict ADS Predict PRICE 33 3 125 10 130 61 6 115 70 10 113 82 13 130 17 9 145 24 6
- 11. 140 40 5 120 48 5 116 56 7 110 72 11 108 Regression Analysis: SALES versus ADS, PRICE The regression equation is SALES = 157 + 4.33 ADS - 1.14 PRICE Predictor Coef SE Coef T P Constant 157.50 33.78 4.66 0.002 ADS 4.327 1.078 4.01 0.005 PRICE -1.1428 0.2677 -4.27 0.004 S = 10.1422 R-Sq = 82.9% R-Sq(adj) = 78.1%
- 12. Analysis of Variance Source DF SS MS F P Regression 2 3502.0 1751.0 17.02 0.002 Residual Error 7 720.1 102.9 Total 9 4222.1 Predicted Values for New Observations New Obs Fit SE Fit 95% CI 95% PI 1 52.20 4.67 (41.16, 63.25) (25.80, 78.61) Values of Predictors for New Observations New Obs ADS PRICE 1 10.0 130 Correlations: SALES, ADS, PRICE SALES ADS ADS 0.621 0.055 PRICE -0.661 0.008 0.037 0.982 Cell Contents: Pearson correlation P-Value a. Analyze the above output to determine the multiple regression equation. b. Find and interpret the multiple index of determination (R-
- 13. Sq). c. Perform the t-tests on βˆ1and on βˆ2(use two tailed test with d. Predict the number of sales given that there were 10 ads and the price was $130. Use both a point estimate and the appropriate interval estimate. (Points : 31)