SlideShare a Scribd company logo
1 of 204
Chapter
Climate Change 2014
Synthesis Report
Summary for Policymakers
2
SPM
Introduction
This Synthesis Report is based on the reports of the three
Working Groups of the Intergovernmental Panel on Climate
Change
(IPCC), including relevant Special Reports. It provides an
integrated view of climate change as the final part of the IPCC’s
Fifth Assessment Report (AR5).
This summary follows the structure of the longer report which
addresses the following topics: Observed changes and their
causes; Future climate change, risks and impacts; Future
pathways for adaptation, mitigation and sustainable
development;
Adaptation and mitigation.
In the Synthesis Report, the certainty in key assessment
findings is communicated as in the Working Group Reports and
Special Reports. It is based on the author teams’ evaluations of
underlying scientific understanding and is expressed as a
qualitative level of confidence (from very low to very high)
and, when possible, probabilistically with a quantified
likelihood
(from exceptionally unlikely to virtually certain)1. Where
appropriate, findings are also formulated as statements of fact
with-
out using uncertainty qualifiers.
This report includes information relevant to Article 2 of the
United Nations Framework Convention on Climate Change
(UNFCCC).
SPM 1. Observed Changes and their Causes
Human influence on the climate system is clear, and recent
anthropogenic emissions of green-
house gases are the highest in history. Recent climate changes
have had widespread impacts
on human and natural systems. {1}
SPM 1.1 Observed changes in the climate system
Warming of the climate system is unequivocal, and since the
1950s, many of the observed
changes are unprecedented over decades to millennia. The
atmosphere and ocean have
warmed, the amounts of snow and ice have diminished, and sea
level has risen. {1.1}
Each of the last three decades has been successively warmer at
the Earth’s surface than any preceding decade since 1850. The
period from 1983 to 2012 was likely the warmest 30-year period
of the last 1400 years in the Northern Hemisphere, where
such assessment is possible (medium confidence). The globally
averaged combined land and ocean surface temperature
data as calculated by a linear trend show a warming of 0.85
[0.65 to 1.06] °C 2 over the period 1880 to 2012, when multiple
independently produced datasets exist (Figure SPM.1a). {1.1.1,
Figure 1.1}
In addition to robust multi-decadal warming, the globally
averaged surface temperature exhibits substantial decadal and
interannual variability (Figure SPM.1a). Due to this natural
variability, trends based on short records are very sensitive to
the
beginning and end dates and do not in general reflect long-term
climate trends. As one example, the rate of warming over
1 Each finding is grounded in an evaluation of underlying
evidence and agreement. In many cases, a synthesis of evidence
and agreement supports an
assignment of confidence. The summary terms for evidence are:
limited, medium or robust. For agreement, they are low,
medium or high. A level of
confidence is expressed using five qualifiers: very low, low,
medium, high and very high, and typeset in italics, e.g., medium
confidence. The follow-
ing terms have been used to indicate the assessed likelihood of
an outcome or a result: virtually certain 99–100% probability,
very likely 90–100%,
likely 66–100%, about as likely as not 33–66%, unlikely 0–
33%, very unlikely 0–10%, exceptionally unlikely 0–1%.
Additional terms (extremely
likely 95–100%, more likely than not >50–100%, more unlikely
than likely 0–<50%, extremely unlikely 0–5%) may also be used
when appropriate.
Assessed likelihood is typeset in italics, e.g., very likely. See
for more details: Mastrandrea, M.D., C.B. Field, T.F. Stocker,
O. Edenhofer, K.L. Ebi, D.J. Frame,
H. Held, E. Kriegler, K.J. Mach, P.R. Matschoss, G.-K.
Plattner, G.W. Yohe and F.W. Zwiers, 2010: Guidance Note for
Lead Authors of the IPCC Fifth Assess-
ment Report on Consistent Treatment of Uncertainties,
Intergovernmental Panel on Climate Change (IPCC), Geneva,
Switzerland, 4 pp.
2 Ranges in square brackets or following ‘±’ are expected to
have a 90% likelihood of including the value that is being
estimated, unless otherwise
stated.
Summary for Policymakers
3
SPM
−1
−0.8
−0.6
−0.4
−0.2
0
0.2
0.4
(°
C
)
Globally averaged combined land and ocean surface temperature
anomaly
1850 1900 1950 2000
Year
−0.2
−0.15
−0.1
−0.05
0
0.05
0.1
(m
)
Globally averaged sea level change(b)
1850 1900 1950 2000
Year
(G
tC
O
2/
yr
)
0
5
10
15
20
25
30
35
40
Fossil fuels, cement and flaring
Forestry and other land use
1850 1900 1950 2000
Year
800
1000
1200
1400
1600
1800
C
H
4
(p
pb
)
270
280
290
300
310
320
330
N
2O
(p
pb
)
280
300
320
340
360
380
400
C
O
2
(p
pm
)
1850 1900 1950 2000
Year
0
500
1000
1500
2000
1750
–
1970
1750
–
2011
Cumulative CO2
emissions
(G
tC
O
2)
(a)
(c)
(d)
Globally averaged greenhouse gas concentrations
Global anthropogenic CO2 emissions
Quantitative information of CH4 and N2O emission time series
from 1850 to 1970 is limited
Figure SPM.1 | The complex relationship between the
observations (panels a, b, c, yellow background) and the
emissions (panel d,
light blue background) is addressed in Section 1.2 and Topic 1.
Observations and other indicators of a changing global climate
system. Observa-
tions: (a) Annually and globally averaged combined land and
ocean surface temperature anomalies relative to the average
over the period 1986 to 2005.
Colours indicate different data sets. (b) Annually and globally
averaged sea level change relative to the average over the
period 1986 to 2005 in the
longest-running dataset. Colours indicate different data sets. All
datasets are aligned to have the same value in 1993, the first
year of satellite altimetry
data (red). Where assessed, uncertainties are indicated by
coloured shading. (c) Atmospheric concentrations of the
greenhouse gases carbon dioxide
(CO2, green), methane (CH4, orange) and nitrous oxide (N2O,
red) determined from ice core data (dots) and from direct
atmospheric measurements (lines).
Indicators: (d) Global anthropogenic CO2 emissions from
forestry and other land use as well as from burning of fossil
fuel, cement production and flaring.
Cumulative emissions of CO2 from these sources and their
uncertainties are shown as bars and whiskers, respectively, on
the right hand side. The global
effects of the accumulation of CH4 and N2O emissions are
shown in panel c. Greenhouse gas emission data from 1970 to
2010 are shown in Figure SPM.2.
{Figures 1.1, 1.3, 1.5}
Summary for Policymakers
4
SPM
the past 15 years (1998–2012; 0.05 [–0.05 to 0.15] °C per
decade), which begins with a strong El Niño, is smaller than the
rate calculated since 1951 (1951–2012; 0.12 [0.08 to 0.14] °C
per decade). {1.1.1, Box 1.1}
Ocean warming dominates the increase in energy stored in the
climate system, accounting for more than 90% of the energy
accumulated between 1971 and 2010 (high confidence), with
only about 1% stored in the atmosphere. On a global scale,
the ocean warming is largest near the surface, and the upper 75
m warmed by 0.11 [0.09 to 0.13] °C per decade over the
period 1971 to 2010. It is virtually certain that the upper ocean
(0−700 m) warmed from 1971 to 2010, and it likely warmed
between the 1870s and 1971. {1.1.2, Figure 1.2}
Averaged over the mid-latitude land areas of the Northern
Hemisphere, precipitation has increased since 1901 (medium
confidence before and high confidence after 1951). For other
latitudes, area-averaged long-term positive or negative trends
have low confidence. Observations of changes in ocean surface
salinity also provide indirect evidence for changes in the
global water cycle over the ocean (medium confidence). It is
very likely that regions of high salinity, where evaporation
dom-
inates, have become more saline, while regions of low salinity,
where precipitation dominates, have become fresher since
the 1950s. {1.1.1, 1.1.2}
Since the beginning of the industrial era, oceanic uptake of CO2
has resulted in acidification of the ocean; the pH of ocean
surface water has decreased by 0.1 (high confidence),
corresponding to a 26% increase in acidity, measured as
hydrogen ion
concentration. {1.1.2}
Over the period 1992 to 2011, the Greenland and Antarctic ice
sheets have been losing mass (high confidence), likely at a
larger rate over 2002 to 2011. Glaciers have continued to shrink
almost worldwide (high confidence). Northern Hemisphere
spring snow cover has continued to decrease in extent (high
confidence). There is high confidence that permafrost tempera-
tures have increased in most regions since the early 1980s in
response to increased surface temperature and changing snow
cover. {1.1.3}
The annual mean Arctic sea-ice extent decreased over the period
1979 to 2012, with a rate that was very likely in the range
3.5 to 4.1% per decade. Arctic sea-ice extent has decreased in
every season and in every successive decade since 1979, with
the most rapid decrease in decadal mean extent in summer (high
confidence). It is very likely that the annual mean Antarctic
sea-ice extent increased in the range of 1.2 to 1.8% per decade
between 1979 and 2012. However, there is high confidence
that there are strong regional differences in Antarctica, with
extent increasing in some regions and decreasing in others.
{1.1.3, Figure 1.1}
Over the period 1901 to 2010, global mean sea level rose by
0.19 [0.17 to 0.21] m (Figure SPM.1b). The rate of sea level
rise
since the mid-19th century has been larger than the mean rate
during the previous two millennia (high confidence). {1.1.4,
Figure 1.1}
SPM 1.2 Causes of climate change
Anthropogenic greenhouse gas (GHG) emissions since the pre-
industrial era have driven large increases in the atmospheric
concentrations of carbon dioxide (CO2), methane (CH4) and
nitrous oxide (N2O) (Figure SPM.1c). Between 1750 and 2011,
cumulative anthropogenic CO2 emissions to the atmosphere
were 2040 ± 310 GtCO2. About 40% of these emissions have
remained in the atmosphere (880 ± 35 GtCO2); the rest was
removed from the atmosphere and stored on land (in plants and
soils) and in the ocean. The ocean has absorbed about 30% of
the emitted anthropogenic CO2, causing ocean acidification.
About half of the anthropogenic CO2 emissions between 1750
and 2011 have occurred in the last 40 years (high confidence)
(Figure SPM.1d). {1.2.1, 1.2.2}
Anthropogenic greenhouse gas emissions have increased since
the pre-industrial era, driven
largely by economic and population growth, and are now higher
than ever. This has led to atmo-
spheric concentrations of carbon dioxide, methane and nitrous
oxide that are unprecedented in
at least the last 800,000 years. Their effects, together with those
of other anthropogenic driv-
ers, have been detected throughout the climate system and are
extremely likely to have been
the dominant cause of the observed warming since the mid-20th
century. {1.2, 1.3.1}
Summary for Policymakers
5
SPM
Total anthropogenic GHG emissions have continued to increase
over 1970 to 2010 with larger absolute increases between
2000 and 2010, despite a growing number of climate change
mitigation policies. Anthropogenic GHG emissions in 2010 have
reached 49 ± 4.5 GtCO2-eq/yr 3. Emissions of CO2 from fossil
fuel combustion and industrial processes contributed about 78%
of the total GHG emissions increase from 1970 to 2010, with a
similar percentage contribution for the increase during the
period 2000 to 2010 (high confidence) (Figure SPM.2).
Globally, economic and population growth continued to be the
most
important drivers of increases in CO2 emissions from fossil fuel
combustion. The contribution of population growth between
2000 and 2010 remained roughly identical to the previous three
decades, while the contribution of economic growth has
risen sharply. Increased use of coal has reversed the long-
standing trend of gradual decarbonization (i.e., reducing the
carbon
intensity of energy) of the world’s energy supply (high
confidence). {1.2.2}
The evidence for human influence on the climate system has
grown since the IPCC Fourth Assessment Report (AR4). It is
extremely likely that more than half of the observed increase in
global average surface temperature from 1951 to 2010 was
caused by the anthropogenic increase in GHG concentrations
and other anthropogenic forcings together. The best estimate
of the human-induced contribution to warming is similar to the
observed warming over this period (Figure SPM.3). Anthro-
pogenic forcings have likely made a substantial contribution to
surface temperature increases since the mid-20th century
over every continental region except Antarctica4.
Anthropogenic influences have likely affected the global water
cycle since
1960 and contributed to the retreat of glaciers since the 1960s
and to the increased surface melting of the Greenland ice
sheet since 1993. Anthropogenic influences have very likely
contributed to Arctic sea-ice loss since 1979 and have very
likely
made a substantial contribution to increases in global upper
ocean heat content (0–700 m) and to global mean sea level rise
observed since the 1970s. {1.3, Figure 1.10}
3 Greenhouse gas emissions are quantified as CO2-equivalent
(GtCO2-eq) emissions using weightings based on the 100-year
Global Warming Potentials,
using IPCC Second Assessment Report values unless otherwise
stated. {Box 3.2}
4 For Antarctica, large observational uncertainties result in low
confidence that anthropogenic forcings have contributed to the
observed warming aver-
aged over available stations.
Gas
CO
2
Fossil fuel and
industrial processes
CO
2
FOLU
CH
4
N
2
O
F-Gases
2010 2010
(GWP
100
SAR)Year (GWP
100
AR5)
Total annual anthropogenic GHG emissions by gases 1970–2010
27 Gt
52 Gt
55%
17%
19%
7.9%
0.44%
5.0%
2.2%
38 Gt
59%
16%
18%
7.4%
0.81%
49 Gt
65%
11%
16%
6.2%
2.0%
G
H
G
e
m
is
si
on
s
(G
tC
O
2-
eq
/y
r)
0
10
20
30
40
50
201020052000199519901985198019751970
+2.2%/yr
2000–2010
+1.3%/yr
1970–2000
10%
20%
62%
Figure SPM.2 | Total annual anthropogenic greenhouse gas
(GHG) emissions (gigatonne of CO2-equivalent per year,
GtCO2-eq/yr) for the period 1970
to 2010 by gases: CO2 from fossil fuel combustion and
industrial processes; CO2 from Forestry and Other Land Use
(FOLU); methane (CH4); nitrous oxide
(N2O); fluorinated gases covered under the Kyoto Protocol (F-
gases). Right hand side shows 2010 emissions, using
alternatively CO2-equivalent emission
weightings based on IPCC Second Assessment Report (SAR)
and AR5 values. Unless otherwise stated, CO2-equivalent
emissions in this report include the
basket of Kyoto gases (CO2, CH4, N2O as well as F-gases)
calculated based on 100-year Global Warming Potential
(GWP100) values from the SAR (see Glos-
sary). Using the most recent GWP100 values from the AR5
(right-hand bars) would result in higher total annual GHG
emissions (52 GtCO2-eq/yr) from an
increased contribution of methane, but does not change the
long-term trend significantly. {Figure 1.6, Box 3.2}
Summary for Policymakers
6
SPM
SPM 1.3 Impacts of climate change
In recent decades, changes in climate have caused impacts on
natural and human systems on
all continents and across the oceans. Impacts are due to
observed climate change, irrespec-
tive of its cause, indicating the sensitivity of natural and human
systems to changing climate.
{1.3.2}
Evidence of observed climate change impacts is strongest and
most comprehensive for natural systems. In many regions,
changing precipitation or melting snow and ice are altering
hydrological systems, affecting water resources in terms of
quantity and quality (medium confidence). Many terrestrial,
freshwater and marine species have shifted their geographic
ranges, seasonal activities, migration patterns, abundances and
species interactions in response to ongoing climate change
(high confidence). Some impacts on human systems have also
been attributed to climate change, with a major or minor
contribution of climate change distinguishable from other
influences (Figure SPM.4). Assessment of many studies
covering
a wide range of regions and crops shows that negative impacts
of climate change on crop yields have been more common
than positive impacts (high confidence). Some impacts of ocean
acidification on marine organisms have been attributed to
human influence (medium confidence). {1.3.2}
Combined anthropogenic forcings
Other anthropogenic forcings
OBSERVED WARMING
Greenhouse gases
Contributions to observed surface temperature change over the
period 1951–2010
Natural forcings
Natural internal variability
–0.5 0.0 0.5 1.0
(°C)
Figure SPM.3 | Assessed likely ranges (whiskers) and their
mid-points (bars) for warming trends over the 1951–2010 period
from well-mixed greenhouse
gases, other anthropogenic forcings (including the cooling
effect of aerosols and the effect of land use change), combined
anthropogenic forcings, natural
forcings and natural internal climate variability (which is the
element of climate variability that arises spontaneously within
the climate system even in the
absence of forcings). The observed surface temperature change
is shown in black, with the 5 to 95% uncertainty range due to
observational uncertainty.
The attributed warming ranges (colours) are based on
observations combined with climate model simulations, in order
to estimate the contribution of an
individual external forcing to the observed warming. The
contribution from the combined anthropogenic forcings can be
estimated with less uncertainty
than the contributions from greenhouse gases and from other
anthropogenic forcings separately. This is because these two
contributions partially compen-
sate, resulting in a combined signal that is better constrained by
observations. {Figure 1.9}
Summary for Policymakers
7
SPM
SPM 1.4 Extreme events
Changes in many extreme weather and climate events have been
observed since about 1950.
Some of these changes have been linked to human influences,
including a decrease in cold tem-
perature extremes, an increase in warm temperature extremes,
an increase in extreme high sea
levels and an increase in the number of heavy precipitation
events in a number of regions. {1.4}
It is very likely that the number of cold days and nights has
decreased and the number of warm days and nights has
increased
on the global scale. It is likely that the frequency of heat waves
has increased in large parts of Europe, Asia and Australia. It is
Widespread impacts attributed to climate change based on the
available scientific literature since the AR4
medlow veryhigh
very
low high
Glaciers, snow, ice
and/or permafrost
indicates
confidence range
Rivers, lakes, floods
and/or drought
Terrestrial
ecosystems
Impacts identified
based on availability
of studies across
a region
Marine ecosystemsCoastal erosion
and/or sea level effects
Wildfire Livelihoods, health and/or economics
Food production
Physical systems Biological systems Human and managed
systems
Filled symbols = Major contribution of climate change
Outlined symbols = Minor contribution of climate change
Confidence in attribution
to climate change
Observed impacts attributed to climate change for
9329
10544
8101
325529821987
AUSTRALASIA
ASIANORTH AMERICA
CENTRAL AND SOUTH AMERICA
AFRICA
EUROPE
SMALL ISLANDS
POLAR REGIONS (Arctic and Antarctic)
Figure SPM.4 | Based on the available scientific literature since
the IPCC Fourth Assessment Report (AR4), there are
substantially more impacts in recent
decades now attributed to climate change. Attribution requires
defined scientific evidence on the role of climate change.
Absence from the map of addi-
tional impacts attributed to climate change does not imply that
such impacts have not occurred. The publications supporting
attributed impacts reflect a
growing knowledge base, but publications are still limited for
many regions, systems and processes, highlighting gaps in data
and studies. Symbols indicate
categories of attributed impacts, the relative contribution of
climate change (major or minor) to the observed impact and
confidence in attribution. Each
symbol refers to one or more entries in WGII Table SPM.A1,
grouping related regional-scale impacts. Numbers in ovals
indicate regional totals of climate
change publications from 2001 to 2010, based on the Scopus
bibliographic database for publications in English with
individual countries mentioned in title,
abstract or key words (as of July 2011). These numbers provide
an overall measure of the available scientific literature on
climate change across regions;
they do not indicate the number of publications supporting
attribution of climate change impacts in each region. Studies for
polar regions and small islands
are grouped with neighbouring continental regions. The
inclusion of publications for assessment of attribution followed
IPCC scientific evidence criteria
defined in WGII Chapter 18. Publications considered in the
attribution analyses come from a broader range of literature
assessed in the WGII AR5. See WGII
Table SPM.A1 for descriptions of the attributed impacts.
{Figure 1.11}
Summary for Policymakers
8
SPM
very likely that human influence has contributed to the observed
global scale changes in the frequency and intensity of
daily temperature extremes since the mid-20th century. It is
likely that human influence has more than doubled the prob-
ability of occurrence of heat waves in some locations. There is
medium confidence that the observed warming has increased
heat-related human mortality and decreased cold-related human
mortality in some regions. {1.4}
There are likely more land regions where the number of heavy
precipitation events has increased than where it has decreased.
Recent detection of increasing trends in extreme precipitation
and discharge in some catchments implies greater risks of
flooding at regional scale (medium confidence). It is likely that
extreme sea levels (for example, as experienced in storm
surges) have increased since 1970, being mainly a result of
rising mean sea level. {1.4}
Impacts from recent climate-related extremes, such as heat
waves, droughts, floods, cyclones and wildfires, reveal
significant
vulnerability and exposure of some ecosystems and many human
systems to current climate variability (very high confi-
dence). {1.4}
SPM 2. Future Climate Changes, Risks and Impacts
Continued emission of greenhouse gases will cause further
warming and long-lasting
changes in all components of the climate system, increasing the
likelihood of severe,
pervasive and irreversible impacts for people and ecosystems.
Limiting climate change would
require substantial and sustained reductions in greenhouse gas
emissions which, together
with adaptation, can limit climate change risks. {2}
SPM 2.1 Key drivers of future climate
Cumulative emissions of CO2 largely determine global mean
surface warming by the late
21st century and beyond. Projections of greenhouse gas
emissions vary over a wide range,
depending on both socio-economic development and climate
policy. {2.1}
Anthropogenic GHG emissions are mainly driven by population
size, economic activity, lifestyle, energy use, land use patterns,
technology and climate policy. The Representative
Concentration Pathways (RCPs), which are used for making
projections
based on these factors, describe four different 21st century
pathways of GHG emissions and atmospheric concentrations,
air pollutant emissions and land use. The RCPs include a
stringent mitigation scenario (RCP2.6), two intermediate
scenarios
(RCP4.5 and RCP6.0) and one scenario with very high GHG
emissions (RCP8.5). Scenarios without additional efforts to
constrain emissions (’baseline scenarios’) lead to pathways
ranging between RCP6.0 and RCP8.5 (Figure SPM.5a). RCP2.6
is
representative of a scenario that aims to keep global warming
likely below 2°C above pre-industrial temperatures. The RCPs
are consistent with the wide range of scenarios in the literature
as assessed by WGIII5. {2.1, Box 2.2, 4.3}
Multiple lines of evidence indicate a strong, consistent, almost
linear relationship between cumulative CO2 emissions and
projected global temperature change to the year 2100 in both
the RCPs and the wider set of mitigation scenarios analysed
in WGIII (Figure SPM.5b). Any given level of warming is
associated with a range of cumulative CO2 emissions6, and
therefore,
e.g., higher emissions in earlier decades imply lower emissions
later. {2.2.5, Table 2.2}
5 Roughly 300 baseline scenarios and 900 mitigation scenarios
are categorized by CO2-equivalent concentration (CO2-eq) by
2100. The CO2-eq includes
the forcing due to all GHGs (including halogenated gases and
tropospheric ozone), aerosols and albedo change.
6 Quantification of this range of CO2 emissions requires taking
into account non-CO2 drivers.
Summary for Policymakers
9
SPM
Year
A
nn
ua
l e
m
is
si
on
s
(G
tC
O
2/
yr
)
1950 2000 2050 2100
−100
0
100
200
Historical
emissions
RCP2.6
RCP4.5
RCP6.0
RCP8.5
Fu
ll
ra
ng
e
of
t
he
W
G
III
A
R5
sc
en
ar
io
d
at
ab
as
e
in
2
10
0
Annual anthropogenic CO2 emissions
>1000
720−1000
580−720
530−580
480−530
430−480
(a)
(b)
WGIII scenario categories:
RCP scenarios:
1
2
3
4
5
Te
m
pe
ra
tu
re
c
ha
ng
e
re
la
tiv
e
to
1
86
1–
18
80
(°
C
)
Warming versus cumulative CO2 emissions
Total human-induced warming
1000 2000 3000 4000 5000 6000 7000 8000 90000
1000 GtC 2000 GtC
Cumulative anthropogenic CO2 emissions from 1870 (GtCO2)
0
430–480
480–530
530–580
580–720
720–1000
baselines
observed 2000s
Figure SPM.5 | (a) Emissions of carbon dioxide (CO2) alone in
the Representative Concentration Pathways (RCPs) (lines) and
the associated scenario
categories used in WGIII (coloured areas show 5 to 95% range).
The WGIII scenario categories summarize the wide range of
emission scenarios published
in the scientific literature and are defined on the basis of CO2-
eq concentration levels (in ppm) in 2100. The time series of
other greenhouse gas emissions
are shown in Box 2.2, Figure 1. (b) Global mean surface
temperature increase at the time global CO2 emissions reach a
given net cumulative total, plotted
as a function of that total, from various lines of evidence.
Coloured plume shows the spread of past and future projections
from a hierarchy of climate-
carbon cycle models driven by historical emissions and the four
RCPs over all times out to 2100, and fades with the decreasing
number of available models.
Ellipses show total anthropogenic warming in 2100 versus
cumulative CO2 emissions from 1870 to 2100 from a simple
climate model (median climate
response) under the scenario categories used in WGIII. The
width of the ellipses in terms of temperature is caused by the
impact of different scenarios for
non-CO2 climate drivers. The filled black ellipse shows
observed emissions to 2005 and observed temperatures in the
decade 2000–2009 with associated
uncertainties. {Box 2.2, Figure 1; Figure 2.3}
Summary for Policymakers
10
SPM
Multi-model results show that limiting total human-induced
warming to less than 2°C relative to the period 1861–1880 with
a probability of >66%7 would require cumulative CO2
emissions from all anthropogenic sources since 1870 to remain
below
about 2900 GtCO2 (with a range of 2550 to 3150 GtCO2
depending on non-CO2 drivers). About 1900 GtCO28 had
already been
emitted by 2011. For additional context see Table 2.2. {2.2.5}
SPM 2.2 Projected changes in the climate system
Surface temperature is projected to rise over the 21st century
under all assessed emission
scenarios. It is very likely that heat waves will occur more often
and last longer, and that
extreme precipitation events will become more intense and
frequent in many regions. The
ocean will continue to warm and acidify, and global mean sea
level to rise. {2.2}
The projected changes in Section SPM 2.2 are for 2081–2100
relative to 1986–2005, unless otherwise indicated.
Future climate will depend on committed warming caused by
past anthropogenic emissions, as well as future anthropogenic
emissions and natural climate variability. The global mean
surface temperature change for the period 2016–2035 relative to
1986–2005 is similar for the four RCPs and will likely be in the
range 0.3°C to 0.7°C (medium confidence). This assumes that
there will be no major volcanic eruptions or changes in some
natural sources (e.g., CH4 and N2O), or unexpected changes in
total solar irradiance. By mid-21st century, the magnitude of the
projected climate change is substantially affected by the
choice of emissions scenario. {2.2.1, Table 2.1}
Relative to 1850–1900, global surface temperature change for
the end of the 21st century (2081–2100) is projected to likely
exceed 1.5°C for RCP4.5, RCP6.0 and RCP8.5 (high
confidence). Warming is likely to exceed 2°C for RCP6.0 and
RCP8.5
(high confidence), more likely than not to exceed 2°C for
RCP4.5 (medium confidence), but unlikely to exceed 2°C for
RCP2.6
(medium confidence). {2.2.1}
The increase of global mean surface temperature by the end of
the 21st century (2081–2100) relative to 1986–2005 is likely
to be 0.3°C to 1.7°C under RCP2.6, 1.1°C to 2.6°C under
RCP4.5, 1.4°C to 3.1°C under RCP6.0 and 2.6°C to 4.8°C under
RCP8.59. The Arctic region will continue to warm more rapidly
than the global mean (Figure SPM.6a, Figure SPM.7a). {2.2.1,
Figure 2.1, Figure 2.2, Table 2.1}
It is virtually certain that there will be more frequent hot and
fewer cold temperature extremes over most land areas on daily
and seasonal timescales, as global mean surface temperature
increases. It is very likely that heat waves will occur with a
higher frequency and longer duration. Occasional cold winter
extremes will continue to occur. {2.2.1}
7 Corresponding figures for limiting warming to 2°C with a
probability of >50% and >33% are 3000 GtCO2 (range of 2900
to 3200 GtCO2) and 3300 GtCO2
(range of 2950 to 3800 GtCO2) respectively. Higher or lower
temperature limits would imply larger or lower cumulative
emissions respectively.
8 This corresponds to about two thirds of the 2900 GtCO2 that
would limit warming to less than 2°C with a probability of
>66%; to about 63% of the total
amount of 3000 GtCO2 that would limit warming to less than
2°C with a probability of >50%; and to about 58% of the total
amount of 3300 GtCO2
that would limit warming to less than 2°C with a probability of
>33%.
9 The period 1986–2005 is approximately 0.61 [0.55 to 0.67] °C
warmer than 1850–1900. {2.2.1}
Summary for Policymakers
11
SPM
Figure SPM.6 | Global average surface temperature change (a)
and global mean sea level rise10 (b) from 2006 to 2100 as
determined by multi-model
simulations. All changes are relative to 1986–2005. Time series
of projections and a measure of uncertainty (shading) are shown
for scenarios RCP2.6
(blue) and RCP8.5 (red). The mean and associated uncertainties
averaged over 2081–2100 are given for all RCP scenarios as
coloured vertical bars at the
right hand side of each panel. The number of Coupled Model
Intercomparison Project Phase 5 (CMIP5) models used to
calculate the multi-model mean is
indicated. {2.2, Figure 2.1}
Changes in precipitation will not be uniform. The high latitudes
and the equatorial Pacific are likely to experience an increase
in annual mean precipitation under the RCP8.5 scenario. In
many mid-latitude and subtropical dry regions, mean precipi-
tation will likely decrease, while in many mid-latitude wet
regions, mean precipitation will likely increase under the
RCP8.5
scenario (Figure SPM.7b). Extreme precipitation events over
most of the mid-latitude land masses and over wet tropical
regions will very likely become more intense and more frequent.
{2.2.2, Figure 2.2}
The global ocean will continue to warm during the 21st century,
with the strongest warming projected for the surface in
tropical and Northern Hemisphere subtropical regions (Figure
SPM.7a). {2.2.3, Figure 2.2}
10 Based on current understanding (from observations, physical
understanding and modelling), only the collapse of marine-
based sectors of the Antarctic
ice sheet, if initiated, could cause global mean sea level to rise
substantially above the likely range during the 21st century.
There is medium confidence
that this additional contribution would not exceed several tenths
of a meter of sea level rise during the 21st century.
Global mean sea level rise
(relative to 1986–2005)
RC
P2
.6
RC
P4
.5
RC
P6
.0
RC
P8
.5
Mean over
2081–2100
21
21
(b)
2000 21002050
Year
1
0.8
0.6
0.4
0.2
0
(m
)
RC
P2
.6
RC
P4
.5
RC
P6
.0
RC
P8
.5
32
39
Global average surface temperature change
(relative to 1986–2005) Mean over
2081–2100
(a)
2000 21002050
Year
6
4
2
0
–2
(°
C
)
Summary for Policymakers
12
SPM
Earth System Models project a global increase in ocean
acidification for all RCP scenarios by the end of the 21st
century, with
a slow recovery after mid-century under RCP2.6. The decrease
in surface ocean pH is in the range of 0.06 to 0.07 (15 to 17%
increase in acidity) for RCP2.6, 0.14 to 0.15 (38 to 41%) for
RCP4.5, 0.20 to 0.21 (58 to 62%) for RCP6.0 and 0.30 to 0.32
(100 to 109%) for RCP8.5. {2.2.4, Figure 2.1}
Year-round reductions in Arctic sea ice are projected for all
RCP scenarios. A nearly ice-free11 Arctic Ocean in the summer
sea-
ice minimum in September before mid-century is likely for
RCP8.512 (medium confidence). {2.2.3, Figure 2.1}
It is virtually certain that near-surface permafrost extent at high
northern latitudes will be reduced as global mean surface
temperature increases, with the area of permafrost near the
surface (upper 3.5 m) projected to decrease by 37% (RCP2.6) to
81% (RCP8.5) for the multi-model average (medium
confidence). {2.2.3}
The global glacier volume, excluding glaciers on the periphery
of Antarctica (and excluding the Greenland and Antarctic ice
sheets), is projected to decrease by 15 to 55% for RCP2.6 and
by 35 to 85% for RCP8.5 (medium confidence). {2.2.3}
11 When sea-ice extent is less than one million km2 for at least
five consecutive years.
12 Based on an assessment of the subset of models that most
closely reproduce the climatological mean state and 1979–2012
trend of the Arctic sea-ice
extent.
RCP2.6 RCP8.5
−20 −10−30−50 −40 0 10 20 30 40 50
(b) Change in average precipitation (1986−2005 to 2081−2100)
3932
(%)
(a) Change in average surface temperature (1986−2005 to
2081−2100)
3932
(°C)
−0.5−1−2 −1.5 0 1 1.5 2 3 4 5 7 9 110.5
Figure SPM.7 | Change in average surface temperature (a) and
change in average precipitation (b) based on multi-model mean
projections for
2081–2100 relative to 1986–2005 under the RCP2.6 (left) and
RCP8.5 (right) scenarios. The number of models used to
calculate the multi-model mean
is indicated in the upper right corner of each panel. Stippling
(i.e., dots) shows regions where the projected change is large
compared to natural internal
variability and where at least 90% of models agree on the sign
of change. Hatching (i.e., diagonal lines) shows regions where
the projected change is less
than one standard deviation of the natural internal variability.
{2.2, Figure 2.2}
Summary for Policymakers
13
SPM
There has been significant improvement in understanding and
projection of sea level change since the AR4. Global mean sea
level rise will continue during the 21st century, very likely at a
faster rate than observed from 1971 to 2010. For the period
2081–2100 relative to 1986–2005, the rise will likely be in the
ranges of 0.26 to 0.55 m for RCP2.6, and of 0.45 to 0.82 m
for RCP8.5 (medium confidence)10 (Figure SPM.6b). Sea level
rise will not be uniform across regions. By the end of the
21st century, it is very likely that sea level will rise in more
than about 95% of the ocean area. About 70% of the coastlines
worldwide are projected to experience a sea level change within
±20% of the global mean. {2.2.3}
SPM 2.3 Future risks and impacts caused by a changing climate
Climate change will amplify existing risks and create new risks
for natural and human sys-
tems. Risks are unevenly distributed and are generally greater
for disadvantaged people and
communities in countries at all levels of development. {2.3}
Risk of climate-related impacts results from the interaction of
climate-related hazards (including hazardous events and
trends) with the vulnerability and exposure of human and
natural systems, including their ability to adapt. Rising rates
and
magnitudes of warming and other changes in the climate system,
accompanied by ocean acidification, increase the risk
of severe, pervasive and in some cases irreversible detrimental
impacts. Some risks are particularly relevant for individual
regions (Figure SPM.8), while others are global. The overall
risks of future climate change impacts can be reduced by
limiting
the rate and magnitude of climate change, including ocean
acidification. The precise levels of climate change sufficient to
trigger abrupt and irreversible change remain uncertain, but the
risk associated with crossing such thresholds increases with
rising temperature (medium confidence). For risk assessment, it
is important to evaluate the widest possible range of impacts,
including low-probability outcomes with large consequences.
{1.5, 2.3, 2.4, 3.3, Box Introduction.1, Box 2.3, Box 2.4}
A large fraction of species faces increased extinction risk due to
climate change during and beyond the 21st century, espe-
cially as climate change interacts with other stressors (high
confidence). Most plant species cannot naturally shift their
geographical ranges sufficiently fast to keep up with current and
high projected rates of climate change in most landscapes;
most small mammals and freshwater molluscs will not be able to
keep up at the rates projected under RCP4.5 and above
in flat landscapes in this century (high confidence). Future risk
is indicated to be high by the observation that natural global
climate change at rates lower than current anthropogenic
climate change caused significant ecosystem shifts and species
extinctions during the past millions of years. Marine organisms
will face progressively lower oxygen levels and high rates and
magnitudes of ocean acidification (high confidence), with
associated risks exacerbated by rising ocean temperature
extremes
(medium confidence). Coral reefs and polar ecosystems are
highly vulnerable. Coastal systems and low-lying areas are at
risk from sea level rise, which will continue for centuries even
if the global mean temperature is stabilized (high confidence).
{2.3, 2.4, Figure 2.5}
Climate change is projected to undermine food security (Figure
SPM.9). Due to projected climate change by the mid-21st
century
and beyond, global marine species redistribution and marine
biodiversity reduction in sensitive regions will challenge the
sustained
provision of fisheries productivity and other ecosystem services
(high confidence). For wheat, rice and maize in tropical and
temper-
ate regions, climate change without adaptation is projected to
negatively impact production for local temperature increases
of 2°C or more above late 20th century levels, although
individual locations may benefit (medium confidence). Global
tem-
perature increases of ~4°C or more13 above late 20th century
levels, combined with increasing food demand, would pose
large risks to food security globally (high confidence). Climate
change is projected to reduce renewable surface water and
groundwater resources in most dry subtropical regions (robust
evidence, high agreement), intensifying competition for water
among sectors (limited evidence, medium agreement). {2.3.1,
2.3.2}
13 Projected warming averaged over land is larger than global
average warming for all RCP scenarios for the period 2081–
2100 relative to 1986–2005.
For regional projections, see Figure SPM.7. {2.2}
Summary for Policymakers
14
SPM
R
eg
io
na
l k
ey
r
is
ks
a
nd
po
te
nt
ia
l f
or
r
is
k
re
du
ct
io
n
G
la
ci
er
s,
sn
ow
, i
ce
an
d/
or
pe
rm
af
ro
st
Ri
ve
rs
, l
ak
es
,
flo
od
s
an
d/
or
dr
ou
gh
t
Te
rr
es
tr
ia
l
ec
os
ys
te
m
s
M
ar
in
e
ec
os
ys
te
m
s
C
oa
st
al
e
ro
si
on
an
d/
or
s
ea
le
ve
l
ef
fe
ct
s
W
ild
fir
e
Li
ve
lih
oo
ds
, h
ea
lth
an
d/
or
e
co
no
m
ic
s
Fo
od
pr
od
uc
tio
n
Ph
ys
ic
al
s
ys
te
m
s
B
io
lo
g
ic
al
s
ys
te
m
s
H
um
an
a
nd
m
an
ag
ed
s
ys
te
m
s
A
us
tr
al
as
ia
A
si
a
In
cr
ea
se
d
ris
ks
t
o
co
as
ta
l i
nf
ra
st
ru
ct
ur
e
an
d
lo
w
-ly
in
g
ec
os
ys
te
m
s
In
cr
ea
se
d
flo
od
d
am
ag
e
to
in
fr
as
tr
uc
tu
re
a
nd
se
tt
le
m
en
ts
Si
gn
ifi
ca
nt
c
ha
ng
e
in
c
om
po
si
tio
n
an
d
st
ru
ct
ur
e
of
c
or
al
r
ee
f s
ys
te
m
s
In
cr
ea
se
d
m
as
s
co
ra
l
bl
ea
ch
in
g
an
d
m
or
ta
lit
y
In
cr
ea
se
d
da
m
ag
es
fr
om
r
iv
er
a
nd
c
oa
st
al
ur
ba
n
flo
od
s
H
ea
t-
re
la
te
d
hu
m
an
m
or
ta
lit
y
In
cr
ea
se
d
da
m
ag
es
fr
om
w
ild
fir
es
Ri
sk
s
fo
r
lo
w
-ly
in
g
co
as
ta
l a
re
as
Lo
ss
o
f l
iv
el
ih
oo
ds
,
se
tt
le
m
en
ts
, i
nf
ra
st
ru
ct
ur
e,
ec
os
ys
te
m
s
er
vi
ce
s
an
d
ec
on
om
ic
s
ta
bi
lit
y
H
ea
t-
re
la
te
d
hu
m
an
m
or
ta
lit
y
In
cr
ea
se
d
dr
ou
gh
t-
re
la
te
d
w
at
er
a
nd
fo
od
s
ho
rt
ag
e
Re
du
ce
d
fo
od
p
ro
du
ct
io
n
an
d
qu
al
ity
In
cr
ea
se
d
w
at
er
r
es
tr
ic
tio
ns
In
cr
ea
se
d
da
m
ag
es
fr
om
riv
er
a
nd
c
oa
st
al
fl
oo
ds
Ve
ct
or
-
an
d
w
at
er
-
bo
rn
e
di
se
as
es
Re
du
ce
d
cr
op
p
ro
du
ct
iv
ity
a
nd
liv
el
ih
oo
d
an
d
fo
od
s
ec
ur
ity
C
om
po
un
de
d
st
re
ss
on
w
at
er
r
es
ou
rc
es
In
cr
ea
se
d
flo
od
d
am
ag
e
to
in
fr
as
tr
uc
tu
re
, l
iv
el
ih
oo
ds
an
d
se
tt
le
m
en
ts
In
cr
ea
se
d
da
m
ag
es
fr
om
e
xt
re
m
e
he
at
ev
en
ts
a
nd
w
ild
fir
es
Re
du
ce
d
w
at
er
a
va
ila
bi
lit
y
an
d
in
cr
ea
se
d
flo
od
in
g
an
d
la
nd
sl
id
es
N
or
th
A
m
er
ic
a
C
en
tr
al
a
nd
S
ou
th
A
m
er
ic
a
A
fr
ic
a
Eu
ro
pe
Th
e
O
ce
an
Sm
al
l i
sl
an
ds
C
oa
st
al
in
un
da
tio
n
an
d
ha
bi
ta
t
lo
ss
Ri
sk
s
fo
r
ec
os
ys
te
m
s
Ri
sk
s
fo
r
he
al
th
an
d
w
el
l-b
ei
ng
U
np
re
ce
de
nt
ed
c
ha
lle
ng
es
,
es
pe
ci
al
ly
fr
om
r
at
e
of
c
ha
ng
e
Po
la
r R
eg
io
ns
(A
rc
tic
a
nd
A
nt
ar
ct
ic
)
Sp
re
ad
o
f v
ec
to
r-b
or
ne
d
ise
as
es
D
is
tr
ib
ut
io
na
l
sh
ift
a
nd
re
du
ce
d
fis
he
rie
s
ca
tc
h
po
te
nt
ia
l a
t l
ow
la
tit
ud
es
Ri
sk
le
ve
l w
ith
cu
rr
en
t a
da
pt
at
io
n
Ri
sk
le
ve
l w
ith
hi
gh
a
da
pt
at
io
n
V
e
ry
lo
w
N
ea
r t
er
m
(2
03
0–
20
40
)
Pr
es
en
t
Lo
ng
te
rm
(2
08
0–
21
00
)
2°
C
4°
C
V
e
ry
h
ig
h
R
is
k
l
e
v
e
l
M
ed
iu
m
Po
te
nt
ia
l f
or
ad
di
tio
na
l
ad
ap
ta
tio
n
to
re
du
ce
ri
sk
no
t a
ss
es
se
d
no
t a
ss
es
se
d
R
ep
re
se
n
ta
ti
ve
k
ey
r
is
ks
f
o
r
ea
ch
r
eg
io
n
f
o
r
Fi
g
ur
e
SP
M
.8
|
R
ep
re
se
nt
at
iv
e
ke
y
ris
ks
14
fo
r e
ac
h
re
gi
on
, i
nc
lu
di
ng
th
e
po
te
nt
ia
l f
or
ri
sk
re
du
ct
io
n
th
ro
ug
h
ad
ap
ta
tio
n
an
d
m
iti
ga
tio
n,
a
s
w
el
l a
s
lim
its
to
a
da
pt
at
io
n.
E
ac
h
ke
y
ris
k
is
a
ss
es
se
d
as
ve
ry
lo
w
, l
ow
, m
ed
iu
m
, h
ig
h
or
v
er
y
hi
gh
. R
is
k
le
ve
ls
a
re
p
re
se
nt
ed
fo
r t
hr
ee
ti
m
e
fra
m
es
: p
re
se
nt
, n
ea
r t
er
m
(h
er
e,
fo
r 2
03
0–
20
40
) a
nd
lo
ng
te
rm
(h
er
e,
fo
r 2
08
0–
21
00
).
In
th
e
ne
ar
te
rm
, p
ro
je
ct
ed
le
ve
ls
o
f g
lo
ba
l m
ea
n
te
m
pe
ra
tu
re
in
cr
ea
se
d
o
no
t d
iv
er
ge
s
ub
st
an
tia
lly
a
cr
os
s
di
ffe
re
nt
e
m
is
si
on
s
ce
na
rio
s.
Fo
r t
he
lo
ng
te
rm
, r
is
k
le
ve
ls
a
re
p
re
se
nt
ed
fo
r t
w
o
po
ss
ib
le
fu
tu
re
s
(2
°C
a
nd
4
°C
g
lo
ba
l
m
ea
n
te
m
pe
ra
tu
re
in
cr
ea
se
a
bo
ve
p
re
-in
du
st
ria
l l
ev
el
s)
. F
or
e
ac
h
tim
ef
ra
m
e,
ri
sk
le
ve
ls
a
re
in
di
ca
te
d
fo
r a
c
on
tin
ua
tio
n
of
c
ur
re
nt
a
da
pt
at
io
n
an
d
as
su
m
in
g
hi
gh
le
ve
ls
o
f c
ur
re
nt
o
r f
ut
ur
e
ad
ap
ta
tio
n.
Ri
sk
le
ve
ls
a
re
n
ot
n
ec
es
sa
ril
y
co
m
pa
ra
bl
e,
e
sp
ec
ia
lly
a
cr
os
s
re
gi
on
s.
{F
ig
ur
e
2.
4}
14
Id
en
tifi
ca
tio
n
of
k
ey
ri
sk
s
w
as
b
as
ed
o
n
ex
pe
rt
ju
dg
m
en
t u
si
ng
th
e
fo
llo
w
in
g
sp
ec
ifi
c
cr
ite
ria
: l
ar
ge
m
ag
ni
tu
de
, h
ig
h
pr
ob
ab
ili
ty
o
r i
rr
ev
er
si
bi
lit
y
of
im
pa
ct
s;
ti
m
in
g
of
im
pa
ct
s;
p
er
si
st
en
t v
ul
ne
ra
bi
lit
y
or
e
xp
os
ur
e
co
nt
rib
ut
in
g
to
ri
sk
s;
o
r l
im
ite
d
po
te
nt
ia
l t
o
re
du
ce
ri
sk
s
th
ro
ug
h
ad
ap
ta
tio
n
or
m
iti
ga
tio
n.
Summary for Policymakers
15
SPM
Until mid-century, projected climate change will impact human
health mainly by exacerbating health problems that already
exist (very high confidence). Throughout the 21st century,
climate change is expected to lead to increases in ill-health in
many
regions and especially in developing countries with low income,
as compared to a baseline without climate change (high
confidence). By 2100 for RCP8.5, the combination of high
temperature and humidity in some areas for parts of the year is
expected to compromise common human activities, including
growing food and working outdoors (high confidence). {2.3.2}
In urban areas climate change is projected to increase risks for
people, assets, economies and ecosystems, including risks
from heat stress, storms and extreme precipitation, inland and
coastal flooding, landslides, air pollution, drought, water scar-
city, sea level rise and storm surges (very high confidence).
These risks are amplified for those lacking essential
infrastructure
and services or living in exposed areas. {2.3.2}
Climate change poses risks for food production
Change in maximum catch potential (2051–2060 compared to
2001–2010, SRES A1B)
Pe
rc
en
ta
ge
o
f y
ie
ld
p
ro
je
ct
io
ns
–21 to –50%<–50% –6 to –20% –1 to –5% no data 0 to 4% 5 to
19% 20 to 49% 50 to 100% >100 %
(a)
(b)
0 to –5%
–5 to –10%
–10 to –25%
–25 to –50%
–50 to –100%
0 to 5%
5 to 10%
10 to 25%
25 to 50%
50 to 100%
Range of yield change
0
20
40
60
80
100
increase
in yield
decrease
in yield
2010–2029 2030–2049 2050–2069 2070–2089 2090–2109
Figure SPM.9 | (a) Projected global redistribution of maximum
catch potential of ~1000 exploited marine fish and invertebrate
species. Projections
compare the 10-year averages 2001–2010 and 2051–2060 using
ocean conditions based on a single climate model under a
moderate to high warming
scenario, without analysis of potential impacts of overfishing or
ocean acidification. (b) Summary of projected changes in crop
yields (mostly wheat, maize,
rice and soy), due to climate change over the 21st century. Data
for each timeframe sum to 100%, indicating the percentage of
projections showing yield
increases versus decreases. The figure includes projections
(based on 1090 data points) for different emission scenarios, for
tropical and temperate regions
and for adaptation and no-adaptation cases combined. Changes
in crop yields are relative to late 20th century levels. {Figure
2.6a, Figure 2.7}
Summary for Policymakers
16
SPM
Rural areas are expected to experience major impacts on water
availability and supply, food security, infrastructure and
agricultural incomes, including shifts in the production areas of
food and non-food crops around the world (high confidence).
{2.3.2}
Aggregate economic losses accelerate with increasing
temperature (limited evidence, high agreement), but global
economic
impacts from climate change are currently difficult to estimate.
From a poverty perspective, climate change impacts are
projected to slow down economic growth, make poverty
reduction more difficult, further erode food security and
prolong
existing and create new poverty traps, the latter particularly in
urban areas and emerging hotspots of hunger (medium confi-
dence). International dimensions such as trade and relations
among states are also important for understanding the risks of
climate change at regional scales. {2.3.2}
Climate change is projected to increase displacement of people
(medium evidence, high agreement). Populations that lack
the resources for planned migration experience higher exposure
to extreme weather events, particularly in developing coun-
tries with low income. Climate change can indirectly increase
risks of violent conflicts by amplifying well-documented drivers
of these conflicts such as poverty and economic shocks
(medium confidence). {2.3.2}
SPM 2.4 Climate change beyond 2100, irreversibility and
abrupt changes
Many aspects of climate change and associated impacts will
continue for centuries, even if
anthropogenic emissions of greenhouse gases are stopped. The
risks of abrupt or irreversible
changes increase as the magnitude of the warming increases.
{2.4}
Warming will continue beyond 2100 under all RCP scenarios
except RCP2.6. Surface temperatures will remain approximately
constant at elevated levels for many centuries after a complete
cessation of net anthropogenic CO2 emissions. A large frac-
tion of anthropogenic climate change resulting from CO2
emissions is irreversible on a multi-century to millennial
timescale,
except in the case of a large net removal of CO2 from the
atmosphere over a sustained period. {2.4, Figure 2.8}
Stabilization of global average surface temperature does not
imply stabilization for all aspects of the climate system.
Shifting
biomes, soil carbon, ice sheets, ocean temperatures and
associated sea level rise all have their own intrinsic long
timescales
which will result in changes lasting hundreds to thousands of
years after global surface temperature is stabilized. {2.1, 2.4}
There is high confidence that ocean acidification will increase
for centuries if CO2 emissions continue, and will strongly affect
marine ecosystems. {2.4}
It is virtually certain that global mean sea level rise will
continue for many centuries beyond 2100, with the amount of
rise
dependent on future emissions. The threshold for the loss of the
Greenland ice sheet over a millennium or more, and an asso-
ciated sea level rise of up to 7 m, is greater than about 1°C (low
confidence) but less than about 4°C (medium confidence)
of global warming with respect to pre-industrial temperatures.
Abrupt and irreversible ice loss from the Antarctic ice sheet is
possible, but current evidence and understanding is insufficient
to make a quantitative assessment. {2.4}
Magnitudes and rates of climate change associated with
medium- to high-emission scenarios pose an increased risk of
abrupt and irreversible regional-scale change in the
composition, structure and function of marine, terrestrial and
freshwater
ecosystems, including wetlands (medium confidence). A
reduction in permafrost extent is virtually certain with
continued rise
in global temperatures. {2.4}
Summary for Policymakers
17
SPM
SPM 3. Future Pathways for Adaptation, Mitigation and
Sustainable Development
Adaptation and mitigation are complementary strategies for
reducing and managing the risks
of climate change. Substantial emissions reductions over the
next few decades can reduce cli-
mate risks in the 21st century and beyond, increase prospects
for effective adaptation, reduce
the costs and challenges of mitigation in the longer term and
contribute to climate-resilient
pathways for sustainable development. {3.2, 3.3, 3.4}
SPM 3.1 Foundations of decision-making about climate change
Effective decision-making to limit climate change and its
effects can be informed by a wide
range of analytical approaches for evaluating expected risks and
benefits, recognizing the
importance of governance, ethical dimensions, equity, value
judgments, economic assess-
ments and diverse perceptions and responses to risk and
uncertainty. {3.1}
Sustainable development and equity provide a basis for
assessing climate policies. Limiting the effects of climate
change is
necessary to achieve sustainable development and equity,
including poverty eradication. Countries’ past and future contri-
butions to the accumulation of GHGs in the atmosphere are
different, and countries also face varying challenges and
circum-
stances and have different capacities to address mitigation and
adaptation. Mitigation and adaptation raise issues of equity,
justice and fairness. Many of those most vulnerable to climate
change have contributed and contribute little to GHG emis-
sions. Delaying mitigation shifts burdens from the present to the
future, and insufficient adaptation responses to emerging
impacts are already eroding the basis for sustainable
development. Comprehensive strategies in response to climate
change
that are consistent with sustainable development take into
account the co-benefits, adverse side effects and risks that may
arise from both adaptation and mitigation options. {3.1, 3.5,
Box 3.4}
The design of climate policy is influenced by how individuals
and organizations perceive risks and uncertainties and take
them into account. Methods of valuation from economic, social
and ethical analysis are available to assist decision-making.
These methods can take account of a wide range of possible
impacts, including low-probability outcomes with large conse-
quences. But they cannot identify a single best balance between
mitigation, adaptation and residual climate impacts. {3.1}
Climate change has the characteristics of a collective action
problem at the global scale, because most GHGs accumulate
over time and mix globally, and emissions by any agent (e.g.,
individual, community, company, country) affect other agents.
Effective mitigation will not be achieved if individual agents
advance their own interests independently. Cooperative
responses,
including international cooperation, are therefore required to
effectively mitigate GHG emissions and address other climate
change issues. The effectiveness of adaptation can be enhanced
through complementary actions across levels, including
international cooperation. The evidence suggests that outcomes
seen as equitable can lead to more effective cooperation.
{3.1}
SPM 3.2 Climate change risks reduced by mitigation and
adaptation
Without additional mitigation efforts beyond those in place
today, and even with adaptation,
warming by the end of the 21st century will lead to high to very
high risk of severe, wide-
spread and irreversible impacts globally (high confidence).
Mitigation involves some level
of co-benefits and of risks due to adverse side effects, but these
risks do not involve the
same possibility of severe, widespread and irreversible impacts
as risks from climate change,
increasing the benefits from near-term mitigation efforts. {3.2,
3.4}
Mitigation and adaptation are complementary approaches for
reducing risks of climate change impacts over different time-
scales (high confidence). Mitigation, in the near term and
through the century, can substantially reduce climate change
Summary for Policymakers
18
SPM
impacts in the latter decades of the 21st century and beyond.
Benefits from adaptation can already be realized in addressing
current risks, and can be realized in the future for addressing
emerging risks. {3.2, 4.5}
Five Reasons For Concern (RFCs) aggregate climate change
risks and illustrate the implications of warming and of
adaptation
limits for people, economies and ecosystems across sectors and
regions. The five RFCs are associated with: (1) Unique and
threatened systems, (2) Extreme weather events, (3)
Distribution of impacts, (4) Global aggregate impacts, and (5)
Large-
scale singular events. In this report, the RFCs provide
information relevant to Article 2 of UNFCCC. {Box 2.4}
Without additional mitigation efforts beyond those in place
today, and even with adaptation, warming by the end of the
21st century will lead to high to very high risk of severe,
widespread and irreversible impacts globally (high confidence)
(Figure SPM.10). In most scenarios without additional
mitigation efforts (those with 2100 atmospheric concentrations
Un
iqu
e &
th
rea
ten
ed
sy
ste
ms
Gl
ob
al
ag
gr
eg
at
e i
mp
ac
ts
La
rg
e-s
ca
le
sin
gu
lar
ev
en
ts
Ex
tre
me
w
ea
the
r e
ve
nts
Dis
trib
uti
on
of
im
pa
cts
−100
−50
0
50
100
C
ha
ng
e
in
a
nn
ua
l G
H
G
e
m
is
si
on
s
in
2
05
0
(%
r
el
at
iv
e
to
2
01
0
le
ve
ls
)
no change relative to 2010e
m
is
si
on
in
cr
ea
se
em
is
si
on
re
du
ct
io
ns
observed 2000s
1
2
3
4
5
0
Cumulative anthropogenic CO
2
emissions from 1870 (GtCO
2
)
1000 2000 3000 4000 5000 6000 7000 8000
G
lo
ba
l m
ea
n
te
m
pe
ra
tu
re
c
ha
ng
e
(°
C
r
el
at
iv
e
to
p
re
-in
du
st
ria
l l
ev
el
s)
Undetectable
Moderate
High
Very high
Level of additional
risk due to climate
change (see Box 2.4)
(a) Risks from climate change... (b) ...depend on cumulative CO
2
emissions...
(c) …which in turn depend on annual
GHG emissions over the next decades
baselines
430–480
480–530
530–580
580–720
720–1000
baselines
430–480
480–530
530–580
580–720
720–1000
Figure SPM.10 | The relationship between risks from climate
change, temperature change, cumulative carbon dioxide (CO2)
emissions and changes in
annual greenhouse gas (GHG) emissions by 2050. Limiting risks
across Reasons For Concern (a) would imply a limit for
cumulative emissions of CO2 (b)
which would constrain annual GHG emissions over the next few
decades (c). Panel a reproduces the five Reasons For Concern
{Box 2.4}. Panel b links
temperature changes to cumulative CO2 emissions (in GtCO2)
from 1870. They are based on Coupled Model Intercomparison
Project Phase 5 (CMIP5)
simulations (pink plume) and on a simple climate model
(median climate response in 2100), for the baselines and five
mitigation scenario categories (six
ellipses). Details are provided in Figure SPM.5. Panel c shows
the relationship between the cumulative CO2 emissions (in
GtCO2) of the scenario catego-
ries and their associated change in annual GHG emissions by
2050, expressed in percentage change (in percent GtCO2-eq per
year) relative to 2010. The
ellipses correspond to the same scenario categories as in Panel
b, and are built with a similar method (see details in Figure
SPM.5). {Figure 3.1}
Summary for Policymakers
19
SPM
>1000 ppm CO2-eq), warming is more likely than not to exceed
4°C above pre-industrial levels by 2100 (Table SPM.1). The
risks associated with temperatures at or above 4°C include
substantial species extinction, global and regional food
insecurity,
consequential constraints on common human activities and
limited potential for adaptation in some cases (high confidence).
Some risks of climate change, such as risks to unique and
threatened systems and risks associated with extreme weather
events,
are moderate to high at temperatures 1°C to 2°C above pre-
industrial levels. {2.3, Figure 2.5, 3.2, 3.4, Box 2.4, Table
SPM.1}
Substantial cuts in GHG emissions over the next few decades
can substantially reduce risks of climate change by limiting
warming in the second half of the 21st century and beyond.
Cumulative emissions of CO2 largely determine global mean
surface warming by the late 21st century and beyond. Limiting
risks across RFCs would imply a limit for cumulative emissions
of CO2. Such a limit would require that global net emissions of
CO2 eventually decrease to zero and would constrain annual
emissions over the next few decades (Figure SPM.10) (high
confidence). But some risks from climate damages are unavoid-
able, even with mitigation and adaptation. {2.2.5, 3.2, 3.4}
Mitigation involves some level of co-benefits and risks, but
these risks do not involve the same possibility of severe, wide-
spread and irreversible impacts as risks from climate change.
Inertia in the economic and climate system and the possibility
of irreversible impacts from climate change increase the
benefits from near-term mitigation efforts (high confidence).
Delays
in additional mitigation or constraints on technological options
increase the longer-term mitigation costs to hold climate
change risks at a given level (Table SPM.2). {3.2, 3.4}
SPM 3.3 Characteristics of adaptation pathways
Adaptation can reduce the risks of climate change impacts, but
there are limits to its effec-
tiveness, especially with greater magnitudes and rates of climate
change. Taking a longer-
term perspective, in the context of sustainable development,
increases the likelihood that
more immediate adaptation actions will also enhance future
options and preparedness. {3.3}
Adaptation can contribute to the well-being of populations, the
security of assets and the maintenance of ecosystem goods,
functions and services now and in the future. Adaptation is
place- and context-specific (high confidence). A first step
towards
adaptation to future climate change is reducing vulnerability
and exposure to present climate variability (high confidence).
Integration of adaptation into planning, including policy design,
and decision-making can promote synergies with develop-
ment and disaster risk reduction. Building adaptive capacity is
crucial for effective selection and implementation of adapta-
tion options (robust evidence, high agreement). {3.3}
Adaptation planning and implementation can be enhanced
through complementary actions across levels, from individuals
to
governments (high confidence). National governments can
coordinate adaptation efforts of local and sub-national govern-
ments, for example by protecting vulnerable groups, by
supporting economic diversification and by providing
information,
policy and legal frameworks and financial support (robust
evidence, high agreement). Local government and the private
sector are increasingly recognized as critical to progress in
adaptation, given their roles in scaling up adaptation of commu-
nities, households and civil society and in managing risk
information and financing (medium evidence, high agreement).
{3.3}
Adaptation planning and implementation at all levels of
governance are contingent on societal values, objectives and
risk
perceptions (high confidence). Recognition of diverse interests,
circumstances, social-cultural contexts and expectations can
benefit decision-making processes. Indigenous, local and
traditional knowledge systems and practices, including
indigenous
peoples’ holistic view of community and environment, are a
major resource for adapting to climate change, but these have
not been used consistently in existing adaptation efforts.
Integrating such forms of knowledge with existing practices
increases
the effectiveness of adaptation. {3.3}
Constraints can interact to impede adaptation planning and
implementation (high confidence). Common constraints on
implementation arise from the following: limited financial and
human resources; limited integration or coordination of gov-
ernance; uncertainties about projected impacts; different
perceptions of risks; competing values; absence of key adapta-
tion leaders and advocates; and limited tools to monitor
adaptation effectiveness. Another constraint includes
insufficient
research, monitoring, and observation and the finance to
maintain them. {3.3}
Summary for Policymakers
20
SPM
Greater rates and magnitude of climate change increase the
likelihood of exceeding adaptation limits (high confidence).
Limits to adaptation emerge from the interaction among climate
change and biophysical and/or socio-economic constraints.
Further, poor planning or implementation, overemphasizing
short-term outcomes or failing to sufficiently anticipate conse-
quences can result in maladaptation, increasing the vulnerability
or exposure of the target group in the future or the vulner-
ability of other people, places or sectors (medium evidence,
high agreement). Underestimating the complexity of adaptation
as a social process can create unrealistic expectations about
achieving intended adaptation outcomes. {3.3}
Significant co-benefits, synergies and trade-offs exist between
mitigation and adaptation and among different adap-
tation responses; interactions occur both within and across
regions (very high confidence). Increasing efforts to mitigate
and
adapt to climate change imply an increasing complexity of
interactions, particularly at the intersections among water,
energy, land use and biodiversity, but tools to understand and
manage these interactions remain limited. Examples of
actions with co-benefits include (i) improved energy efficiency
and cleaner energy sources, leading to reduced emissions of
health-damaging, climate-altering air pollutants; (ii) reduced
energy and water consumption in urban areas through greening
cities and recycling water; (iii) sustainable agriculture and
forestry; and (iv) protection of ecosystems for carbon storage
and
other ecosystem services. {3.3}
Transformations in economic, social, technological and political
decisions and actions can enhance adaptation and promote
sustainable development (high confidence). At the national
level, transformation is considered most effective when it
reflects
a country’s own visions and approaches to achieving sustainable
development in accordance with its national circumstances
and priorities. Restricting adaptation responses to incremental
changes to existing systems and structures, without consider-
ing transformational change, may increase costs and losses and
miss opportunities. Planning and implementation of trans-
formational adaptation could reflect strengthened, altered or
aligned paradigms and may place new and increased demands
on governance structures to reconcile different goals and
visions for the future and to address possible equity and ethical
implications. Adaptation pathways are enhanced by iterative
learning, deliberative processes and innovation. {3.3}
SPM 3.4 Characteristics of mitigation pathways
There are multiple mitigation pathways that are likely to limit
warming to below 2°C relative
to pre-industrial levels. These pathways would require
substantial emissions reductions over
the next few decades and near zero emissions of CO2 and other
long-lived greenhouse gases
by the end of the century. Implementing such reductions poses
substantial technological, eco-
nomic, social and institutional challenges, which increase with
delays in additional mitigation
and if key technologies are not available. Limiting warming to
lower or higher levels involves
similar challenges but on different timescales. {3.4}
Without additional efforts to reduce GHG emissions beyond
those in place today, global emissions growth is expected to
persist, driven by growth in global population and economic
activities. Global mean surface temperature increases in 2100
in baseline scenarios—those without additional mitigation—
range from 3.7°C to 4.8°C above the average for 1850–1900
for a median climate response. They range from 2.5°C to 7.8°C
when including climate uncertainty (5th to 95th percentile
range) (high confidence). {3.4}14
Emissions scenarios leading to CO2-equivalent concentrations
in 2100 of about 450 ppm or lower are likely to maintain
warming below 2°C over the 21st century relative to pre-
industrial levels15. These scenarios are characterized by 40 to
70%
global anthropogenic GHG emissions reductions by 2050
compared to 201016, and emissions levels near zero or below in
2100. Mitigation scenarios reaching concentration levels of
about 500 ppm CO2-eq by 2100 are more likely than not to limit
temperature change to less than 2°C, unless they temporarily
overshoot concentration levels of roughly 530 ppm CO2-eq
15 For comparison, the CO2-eq concentration in 2011 is
estimated to be 430 ppm (uncertainty range 340 to 520 ppm)
16 This range differs from the range provided for a similar
concentration category in the AR4 (50 to 85% lower than 2000
for CO2 only). Reasons for this
difference include that this report has assessed a substantially
larger number of scenarios than in the AR4 and looks at all
GHGs. In addition, a large
proportion of the new scenarios include Carbon Dioxide
Removal (CDR) technologies (see below). Other factors include
the use of 2100 concentration
levels instead of stabilization levels and the shift in reference
year from 2000 to 2010.
Summary for Policymakers
21
SPM
before 2100, in which case they are about as likely as not to
achieve that goal. In these 500 ppm CO2-eq scenarios, global
2050
emissions levels are 25 to 55% lower than in 2010. Scenarios
with higher emissions in 2050 are characterized by a greater
reliance on Carbon Dioxide Removal (CDR) technologies
beyond mid-century (and vice versa). Trajectories that are likely
to
limit warming to 3°C relative to pre-industrial levels reduce
emissions less rapidly than those limiting warming to 2°C. A
lim-
ited number of studies provide scenarios that are more likely
than not to limit warming to 1.5°C by 2100; these scenarios are
characterized by concentrations below 430 ppm CO2-eq by 2100
and 2050 emission reduction between 70% and 95% below
2010. For a comprehensive overview of the characteristics of
emissions scenarios, their CO2-equivalent concentrations and
their likelihood to keep warming to below a range of
temperature levels, see Figure SPM.11 and Table SPM.1. {3.4}
21002000 2020 2040 2060 2080 2100
–20
0
20
40
60
80
100
120
140
B
as
el
in
e
RCP8.5
RCP6.0
RCP4.5
RCP2.6
Associated upscaling of low-carbon energy supply
0
20
40
60
80
100
2030 2050 2100 2030 2050 2100 2030 2050 2100 2030 2050
2100
Lo
w
-c
ar
bo
n
en
er
gy
s
ha
re
o
f p
rim
ar
y
en
er
gy
(%
)
A
nn
ua
l G
H
G
e
m
is
si
on
s
(G
tC
O
2-
eq
/y
r)
Year
>1000
720–1000
580–720
530–580
480–530
430–480
Full AR5 database range
ppm CO
2
-eq
ppm CO
2
-eq
ppm CO
2
-eq
ppm CO
2
-eq
ppm CO
2
-eq
ppm CO
2
-eq
GHG emission pathways 2000–2100: All AR5 scenarios
90th Percentile
Median
10th Percentile
Min
75th
Max
Median
25th
Percentile
+
18
0%
+
18
5%
+
27
5%
+
31
0%
+
95
%
+
13
5%
+
13
5%
+
14
5%
2010
580–720 ppm CO
2
-eq 530–580 ppm CO
2
-eq 480–530 ppm CO
2
-eq 430–480 ppm CO
2
-eq
(a)
(b)
Figure SPM.11 | Global greenhouse gas emissions (gigatonne
of CO2-equivalent per year, GtCO2-eq/yr) in baseline and
mitigation scenarios for different
long-term concentration levels (a) and associated upscaling
requirements of low-carbon energy (% of primary energy) for
2030, 2050 and 2100 compared
to 2010 levels in mitigation scenarios (b). {Figure 3.2}
Summary for Policymakers
22
SPM
Table SPM.1 | Key characteristics of the scenarios collected
and assessed for WGIII AR5. For all parameters the 10th to 90th
percentile of the scenarios
is shown a. {Table 3.1}
CO2-eq Con-
centrations in
2100
(ppm CO2-eq) f
Category label
(conc. range)
Subcategories
Relative
position
of the
RCPs d
Change in CO2-eq
emissions compared
to 2010 (in %) c
Likelihood of staying below a specific
temperature level over the 21st cen-
tury (relative to 1850–1900) d, e
2050 2100 1.5ºC 2ºC 3ºC 4ºC
<430 Only a limited number of individual model studies have
explored levels below 430 ppm CO2-eq j
450
(430 to 480)
Total range a, g RCP2.6 –72 to –41 –118 to –78
More unlikely
than likely
Likely
Likely
Likely
500
(480 to 530)
No overshoot of
530 ppm CO2-eq
–57 to –42 –107 to –73
Unlikely
More likely
than not
Overshoot of 530
ppm CO2-eq
–55 to –25 –114 to –90
About as
likely as not
550
(530 to 580)
No overshoot of
580 ppm CO2-eq
–47 to –19 –81 to –59
More unlikely
than likely iOvershoot of 580
ppm CO2-eq
–16 to 7 –183 to –86
(580 to 650) Total range
RCP4.5
–38 to 24 –134 to –50
(650 to 720) Total range –11 to 17 –54 to –21
Unlikely
More likely
than not
(720 to 1000) b Total range RCP6.0 18 to 54 –7 to 72
Unlikely h
More unlikely
than likely
>1000 b Total range RCP8.5 52 to 95 74 to 178 Unlikely h
Unlikely
More unlikely
than likely
Notes:
a The ‘total range’ for the 430 to 480 ppm CO2-eq
concentrations scenarios corresponds to the range of the 10th to
90th percentile of the subcategory of
these scenarios shown in Table 6.3 of the Working Group III
Report.
b Baseline scenarios fall into the >1000 and 720 to 1000 ppm
CO2-eq categories. The latter category also includes mitigation
scenarios. The baseline sce-
narios in the latter category reach a temperature change of
2.5°C to 5.8°C above the average for 1850–1900 in 2100.
Together with the baseline scenarios
in the >1000 ppm CO2-eq category, this leads to an overall
2100 temperature range of 2.5°C to 7.8°C (range based on
median climate response: 3.7°C
to 4.8°C) for baseline scenarios across both concentration
categories.
c The global 2010 emissions are 31% above the 1990 emissions
(consistent with the historic greenhouse gas emission estimates
presented in this report).
CO2-eq emissions include the basket of Kyoto gases (carbon
dioxide (CO2), methane (CH4), nitrous oxide (N2O) as well as
fluorinated gases).
d The assessment here involves a large number of scenarios
published in the scientific literature and is thus not limited to
the Representative Concentration
Pathways (RCPs). To evaluate the CO2-eq concentration and
climate implications of these scenarios, the Model for the
Assessment of Greenhouse Gas
Induced Climate Change (MAGICC) was used in a probabilistic
mode. For a comparison between MAGICC model results and
the outcomes of the models
used in WGI, see WGI 12.4.1.2, 12.4.8 and WGIII 6.3.2.6.
e The assessment in this table is based on the probabilities
calculated for the full ensemble of scenarios in WGIII AR5
using MAGICC and the assessment in
WGI of the uncertainty of the temperature projections not
covered by climate models. The statements are therefore
consistent with the statements in WGI,
which are based on the Coupled Model Intercomparison Project
Phase 5 (CMIP5) runs of the RCPs and the assessed
uncertainties. Hence, the likelihood
statements reflect different lines of evidence from both WGs.
This WGI method was also applied for scenarios with
intermediate concentration levels where
no CMIP5 runs are available. The likelihood statements are
indicative only {WGIII 6.3} and follow broadly the terms used
by the WGI SPM for temperature
projections: likely 66–100%, more likely than not >50–100%,
about as likely as not 33–66%, and unlikely 0–33%. In addition
the term more unlikely
than likely 0–<50% is used.
f The CO2-equivalent concentration (see Glossary) is calculated
on the basis of the total forcing from a simple carbon
cycle/climate model, MAGICC. The CO2-
equivalent concentration in 2011 is estimated to be 430 ppm
(uncertainty range 340 to 520 ppm). This is based on the
assessment of total anthropogenic
radiative forcing for 2011 relative to 1750 in WGI, i.e., 2.3
W/m2, uncertainty range 1.1 to 3.3 W/m2.
g The vast majority of scenarios in this category overshoot the
category boundary of 480 ppm CO2-eq concentration.
h For scenarios in this category, no CMIP5 run or MAGICC
realization stays below the respective temperature level. Still,
an unlikely assignment is given to
reflect uncertainties that may not be reflected by the current
climate models.
i Scenarios in the 580 to 650 ppm CO2-eq category include both
overshoot scenarios and scenarios that do not exceed the
concentration level at the high
end of the category (e.g., RCP4.5). The latter type of scenarios,
in general, have an assessed probability of more unlikely than
likely to stay below the 2°C
temperature level, while the former are mostly assessed to have
an unlikely probability of staying below this level.
j In these scenarios, global CO2-eq emissions in 2050 are
between 70 to 95% below 2010 emissions, and they are between
110 to 120% below 2010
emissions in 2100.
Summary for Policymakers
23
SPM
Mitigation scenarios reaching about 450 ppm CO2-eq in 2100
(consistent with a likely chance to keep warming below 2°C
relative to pre-industrial levels) typically involve temporary
overshoot17 of atmospheric concentrations, as do many
scenarios
reaching about 500 ppm CO2-eq to about 550 ppm CO2-eq in
2100 (Table SPM.1). Depending on the level of overshoot,
overshoot scenarios typically rely on the availability and
widespread deployment of bioenergy with carbon dioxide
capture
and storage (BECCS) and afforestation in the second half of the
century. The availability and scale of these and other CDR
technologies and methods are uncertain and CDR technologies
are, to varying degrees, associated with challenges and
risks18. CDR is also prevalent in many scenarios without
overshoot to compensate for residual emissions from sectors
where
mitigation is more expensive (high confidence). {3.4, Box 3.3}
Reducing emissions of non-CO2 agents can be an important
element of mitigation strategies. All current GHG emissions
and other forcing agents affect the rate and magnitude of
climate change over the next few decades, although long-term
warming is mainly driven by CO2 emissions. Emissions of non-
CO2 forcers are often expressed as ‘CO2-equivalent emissions’,
but the choice of metric to calculate these emissions, and the
implications for the emphasis and timing of abatement of the
various climate forcers, depends on application and policy
context and contains value judgments. {3.4, Box 3.2}
17 In concentration ‘overshoot’ scenarios, concentrations peak
during the century and then decline.
18 CDR methods have biogeochemical and technological
limitations to their potential on the global scale. There is
insufficient knowledge to quantify how
much CO2 emissions could be partially offset by CDR on a
century timescale. CDR methods may carry side effects and
long-term consequences on a
global scale.
Before 2030 After 2030
–12
–9
–6
–3
0
3
6
Past 1900–2010
2000–2010
AR5 scenario range
Interquartile range and median
of model comparisons with
2030 targets
Cancún
Pledges
<50 GtCO
2
-eq
Annual GHG
emissions in 2030
>55 GtCO
2
-eq
Future 2030–2050
0
+
90
%
+
24
0%
2010
(G
tC
O
2-
eq
/y
r)
Year
(%
/y
r)
(%
)
Annual GHG emissions Rate of CO
2
emissions change Share of zero and low-carbon energy
2005 2010 2015 2020 2025 2030
20
25
30
35
40
45
50
55
60
2030 2030 2050 2100 2100 2050
20
40
60
80
100
Figure SPM.12 | The implications of different 2030 greenhouse
gas (GHG) emissions levels for the rate of carbon dioxide
(CO2) emissions reductions
and low-carbon energy upscaling in mitigation scenarios that
are at least about as likely as not to keep warming throughout
the 21st century below 2°C
relative to pre-industrial levels (2100 CO2-equivalent
concentrations of 430 to 530 ppm). The scenarios are grouped
according to different emissions levels
by 2030 (coloured in different shades of green). The left panel
shows the pathways of GHG emissions (gigatonne of CO2-
equivalent per year, GtCO2-eq/
yr) leading to these 2030 levels. The black dot with whiskers
gives historic GHG emission levels and associated uncertainties
in 2010 as reported in Figure
SPM.2. The black bar shows the estimated uncertainty range of
GHG emissions implied by the Cancún Pledges. The middle
panel denotes the average
annual CO2 emissions reduction rates for the period 2030–2050.
It compares the median and interquartile range across scenarios
from recent inter-model
comparisons with explicit 2030 interim goals to the range of
scenarios in the Scenario Database for WGIII AR5. Annual rates
of historical emissions change
(sustained over a period of 20 years) and the average annual
CO2 emission change between 2000 and 2010 are shown as
well. The arrows in the right
panel show the magnitude of zero and low-carbon energy supply
upscaling from 2030 to 2050 subject to different 2030 GHG
emissions levels. Zero- and
low-carbon energy supply includes renewables, nuclear energy
and fossil energy with carbon dioxide capture and storage
(CCS) or bioenergy with CCS
(BECCS). [Note: Only scenarios that apply the full,
unconstrained mitigation technology portfolio of the underlying
models (default technology assumption)
are shown. Scenarios with large net negative global emissions
(>20 GtCO2-eq/yr), scenarios with exogenous carbon price
assumptions and scenarios with
2010 emissions significantly outside the historical range are
excluded.] {Figure 3.3}
Summary for Policymakers
24
SPM
Delaying additional mitigation to 2030 will substantially
increase the challenges associated with limiting warming over
the
21st century to below 2°C relative to pre-industrial levels. It
will require substantially higher rates of emissions reductions
from 2030 to 2050; a much more rapid scale-up of low-carbon
energy over this period; a larger reliance on CDR in the long
term; and higher transitional and long-term economic impacts.
Estimated global emissions levels in 2020 based on the
Cancún Pledges are not consistent with cost-effective mitigation
trajectories that are at least about as likely as not to limit
warming to below 2°C relative to pre-industrial levels, but they
do not preclude the option to meet this goal (high confidence)
(Figure SPM.12, Table SPM.2). {3.4}
Estimates of the aggregate economic costs of mitigation vary
widely depending on methodologies and assumptions, but
increase with the stringency of mitigation. Scenarios in which
all countries of the world begin mitigation immediately, in
which there is a single global carbon price, and in which all key
technologies are available have been used as a cost-effective
benchmark for estimating macro-economic mitigation costs
(Figure SPM.13). Under these assumptions mitigation scenarios
that are likely to limit warming to below 2°C through the 21st
century relative to pre-industrial levels entail losses in global
consumption—not including benefits of reduced climate change
as well as co-benefits and adverse side effects of mitiga-
tion—of 1 to 4% (median: 1.7%) in 2030, 2 to 6% (median:
3.4%) in 2050 and 3 to 11% (median: 4.8%) in 2100 relative to
consumption in baseline scenarios that grows anywhere from
300% to more than 900% over the century (Figure SPM.13).
These numbers correspond to an annualized reduction of
consumption growth by 0.04 to 0.14 (median: 0.06) percentage
points over the century relative to annualized consumption
growth in the baseline that is between 1.6 and 3% per year (high
confidence). {3.4}
In the absence or under limited availability of mitigation
technologies (such as bioenergy, CCS and their combination
BECCS,
nuclear, wind/solar), mitigation costs can increase substantially
depending on the technology considered. Delaying additional
mitigation increases mitigation costs in the medium to long
term. Many models could not limit likely warming to below 2°C
over the 21st century relative to pre-industrial levels if
additional mitigation is considerably delayed. Many models
could
not limit likely warming to below 2°C if bioenergy, CCS and
their combination (BECCS) are limited (high confidence)
(Table SPM.2). {3.4}
0
2
4
6
8
10
12
0
200
400
600
800
1000
Re
du
ct
io
n
in
c
on
su
m
pt
io
n
re
la
tiv
e
to
b
as
el
in
e
(%
)
Global mitigation costs and consumption growth in baseline
scenarios
C
on
su
m
pt
io
n
in
c
or
re
sp
on
di
ng
b
as
el
in
e
sc
en
ar
io
s
(%
in
cr
ea
se
fr
om
2
01
0)
CO
2
-eq concentrations in 2100 (ppm CO
2
-eq)
450 (430–480)
0.06
(0.04 to 0.14)
500 (480–530)
0.06
(0.03 to 0.13)
550 (530–580)
0.04
(0.01 to 0.09)
580–650
0.03
(0.01 to 0.05)
Percentage point reduction in annualized consumption growth
rate over 21st century (%-point)
84th Percentile
Median
16th Percentile
Corresponding
baseline scenarios
20
30
20
50
20
30
20
50
21
00
21
00
Figure SPM.13 | Global mitigation costs in cost-effective
scenarios at different atmospheric concentrations levels in 2100.
Cost-effective scenarios
assume immediate mitigation in all countries and a single global
carbon price, and impose no additional limitations on
technology relative to the models’
default technology assumptions. Consumption losses are shown
relative to a baseline development without climate policy (left
panel). The table at the top
shows percentage points of annualized consumption growth
reductions relative to consumption growth in the baseline of 1.6
to 3% per year (e.g., if the
reduction is 0.06 percentage points per year due to mitigation,
and baseline growth is 2.0% per year, then the growth rate with
mitigation would be 1.94%
per year). Cost estimates shown in this table do not consider the
benefits of reduced climate change or co-benefits and adverse
side effects of mitigation.
Estimates at the high end of these cost ranges are from models
that are relatively inflexible to achieve the deep emissions
reductions required in the long
run to meet these goals and/or include assumptions about
market imperfections that would raise costs. {Figure 3.4}
Summary for Policymakers
25
SPM
Mitigation scenarios reaching about 450 or 500 ppm CO2-eq by
2100 show reduced costs for achieving air quality and energy
security objectives, with significant co-benefits for human
health, ecosystem impacts and sufficiency of resources and
resilience
of the energy system. {4.4.2.2}
Mitigation policy could devalue fossil fuel assets and reduce
revenues for fossil fuel exporters, but differences between
regions
and fuels exist (high confidence). Most mitigation scenarios are
associated with reduced revenues from coal and oil trade for
major exporters (high confidence). The availability of CCS
would reduce the adverse effects of mitigation on the value of
fossil
fuel assets (medium confidence). {4.4.2.2}
Solar Radiation Management (SRM) involves large-scale
methods that seek to reduce the amount of absorbed solar
energy
in the climate system. SRM is untested and is not included in
any of the mitigation scenarios. If it were deployed, SRM would
Table SPM.2 | Increase in global mitigation costs due to either
limited availability of specific technologies or delays in
additional mitigation a relative to
cost-effective scenarios b. The increase in costs is given for the
median estimate and the 16th to 84th percentile range of the
scenarios (in parentheses) c. In
addition, the sample size of each scenario set is provided in the
coloured symbols. The colours of the symbols indicate the
fraction of models from systematic
model comparison exercises that could successfully reach the
targeted concentration level. {Table 3.2}
Mitigation cost increases in scenarios with
limited availability of technologies d
[% increase in total discounted e mitigation costs
(2015–2100) relative to default technology assumptions]
Mitigation cost increases
due to delayed additional
mitigation until 2030
[% increase in mitigation costs
relative to immediate mitigation]
2100
concentrations
(ppm CO2-eq)
no CCS nuclear phase out limited solar/wind limited bioenergy
medium term costs
(2030–2050)
long term
costs
(2050–2100)
450
(430 to 480)
138%
(29 to 297%)
7%
(4 to 18%)
6%
(2 to 29%)
64%
(44 to 78%)
}
44%
(2 to 78%)
37%
(16 to 82%)
500
(480 to 530)
not available
(n.a.)
n.a. n.a. n.a.
550
(530 to 580)
39%
(18 to 78%)
13%
(2 to 23%)
8%
(5 to 15%)
18%
(4 to 66%)
}
15%
(3 to 32%)
16%
(5 to 24%)
580 to 650 n.a. n.a. n.a. n.a.
Symbol legend—fraction of models successful in producing
scenarios (numbers indicate the number of successful models)
: all models successful
: between 80 and 100% of models successful
: between 50 and 80% of models successful
: less than 50% of models successful
Notes:
a Delayed mitigation scenarios are associated with greenhouse
gas emission of more than 55 GtCO2-eq in 2030, and the
increase in mitigation costs is mea-
sured relative to cost-effective mitigation scenarios for the same
long-term concentration level.
b Cost-effective scenarios assume immediate mitigation in all
countries and a single global carbon price, and impose no
additional limitations on technology
relative to the models’ default technology assumptions.
c The range is determined by the central scenarios
encompassing the 16th to 84th percentile range of the scenario
set. Only scenarios with a time horizon
until 2100 are included. Some models that are included in the
cost ranges for concentration levels above 530 ppm CO2-eq in
2100 could not produce associ-
ated scenarios for concentration levels below 530 ppm CO2-eq
in 2100 with assumptions about limited availability of
technologies and/or delayed additional
mitigation.
d No CCS: carbon dioxide capture and storage is not included in
these scenarios. Nuclear phase out: no addition of nuclear
power plants beyond those under
construction, and operation of existing plants until the end of
their lifetime. Limited Solar/Wind: a maximum of 20% global
electricity generation from solar
and wind power in any year of these scenarios. Limited
Bioenergy: a maximum of 100 EJ/yr modern bioenergy supply
globally (modern bioenergy used for
heat, power, combinations and industry was around 18 EJ/yr in
2008). EJ = Exajoule = 1018 Joule.
e Percentage increase of net present value of consumption
losses in percent of baseline consumption (for scenarios from
general equilibrium models) and
abatement costs in percent of baseline gross domestic product
(GDP, for scenarios from partial equilibrium models) for the
period 2015–2100, discounted
at 5% per year.
Summary for Policymakers
26
SPM
entail numerous uncertainties, side effects, risks and
shortcomings and has particular governance and ethical
implications.
SRM would not reduce ocean acidification. If it were
terminated, there is high confidence that surface temperatures
would
rise very rapidly impacting ecosystems susceptible to rapid
rates of change. {Box 3.3}
SPM 4. Adaptation and Mitigation
Many adaptation and mitigation options can help address
climate change, but no single
option is sufficient by itself. Effective implementation depends
on policies and cooperation at
all scales and can be enhanced through integrated responses that
link adaptation and mitiga-
tion with other societal objectives. {4}
SPM 4.1 Common enabling factors and constraints for
adaptation and mitigation responses
Adaptation and mitigation responses are underpinned by
common enabling factors. These
include effective institutions and governance, innovation and
investments in environmentally
sound technologies and infrastructure, sustainable livelihoods
and behavioural and lifestyle
choices. {4.1}
Inertia in many aspects of the socio-economic system constrains
adaptation and mitigation options (medium evidence, high
agreement). Innovation and investments in environmentally
sound infrastructure and technologies can reduce GHG emis-
sions and enhance resilience to climate change (very high
confidence). {4.1}
Vulnerability to climate change, GHG emissions and the
capacity for adaptation and mitigation are strongly influenced
by
livelihoods, lifestyles, behaviour and culture (medium evidence,
medium agreement). Also, the social acceptability and/or
effectiveness of climate policies are influenced by the extent to
which they incentivize or depend on regionally appropriate
changes in lifestyles or behaviours. {4.1}
For many regions and sectors, enhanced capacities to mitigate
and adapt are part of the foundation essential for managing
climate change risks (high confidence). Improving institutions
as well as coordination and cooperation in governance can help
overcome regional constraints associated with mitigation,
adaptation and disaster risk reduction (very high confidence).
{4.1}
SPM 4.2 Response options for adaptation
Adaptation options exist in all sectors, but their context for
implementation and potential to
reduce climate-related risks differs across sectors and regions.
Some adaptation responses
involve significant co-benefits, synergies and trade-offs.
Increasing climate change will
increase challenges for many adaptation options. {4.2}
Adaptation experience is accumulating across regions in the
public and private sectors and within communities. There is
increasing recognition of the value of social (including local
and indigenous), institutional, and ecosystem-based measures
and of the extent of constraints to adaptation. Adaptation is
becoming embedded in some planning processes, with more
limited implementation of responses (high confidence). {1.6,
4.2, 4.4.2.1}
The need for adaptation along with associated challenges is
expected to increase with climate change (very high
confidence).
Adaptation options exist in all sectors and regions, with diverse
potential and approaches depending on their context in
vulnerability reduction, disaster risk management or proactive
adaptation planning (Table SPM.3). Effective strategies and
actions consider the potential for co-benefits and opportunities
within wider strategic goals and development plans. {4.2}
Summary for Policymakers
27
SPM
Table SPM.3 | Approaches for managing the risks of climate
change through adaptation. These approaches should be
considered overlapping rather than
discrete, and they are often pursued simultaneously. Examples
are presented in no specific order and can be relevant to more
than one category. {Table 4.2}
V
u
ln
er
ab
il
it
y
&
E
xp
o
su
re
R
ed
u
ct
io
n
t
hr
o
ug
h
d
ev
el
o
p
m
en
t,
p
la
nn
in
g
&
p
ra
ct
ic
es
in
cl
ud
in
g
m
an
y
lo
w
-r
eg
re
ts
m
ea
su
re
s
A
d
ap
ta
ti
o
n
in
cl
u
d
in
g
i
n
cr
em
en
ta
l
&
t
ra
n
sf
o
rm
at
io
n
al
a
d
ju
st
m
en
ts
Tr
an
sf
o
rm
at
io
n
Overlapping
Approaches
Category Examples
Human
development
Improved access to education, nutrition, health facilities,
energy, safe housing & settlement structures,
& social support structures; Reduced gender inequality &
marginalization in other forms.
Poverty alleviation
Improved access to & control of local resources; Land tenure;
Disaster risk reduction; Social safety nets
& social protection; Insurance schemes.
Livelihood security
Income, asset & livelihood diversification; Improved
infrastructure; Access to technology & decision-
making fora; Increased decision-making power; Changed
cropping, livestock & aquaculture practices;
Reliance on social networks.
Disaster risk
management
Early warning systems; Hazard & vulnerability mapping;
Diversifying water resources; Improved
drainage; Flood & cyclone shelters; Building codes & practices;
Storm & wastewater management;
Transport & road infrastructure improvements.
Ecosystem
management
Maintaining wetlands & urban green spaces; Coastal
afforestation; Watershed & reservoir
management; Reduction of other stressors on ecosystems & of
habitat fragmentation; Maintenance
of genetic diversity; Manipulation of disturbance regimes;
Community-based natural resource
management.
Spatial or land-use
planning
Provisioning of adequate housing, infrastructure & services;
Managing development in flood prone &
other high risk areas; Urban planning & upgrading programs;
Land zoning laws; Easements; Protected
areas.
Structural/physical
Engineered & built-environment options: Sea walls & coastal
protection structures; Flood levees;
Water storage; Improved drainage; Flood & cyclone shelters;
Building codes & practices; Storm &
wastewater management; Transport & road infrastructure
improvements; Floating houses; Power plant
& electricity grid adjustments.
Technological options: New crop & animal varieties;
Indigenous, traditional & local knowledge,
technologies & methods; Efficient irrigation; Water-saving
technologies; Desalinisation; Conservation
agriculture; Food storage & preservation facilities; Hazard &
vulnerability mapping & monitoring; Early
warning systems; Building insulation; Mechanical & passive
cooling; Technology development, transfer
& diffusion.
Ecosystem-based options: Ecological restoration; Soil
conservation; Afforestation & reforestation;
Mangrove conservation & replanting; Green infrastructure (e.g.,
shade trees, green roofs); Controlling
overfishing; Fisheries co-management; Assisted species
migration & dispersal; Ecological corridors;
Seed banks, gene banks & other ex situ conservation;
Community-based natural resource management.
Services: Social safety nets & social protection; Food banks &
ChapterClimate Change 2014Synthesis Report Summary.docx

More Related Content

Similar to ChapterClimate Change 2014Synthesis Report Summary.docx

Climate Change - The Physical Science Basis
Climate Change - The Physical Science BasisClimate Change - The Physical Science Basis
Climate Change - The Physical Science BasisLeonardo ENERGY
 
To Compare and Contrast, Here's Near-Final IPCC Climate Science Summary
To Compare and Contrast, Here's Near-Final IPCC Climate Science SummaryTo Compare and Contrast, Here's Near-Final IPCC Climate Science Summary
To Compare and Contrast, Here's Near-Final IPCC Climate Science SummaryEarth Institute of Columbia University
 
Introduction to Climate Science
Introduction to Climate ScienceIntroduction to Climate Science
Introduction to Climate Scienceipcc-media
 
CLIMATE CHANGE 2013The Physical Science BasisSummary for.docx
CLIMATE CHANGE 2013The Physical Science BasisSummary for.docxCLIMATE CHANGE 2013The Physical Science BasisSummary for.docx
CLIMATE CHANGE 2013The Physical Science BasisSummary for.docxclarebernice
 
Poteplenie klimata O. Gunder_11-b
Poteplenie klimata O. Gunder_11-bPoteplenie klimata O. Gunder_11-b
Poteplenie klimata O. Gunder_11-bJulia Birhova
 
Wgiar5presentation1403
Wgiar5presentation1403Wgiar5presentation1403
Wgiar5presentation1403Nicolás Stern
 
WGI: Changements climatiques à long terme: Projections, engagements et irréve...
WGI: Changements climatiques à long terme: Projections, engagements et irréve...WGI: Changements climatiques à long terme: Projections, engagements et irréve...
WGI: Changements climatiques à long terme: Projections, engagements et irréve...ipcc-media
 
MDIA p3-14 RISK ... Climate Change (IPPC-2013) ...150806
MDIA p3-14 RISK ... Climate Change (IPPC-2013) ...150806MDIA p3-14 RISK ... Climate Change (IPPC-2013) ...150806
MDIA p3-14 RISK ... Climate Change (IPPC-2013) ...150806Peter Burgess
 
IPCC AR6 August 2021 report review
IPCC AR6 August 2021 report reviewIPCC AR6 August 2021 report review
IPCC AR6 August 2021 report reviewMarie-Paule Odini
 
IPCC from AR5 to AR6 - WGI Perspectives - by Panmao Zhai, Co-Chair of WGI
IPCC from AR5 to AR6  - WGI Perspectives - by Panmao Zhai, Co-Chair of WGIIPCC from AR5 to AR6  - WGI Perspectives - by Panmao Zhai, Co-Chair of WGI
IPCC from AR5 to AR6 - WGI Perspectives - by Panmao Zhai, Co-Chair of WGIipcc-media
 
US Climate Assessment 2013 by Images
US Climate Assessment 2013 by ImagesUS Climate Assessment 2013 by Images
US Climate Assessment 2013 by ImagesPeter Carter
 
Key Findings of the IPCC WG1 Fifth Assessment Report
Key Findings of the IPCC WG1 Fifth Assessment ReportKey Findings of the IPCC WG1 Fifth Assessment Report
Key Findings of the IPCC WG1 Fifth Assessment ReportKatestone
 
From IPCC WGI AR5 to AR6
From IPCC WGI AR5 to AR6From IPCC WGI AR5 to AR6
From IPCC WGI AR5 to AR6ipcc-media
 
WebbACPM15gdhjggder59jgfhjfsfhhbvvgv.ppt
WebbACPM15gdhjggder59jgfhjfsfhhbvvgv.pptWebbACPM15gdhjggder59jgfhjfsfhhbvvgv.ppt
WebbACPM15gdhjggder59jgfhjfsfhhbvvgv.pptSravyaPendem1
 
IPCC Summary (sep 23)
IPCC Summary  (sep 23)IPCC Summary  (sep 23)
IPCC Summary (sep 23)Cassia Moraes
 
Cca phil setting pagba apr2014
Cca phil setting pagba apr2014Cca phil setting pagba apr2014
Cca phil setting pagba apr2014Marho Realty
 

Similar to ChapterClimate Change 2014Synthesis Report Summary.docx (20)

Climate Change - The Physical Science Basis
Climate Change - The Physical Science BasisClimate Change - The Physical Science Basis
Climate Change - The Physical Science Basis
 
To Compare and Contrast, Here's Near-Final IPCC Climate Science Summary
To Compare and Contrast, Here's Near-Final IPCC Climate Science SummaryTo Compare and Contrast, Here's Near-Final IPCC Climate Science Summary
To Compare and Contrast, Here's Near-Final IPCC Climate Science Summary
 
Introduction to Climate Science
Introduction to Climate ScienceIntroduction to Climate Science
Introduction to Climate Science
 
CLIMATE CHANGE 2013The Physical Science BasisSummary for.docx
CLIMATE CHANGE 2013The Physical Science BasisSummary for.docxCLIMATE CHANGE 2013The Physical Science BasisSummary for.docx
CLIMATE CHANGE 2013The Physical Science BasisSummary for.docx
 
Poteplenie klimata O. Gunder_11-b
Poteplenie klimata O. Gunder_11-bPoteplenie klimata O. Gunder_11-b
Poteplenie klimata O. Gunder_11-b
 
Mani ppt
Mani pptMani ppt
Mani ppt
 
Wgiar5presentation1403
Wgiar5presentation1403Wgiar5presentation1403
Wgiar5presentation1403
 
Climate Change 2013 : The Physical Science Basis
Climate Change 2013 : The Physical Science BasisClimate Change 2013 : The Physical Science Basis
Climate Change 2013 : The Physical Science Basis
 
WGI: Changements climatiques à long terme: Projections, engagements et irréve...
WGI: Changements climatiques à long terme: Projections, engagements et irréve...WGI: Changements climatiques à long terme: Projections, engagements et irréve...
WGI: Changements climatiques à long terme: Projections, engagements et irréve...
 
Climate Science Explained by Team Norvergence
Climate Science Explained by Team NorvergenceClimate Science Explained by Team Norvergence
Climate Science Explained by Team Norvergence
 
MDIA p3-14 RISK ... Climate Change (IPPC-2013) ...150806
MDIA p3-14 RISK ... Climate Change (IPPC-2013) ...150806MDIA p3-14 RISK ... Climate Change (IPPC-2013) ...150806
MDIA p3-14 RISK ... Climate Change (IPPC-2013) ...150806
 
IPCC AR6 August 2021 report review
IPCC AR6 August 2021 report reviewIPCC AR6 August 2021 report review
IPCC AR6 August 2021 report review
 
IPCC from AR5 to AR6 - WGI Perspectives - by Panmao Zhai, Co-Chair of WGI
IPCC from AR5 to AR6  - WGI Perspectives - by Panmao Zhai, Co-Chair of WGIIPCC from AR5 to AR6  - WGI Perspectives - by Panmao Zhai, Co-Chair of WGI
IPCC from AR5 to AR6 - WGI Perspectives - by Panmao Zhai, Co-Chair of WGI
 
US Climate Assessment 2013 by Images
US Climate Assessment 2013 by ImagesUS Climate Assessment 2013 by Images
US Climate Assessment 2013 by Images
 
Key Findings of the IPCC WG1 Fifth Assessment Report
Key Findings of the IPCC WG1 Fifth Assessment ReportKey Findings of the IPCC WG1 Fifth Assessment Report
Key Findings of the IPCC WG1 Fifth Assessment Report
 
From IPCC WGI AR5 to AR6
From IPCC WGI AR5 to AR6From IPCC WGI AR5 to AR6
From IPCC WGI AR5 to AR6
 
WebbACPM15gdhjggder59jgfhjfsfhhbvvgv.ppt
WebbACPM15gdhjggder59jgfhjfsfhhbvvgv.pptWebbACPM15gdhjggder59jgfhjfsfhhbvvgv.ppt
WebbACPM15gdhjggder59jgfhjfsfhhbvvgv.ppt
 
IPCC Summary (sep 23)
IPCC Summary  (sep 23)IPCC Summary  (sep 23)
IPCC Summary (sep 23)
 
Cca phil setting pagba apr2014
Cca phil setting pagba apr2014Cca phil setting pagba apr2014
Cca phil setting pagba apr2014
 
Drylands Climate: knowledge and projections, Jasper Batureine Mwesigwa ICPAC
Drylands Climate: knowledge and projections, Jasper Batureine Mwesigwa ICPAC Drylands Climate: knowledge and projections, Jasper Batureine Mwesigwa ICPAC
Drylands Climate: knowledge and projections, Jasper Batureine Mwesigwa ICPAC
 

More from tiffanyd4

CHAPTER 3Understanding Regulations, Accreditation Criteria, and .docx
CHAPTER 3Understanding Regulations, Accreditation Criteria, and .docxCHAPTER 3Understanding Regulations, Accreditation Criteria, and .docx
CHAPTER 3Understanding Regulations, Accreditation Criteria, and .docxtiffanyd4
 
Chapter 3 Human RightsINTERNATIONAL HUMAN RIGHTS–BASED ORGANIZ.docx
Chapter 3 Human RightsINTERNATIONAL HUMAN RIGHTS–BASED ORGANIZ.docxChapter 3 Human RightsINTERNATIONAL HUMAN RIGHTS–BASED ORGANIZ.docx
Chapter 3 Human RightsINTERNATIONAL HUMAN RIGHTS–BASED ORGANIZ.docxtiffanyd4
 
CHAPTER 13Contributing to the ProfessionNAEYC Administrator Co.docx
CHAPTER 13Contributing to the ProfessionNAEYC Administrator Co.docxCHAPTER 13Contributing to the ProfessionNAEYC Administrator Co.docx
CHAPTER 13Contributing to the ProfessionNAEYC Administrator Co.docxtiffanyd4
 
Chapter 4Legal Construction of the Employment Environment©vi.docx
Chapter 4Legal Construction of the Employment Environment©vi.docxChapter 4Legal Construction of the Employment Environment©vi.docx
Chapter 4Legal Construction of the Employment Environment©vi.docxtiffanyd4
 
Chapter 2 The Law of EducationIntroductionThis chapter describ.docx
Chapter 2 The Law of EducationIntroductionThis chapter describ.docxChapter 2 The Law of EducationIntroductionThis chapter describ.docx
Chapter 2 The Law of EducationIntroductionThis chapter describ.docxtiffanyd4
 
CHAPTER 1 Legal Heritage and the Digital AgeStatue of Liberty,.docx
CHAPTER 1 Legal Heritage and the Digital AgeStatue of Liberty,.docxCHAPTER 1 Legal Heritage and the Digital AgeStatue of Liberty,.docx
CHAPTER 1 Legal Heritage and the Digital AgeStatue of Liberty,.docxtiffanyd4
 
CHAPTER 1 BASIC CONCEPTS AND DEFINITIONS OF HUMAN SERVICESPAUL F.docx
CHAPTER 1 BASIC CONCEPTS AND DEFINITIONS OF HUMAN SERVICESPAUL F.docxCHAPTER 1 BASIC CONCEPTS AND DEFINITIONS OF HUMAN SERVICESPAUL F.docx
CHAPTER 1 BASIC CONCEPTS AND DEFINITIONS OF HUMAN SERVICESPAUL F.docxtiffanyd4
 
CHAPTER 20 Employment Law and Worker ProtectionWashington DC.docx
CHAPTER 20 Employment Law and Worker ProtectionWashington DC.docxCHAPTER 20 Employment Law and Worker ProtectionWashington DC.docx
CHAPTER 20 Employment Law and Worker ProtectionWashington DC.docxtiffanyd4
 
Chapter 1 Global Issues Challenges of GlobalizationA GROWING .docx
Chapter 1 Global Issues Challenges of GlobalizationA GROWING .docxChapter 1 Global Issues Challenges of GlobalizationA GROWING .docx
Chapter 1 Global Issues Challenges of GlobalizationA GROWING .docxtiffanyd4
 
CHAPTER 23 Consumer ProtectionRestaurantFederal and state go.docx
CHAPTER 23 Consumer ProtectionRestaurantFederal and state go.docxCHAPTER 23 Consumer ProtectionRestaurantFederal and state go.docx
CHAPTER 23 Consumer ProtectionRestaurantFederal and state go.docxtiffanyd4
 
Chapter 18 When looking further into the EU’s Energy Security and.docx
Chapter 18 When looking further into the EU’s Energy Security and.docxChapter 18 When looking further into the EU’s Energy Security and.docx
Chapter 18 When looking further into the EU’s Energy Security and.docxtiffanyd4
 
CHAPTER 17 Investor Protection and E-Securities TransactionsNe.docx
CHAPTER 17 Investor Protection and E-Securities TransactionsNe.docxCHAPTER 17 Investor Protection and E-Securities TransactionsNe.docx
CHAPTER 17 Investor Protection and E-Securities TransactionsNe.docxtiffanyd4
 
Chapter 13 Law, Ethics, and Educational Leadership Making the Con.docx
Chapter 13 Law, Ethics, and Educational Leadership Making the Con.docxChapter 13 Law, Ethics, and Educational Leadership Making the Con.docx
Chapter 13 Law, Ethics, and Educational Leadership Making the Con.docxtiffanyd4
 
Chapter 12 presented strategic planning and performance with Int.docx
Chapter 12 presented strategic planning and performance with Int.docxChapter 12 presented strategic planning and performance with Int.docx
Chapter 12 presented strategic planning and performance with Int.docxtiffanyd4
 
ChapterTool KitChapter 7102715Corporate Valuation and Stock Valu.docx
ChapterTool KitChapter 7102715Corporate Valuation and Stock Valu.docxChapterTool KitChapter 7102715Corporate Valuation and Stock Valu.docx
ChapterTool KitChapter 7102715Corporate Valuation and Stock Valu.docxtiffanyd4
 
CHAPTER 12Working with Families and CommunitiesNAEYC Administr.docx
CHAPTER 12Working with Families and CommunitiesNAEYC Administr.docxCHAPTER 12Working with Families and CommunitiesNAEYC Administr.docx
CHAPTER 12Working with Families and CommunitiesNAEYC Administr.docxtiffanyd4
 
Chapter 10. Political Socialization The Making of a CitizenLear.docx
Chapter 10. Political Socialization The Making of a CitizenLear.docxChapter 10. Political Socialization The Making of a CitizenLear.docx
Chapter 10. Political Socialization The Making of a CitizenLear.docxtiffanyd4
 
Chapters one and twoAnswer the questions in complete paragraphs .docx
Chapters one and twoAnswer the questions in complete paragraphs .docxChapters one and twoAnswer the questions in complete paragraphs .docx
Chapters one and twoAnswer the questions in complete paragraphs .docxtiffanyd4
 
ChapterTool KitChapter 1212912Corporate Valuation and Financial .docx
ChapterTool KitChapter 1212912Corporate Valuation and Financial .docxChapterTool KitChapter 1212912Corporate Valuation and Financial .docx
ChapterTool KitChapter 1212912Corporate Valuation and Financial .docxtiffanyd4
 
Chapters 4-6 Preparing Written MessagesPrepari.docx
Chapters 4-6  Preparing Written MessagesPrepari.docxChapters 4-6  Preparing Written MessagesPrepari.docx
Chapters 4-6 Preparing Written MessagesPrepari.docxtiffanyd4
 

More from tiffanyd4 (20)

CHAPTER 3Understanding Regulations, Accreditation Criteria, and .docx
CHAPTER 3Understanding Regulations, Accreditation Criteria, and .docxCHAPTER 3Understanding Regulations, Accreditation Criteria, and .docx
CHAPTER 3Understanding Regulations, Accreditation Criteria, and .docx
 
Chapter 3 Human RightsINTERNATIONAL HUMAN RIGHTS–BASED ORGANIZ.docx
Chapter 3 Human RightsINTERNATIONAL HUMAN RIGHTS–BASED ORGANIZ.docxChapter 3 Human RightsINTERNATIONAL HUMAN RIGHTS–BASED ORGANIZ.docx
Chapter 3 Human RightsINTERNATIONAL HUMAN RIGHTS–BASED ORGANIZ.docx
 
CHAPTER 13Contributing to the ProfessionNAEYC Administrator Co.docx
CHAPTER 13Contributing to the ProfessionNAEYC Administrator Co.docxCHAPTER 13Contributing to the ProfessionNAEYC Administrator Co.docx
CHAPTER 13Contributing to the ProfessionNAEYC Administrator Co.docx
 
Chapter 4Legal Construction of the Employment Environment©vi.docx
Chapter 4Legal Construction of the Employment Environment©vi.docxChapter 4Legal Construction of the Employment Environment©vi.docx
Chapter 4Legal Construction of the Employment Environment©vi.docx
 
Chapter 2 The Law of EducationIntroductionThis chapter describ.docx
Chapter 2 The Law of EducationIntroductionThis chapter describ.docxChapter 2 The Law of EducationIntroductionThis chapter describ.docx
Chapter 2 The Law of EducationIntroductionThis chapter describ.docx
 
CHAPTER 1 Legal Heritage and the Digital AgeStatue of Liberty,.docx
CHAPTER 1 Legal Heritage and the Digital AgeStatue of Liberty,.docxCHAPTER 1 Legal Heritage and the Digital AgeStatue of Liberty,.docx
CHAPTER 1 Legal Heritage and the Digital AgeStatue of Liberty,.docx
 
CHAPTER 1 BASIC CONCEPTS AND DEFINITIONS OF HUMAN SERVICESPAUL F.docx
CHAPTER 1 BASIC CONCEPTS AND DEFINITIONS OF HUMAN SERVICESPAUL F.docxCHAPTER 1 BASIC CONCEPTS AND DEFINITIONS OF HUMAN SERVICESPAUL F.docx
CHAPTER 1 BASIC CONCEPTS AND DEFINITIONS OF HUMAN SERVICESPAUL F.docx
 
CHAPTER 20 Employment Law and Worker ProtectionWashington DC.docx
CHAPTER 20 Employment Law and Worker ProtectionWashington DC.docxCHAPTER 20 Employment Law and Worker ProtectionWashington DC.docx
CHAPTER 20 Employment Law and Worker ProtectionWashington DC.docx
 
Chapter 1 Global Issues Challenges of GlobalizationA GROWING .docx
Chapter 1 Global Issues Challenges of GlobalizationA GROWING .docxChapter 1 Global Issues Challenges of GlobalizationA GROWING .docx
Chapter 1 Global Issues Challenges of GlobalizationA GROWING .docx
 
CHAPTER 23 Consumer ProtectionRestaurantFederal and state go.docx
CHAPTER 23 Consumer ProtectionRestaurantFederal and state go.docxCHAPTER 23 Consumer ProtectionRestaurantFederal and state go.docx
CHAPTER 23 Consumer ProtectionRestaurantFederal and state go.docx
 
Chapter 18 When looking further into the EU’s Energy Security and.docx
Chapter 18 When looking further into the EU’s Energy Security and.docxChapter 18 When looking further into the EU’s Energy Security and.docx
Chapter 18 When looking further into the EU’s Energy Security and.docx
 
CHAPTER 17 Investor Protection and E-Securities TransactionsNe.docx
CHAPTER 17 Investor Protection and E-Securities TransactionsNe.docxCHAPTER 17 Investor Protection and E-Securities TransactionsNe.docx
CHAPTER 17 Investor Protection and E-Securities TransactionsNe.docx
 
Chapter 13 Law, Ethics, and Educational Leadership Making the Con.docx
Chapter 13 Law, Ethics, and Educational Leadership Making the Con.docxChapter 13 Law, Ethics, and Educational Leadership Making the Con.docx
Chapter 13 Law, Ethics, and Educational Leadership Making the Con.docx
 
Chapter 12 presented strategic planning and performance with Int.docx
Chapter 12 presented strategic planning and performance with Int.docxChapter 12 presented strategic planning and performance with Int.docx
Chapter 12 presented strategic planning and performance with Int.docx
 
ChapterTool KitChapter 7102715Corporate Valuation and Stock Valu.docx
ChapterTool KitChapter 7102715Corporate Valuation and Stock Valu.docxChapterTool KitChapter 7102715Corporate Valuation and Stock Valu.docx
ChapterTool KitChapter 7102715Corporate Valuation and Stock Valu.docx
 
CHAPTER 12Working with Families and CommunitiesNAEYC Administr.docx
CHAPTER 12Working with Families and CommunitiesNAEYC Administr.docxCHAPTER 12Working with Families and CommunitiesNAEYC Administr.docx
CHAPTER 12Working with Families and CommunitiesNAEYC Administr.docx
 
Chapter 10. Political Socialization The Making of a CitizenLear.docx
Chapter 10. Political Socialization The Making of a CitizenLear.docxChapter 10. Political Socialization The Making of a CitizenLear.docx
Chapter 10. Political Socialization The Making of a CitizenLear.docx
 
Chapters one and twoAnswer the questions in complete paragraphs .docx
Chapters one and twoAnswer the questions in complete paragraphs .docxChapters one and twoAnswer the questions in complete paragraphs .docx
Chapters one and twoAnswer the questions in complete paragraphs .docx
 
ChapterTool KitChapter 1212912Corporate Valuation and Financial .docx
ChapterTool KitChapter 1212912Corporate Valuation and Financial .docxChapterTool KitChapter 1212912Corporate Valuation and Financial .docx
ChapterTool KitChapter 1212912Corporate Valuation and Financial .docx
 
Chapters 4-6 Preparing Written MessagesPrepari.docx
Chapters 4-6  Preparing Written MessagesPrepari.docxChapters 4-6  Preparing Written MessagesPrepari.docx
Chapters 4-6 Preparing Written MessagesPrepari.docx
 

Recently uploaded

Software Engineering Methodologies (overview)
Software Engineering Methodologies (overview)Software Engineering Methodologies (overview)
Software Engineering Methodologies (overview)eniolaolutunde
 
Sanyam Choudhary Chemistry practical.pdf
Sanyam Choudhary Chemistry practical.pdfSanyam Choudhary Chemistry practical.pdf
Sanyam Choudhary Chemistry practical.pdfsanyamsingh5019
 
Q4-W6-Restating Informational Text Grade 3
Q4-W6-Restating Informational Text Grade 3Q4-W6-Restating Informational Text Grade 3
Q4-W6-Restating Informational Text Grade 3JemimahLaneBuaron
 
Advanced Views - Calendar View in Odoo 17
Advanced Views - Calendar View in Odoo 17Advanced Views - Calendar View in Odoo 17
Advanced Views - Calendar View in Odoo 17Celine George
 
9548086042 for call girls in Indira Nagar with room service
9548086042  for call girls in Indira Nagar  with room service9548086042  for call girls in Indira Nagar  with room service
9548086042 for call girls in Indira Nagar with room servicediscovermytutordmt
 
Separation of Lanthanides/ Lanthanides and Actinides
Separation of Lanthanides/ Lanthanides and ActinidesSeparation of Lanthanides/ Lanthanides and Actinides
Separation of Lanthanides/ Lanthanides and ActinidesFatimaKhan178732
 
microwave assisted reaction. General introduction
microwave assisted reaction. General introductionmicrowave assisted reaction. General introduction
microwave assisted reaction. General introductionMaksud Ahmed
 
Web & Social Media Analytics Previous Year Question Paper.pdf
Web & Social Media Analytics Previous Year Question Paper.pdfWeb & Social Media Analytics Previous Year Question Paper.pdf
Web & Social Media Analytics Previous Year Question Paper.pdfJayanti Pande
 
mini mental status format.docx
mini    mental       status     format.docxmini    mental       status     format.docx
mini mental status format.docxPoojaSen20
 
Paris 2024 Olympic Geographies - an activity
Paris 2024 Olympic Geographies - an activityParis 2024 Olympic Geographies - an activity
Paris 2024 Olympic Geographies - an activityGeoBlogs
 
Activity 01 - Artificial Culture (1).pdf
Activity 01 - Artificial Culture (1).pdfActivity 01 - Artificial Culture (1).pdf
Activity 01 - Artificial Culture (1).pdfciinovamais
 
Student login on Anyboli platform.helpin
Student login on Anyboli platform.helpinStudent login on Anyboli platform.helpin
Student login on Anyboli platform.helpinRaunakKeshri1
 
Presentation by Andreas Schleicher Tackling the School Absenteeism Crisis 30 ...
Presentation by Andreas Schleicher Tackling the School Absenteeism Crisis 30 ...Presentation by Andreas Schleicher Tackling the School Absenteeism Crisis 30 ...
Presentation by Andreas Schleicher Tackling the School Absenteeism Crisis 30 ...EduSkills OECD
 
Organic Name Reactions for the students and aspirants of Chemistry12th.pptx
Organic Name Reactions  for the students and aspirants of Chemistry12th.pptxOrganic Name Reactions  for the students and aspirants of Chemistry12th.pptx
Organic Name Reactions for the students and aspirants of Chemistry12th.pptxVS Mahajan Coaching Centre
 
Sports & Fitness Value Added Course FY..
Sports & Fitness Value Added Course FY..Sports & Fitness Value Added Course FY..
Sports & Fitness Value Added Course FY..Disha Kariya
 
JAPAN: ORGANISATION OF PMDA, PHARMACEUTICAL LAWS & REGULATIONS, TYPES OF REGI...
JAPAN: ORGANISATION OF PMDA, PHARMACEUTICAL LAWS & REGULATIONS, TYPES OF REGI...JAPAN: ORGANISATION OF PMDA, PHARMACEUTICAL LAWS & REGULATIONS, TYPES OF REGI...
JAPAN: ORGANISATION OF PMDA, PHARMACEUTICAL LAWS & REGULATIONS, TYPES OF REGI...anjaliyadav012327
 
Beyond the EU: DORA and NIS 2 Directive's Global Impact
Beyond the EU: DORA and NIS 2 Directive's Global ImpactBeyond the EU: DORA and NIS 2 Directive's Global Impact
Beyond the EU: DORA and NIS 2 Directive's Global ImpactPECB
 
Call Girls in Dwarka Mor Delhi Contact Us 9654467111
Call Girls in Dwarka Mor Delhi Contact Us 9654467111Call Girls in Dwarka Mor Delhi Contact Us 9654467111
Call Girls in Dwarka Mor Delhi Contact Us 9654467111Sapana Sha
 

Recently uploaded (20)

Software Engineering Methodologies (overview)
Software Engineering Methodologies (overview)Software Engineering Methodologies (overview)
Software Engineering Methodologies (overview)
 
INDIA QUIZ 2024 RLAC DELHI UNIVERSITY.pptx
INDIA QUIZ 2024 RLAC DELHI UNIVERSITY.pptxINDIA QUIZ 2024 RLAC DELHI UNIVERSITY.pptx
INDIA QUIZ 2024 RLAC DELHI UNIVERSITY.pptx
 
Sanyam Choudhary Chemistry practical.pdf
Sanyam Choudhary Chemistry practical.pdfSanyam Choudhary Chemistry practical.pdf
Sanyam Choudhary Chemistry practical.pdf
 
Q4-W6-Restating Informational Text Grade 3
Q4-W6-Restating Informational Text Grade 3Q4-W6-Restating Informational Text Grade 3
Q4-W6-Restating Informational Text Grade 3
 
Advanced Views - Calendar View in Odoo 17
Advanced Views - Calendar View in Odoo 17Advanced Views - Calendar View in Odoo 17
Advanced Views - Calendar View in Odoo 17
 
9548086042 for call girls in Indira Nagar with room service
9548086042  for call girls in Indira Nagar  with room service9548086042  for call girls in Indira Nagar  with room service
9548086042 for call girls in Indira Nagar with room service
 
Separation of Lanthanides/ Lanthanides and Actinides
Separation of Lanthanides/ Lanthanides and ActinidesSeparation of Lanthanides/ Lanthanides and Actinides
Separation of Lanthanides/ Lanthanides and Actinides
 
microwave assisted reaction. General introduction
microwave assisted reaction. General introductionmicrowave assisted reaction. General introduction
microwave assisted reaction. General introduction
 
Web & Social Media Analytics Previous Year Question Paper.pdf
Web & Social Media Analytics Previous Year Question Paper.pdfWeb & Social Media Analytics Previous Year Question Paper.pdf
Web & Social Media Analytics Previous Year Question Paper.pdf
 
mini mental status format.docx
mini    mental       status     format.docxmini    mental       status     format.docx
mini mental status format.docx
 
Paris 2024 Olympic Geographies - an activity
Paris 2024 Olympic Geographies - an activityParis 2024 Olympic Geographies - an activity
Paris 2024 Olympic Geographies - an activity
 
Activity 01 - Artificial Culture (1).pdf
Activity 01 - Artificial Culture (1).pdfActivity 01 - Artificial Culture (1).pdf
Activity 01 - Artificial Culture (1).pdf
 
Student login on Anyboli platform.helpin
Student login on Anyboli platform.helpinStudent login on Anyboli platform.helpin
Student login on Anyboli platform.helpin
 
Presentation by Andreas Schleicher Tackling the School Absenteeism Crisis 30 ...
Presentation by Andreas Schleicher Tackling the School Absenteeism Crisis 30 ...Presentation by Andreas Schleicher Tackling the School Absenteeism Crisis 30 ...
Presentation by Andreas Schleicher Tackling the School Absenteeism Crisis 30 ...
 
Código Creativo y Arte de Software | Unidad 1
Código Creativo y Arte de Software | Unidad 1Código Creativo y Arte de Software | Unidad 1
Código Creativo y Arte de Software | Unidad 1
 
Organic Name Reactions for the students and aspirants of Chemistry12th.pptx
Organic Name Reactions  for the students and aspirants of Chemistry12th.pptxOrganic Name Reactions  for the students and aspirants of Chemistry12th.pptx
Organic Name Reactions for the students and aspirants of Chemistry12th.pptx
 
Sports & Fitness Value Added Course FY..
Sports & Fitness Value Added Course FY..Sports & Fitness Value Added Course FY..
Sports & Fitness Value Added Course FY..
 
JAPAN: ORGANISATION OF PMDA, PHARMACEUTICAL LAWS & REGULATIONS, TYPES OF REGI...
JAPAN: ORGANISATION OF PMDA, PHARMACEUTICAL LAWS & REGULATIONS, TYPES OF REGI...JAPAN: ORGANISATION OF PMDA, PHARMACEUTICAL LAWS & REGULATIONS, TYPES OF REGI...
JAPAN: ORGANISATION OF PMDA, PHARMACEUTICAL LAWS & REGULATIONS, TYPES OF REGI...
 
Beyond the EU: DORA and NIS 2 Directive's Global Impact
Beyond the EU: DORA and NIS 2 Directive's Global ImpactBeyond the EU: DORA and NIS 2 Directive's Global Impact
Beyond the EU: DORA and NIS 2 Directive's Global Impact
 
Call Girls in Dwarka Mor Delhi Contact Us 9654467111
Call Girls in Dwarka Mor Delhi Contact Us 9654467111Call Girls in Dwarka Mor Delhi Contact Us 9654467111
Call Girls in Dwarka Mor Delhi Contact Us 9654467111
 

ChapterClimate Change 2014Synthesis Report Summary.docx

  • 1. Chapter Climate Change 2014 Synthesis Report Summary for Policymakers Summary for Policymakers 2 SPM Introduction This Synthesis Report is based on the reports of the three Working Groups of the Intergovernmental Panel on Climate Change (IPCC), including relevant Special Reports. It provides an integrated view of climate change as the final part of the IPCC’s Fifth Assessment Report (AR5). This summary follows the structure of the longer report which addresses the following topics: Observed changes and their causes; Future climate change, risks and impacts; Future pathways for adaptation, mitigation and sustainable development; Adaptation and mitigation.
  • 2. In the Synthesis Report, the certainty in key assessment findings is communicated as in the Working Group Reports and Special Reports. It is based on the author teams’ evaluations of underlying scientific understanding and is expressed as a qualitative level of confidence (from very low to very high) and, when possible, probabilistically with a quantified likelihood (from exceptionally unlikely to virtually certain)1. Where appropriate, findings are also formulated as statements of fact with- out using uncertainty qualifiers. This report includes information relevant to Article 2 of the United Nations Framework Convention on Climate Change (UNFCCC). SPM 1. Observed Changes and their Causes Human influence on the climate system is clear, and recent anthropogenic emissions of green- house gases are the highest in history. Recent climate changes have had widespread impacts on human and natural systems. {1} SPM 1.1 Observed changes in the climate system Warming of the climate system is unequivocal, and since the 1950s, many of the observed changes are unprecedented over decades to millennia. The atmosphere and ocean have warmed, the amounts of snow and ice have diminished, and sea level has risen. {1.1} Each of the last three decades has been successively warmer at the Earth’s surface than any preceding decade since 1850. The period from 1983 to 2012 was likely the warmest 30-year period
  • 3. of the last 1400 years in the Northern Hemisphere, where such assessment is possible (medium confidence). The globally averaged combined land and ocean surface temperature data as calculated by a linear trend show a warming of 0.85 [0.65 to 1.06] °C 2 over the period 1880 to 2012, when multiple independently produced datasets exist (Figure SPM.1a). {1.1.1, Figure 1.1} In addition to robust multi-decadal warming, the globally averaged surface temperature exhibits substantial decadal and interannual variability (Figure SPM.1a). Due to this natural variability, trends based on short records are very sensitive to the beginning and end dates and do not in general reflect long-term climate trends. As one example, the rate of warming over 1 Each finding is grounded in an evaluation of underlying evidence and agreement. In many cases, a synthesis of evidence and agreement supports an assignment of confidence. The summary terms for evidence are: limited, medium or robust. For agreement, they are low, medium or high. A level of confidence is expressed using five qualifiers: very low, low, medium, high and very high, and typeset in italics, e.g., medium confidence. The follow- ing terms have been used to indicate the assessed likelihood of an outcome or a result: virtually certain 99–100% probability, very likely 90–100%, likely 66–100%, about as likely as not 33–66%, unlikely 0– 33%, very unlikely 0–10%, exceptionally unlikely 0–1%. Additional terms (extremely likely 95–100%, more likely than not >50–100%, more unlikely than likely 0–<50%, extremely unlikely 0–5%) may also be used when appropriate. Assessed likelihood is typeset in italics, e.g., very likely. See
  • 4. for more details: Mastrandrea, M.D., C.B. Field, T.F. Stocker, O. Edenhofer, K.L. Ebi, D.J. Frame, H. Held, E. Kriegler, K.J. Mach, P.R. Matschoss, G.-K. Plattner, G.W. Yohe and F.W. Zwiers, 2010: Guidance Note for Lead Authors of the IPCC Fifth Assess- ment Report on Consistent Treatment of Uncertainties, Intergovernmental Panel on Climate Change (IPCC), Geneva, Switzerland, 4 pp. 2 Ranges in square brackets or following ‘±’ are expected to have a 90% likelihood of including the value that is being estimated, unless otherwise stated. Summary for Policymakers 3 SPM −1 −0.8 −0.6 −0.4 −0.2 0 0.2
  • 5. 0.4 (° C ) Globally averaged combined land and ocean surface temperature anomaly 1850 1900 1950 2000 Year −0.2 −0.15 −0.1 −0.05 0 0.05 0.1 (m ) Globally averaged sea level change(b) 1850 1900 1950 2000 Year (G
  • 6. tC O 2/ yr ) 0 5 10 15 20 25 30 35 40 Fossil fuels, cement and flaring Forestry and other land use 1850 1900 1950 2000 Year 800 1000
  • 8. 340 360 380 400 C O 2 (p pm ) 1850 1900 1950 2000 Year 0 500 1000 1500 2000 1750 – 1970 1750
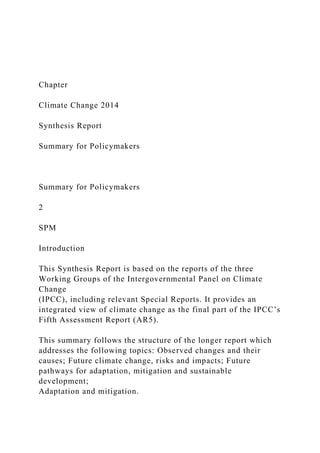
  • 9. – 2011 Cumulative CO2 emissions (G tC O 2) (a) (c) (d) Globally averaged greenhouse gas concentrations Global anthropogenic CO2 emissions Quantitative information of CH4 and N2O emission time series from 1850 to 1970 is limited Figure SPM.1 | The complex relationship between the observations (panels a, b, c, yellow background) and the emissions (panel d, light blue background) is addressed in Section 1.2 and Topic 1. Observations and other indicators of a changing global climate system. Observa- tions: (a) Annually and globally averaged combined land and ocean surface temperature anomalies relative to the average over the period 1986 to 2005. Colours indicate different data sets. (b) Annually and globally averaged sea level change relative to the average over the period 1986 to 2005 in the
  • 10. longest-running dataset. Colours indicate different data sets. All datasets are aligned to have the same value in 1993, the first year of satellite altimetry data (red). Where assessed, uncertainties are indicated by coloured shading. (c) Atmospheric concentrations of the greenhouse gases carbon dioxide (CO2, green), methane (CH4, orange) and nitrous oxide (N2O, red) determined from ice core data (dots) and from direct atmospheric measurements (lines). Indicators: (d) Global anthropogenic CO2 emissions from forestry and other land use as well as from burning of fossil fuel, cement production and flaring. Cumulative emissions of CO2 from these sources and their uncertainties are shown as bars and whiskers, respectively, on the right hand side. The global effects of the accumulation of CH4 and N2O emissions are shown in panel c. Greenhouse gas emission data from 1970 to 2010 are shown in Figure SPM.2. {Figures 1.1, 1.3, 1.5} Summary for Policymakers 4 SPM the past 15 years (1998–2012; 0.05 [–0.05 to 0.15] °C per decade), which begins with a strong El Niño, is smaller than the rate calculated since 1951 (1951–2012; 0.12 [0.08 to 0.14] °C per decade). {1.1.1, Box 1.1} Ocean warming dominates the increase in energy stored in the climate system, accounting for more than 90% of the energy accumulated between 1971 and 2010 (high confidence), with
  • 11. only about 1% stored in the atmosphere. On a global scale, the ocean warming is largest near the surface, and the upper 75 m warmed by 0.11 [0.09 to 0.13] °C per decade over the period 1971 to 2010. It is virtually certain that the upper ocean (0−700 m) warmed from 1971 to 2010, and it likely warmed between the 1870s and 1971. {1.1.2, Figure 1.2} Averaged over the mid-latitude land areas of the Northern Hemisphere, precipitation has increased since 1901 (medium confidence before and high confidence after 1951). For other latitudes, area-averaged long-term positive or negative trends have low confidence. Observations of changes in ocean surface salinity also provide indirect evidence for changes in the global water cycle over the ocean (medium confidence). It is very likely that regions of high salinity, where evaporation dom- inates, have become more saline, while regions of low salinity, where precipitation dominates, have become fresher since the 1950s. {1.1.1, 1.1.2} Since the beginning of the industrial era, oceanic uptake of CO2 has resulted in acidification of the ocean; the pH of ocean surface water has decreased by 0.1 (high confidence), corresponding to a 26% increase in acidity, measured as hydrogen ion concentration. {1.1.2} Over the period 1992 to 2011, the Greenland and Antarctic ice sheets have been losing mass (high confidence), likely at a larger rate over 2002 to 2011. Glaciers have continued to shrink almost worldwide (high confidence). Northern Hemisphere spring snow cover has continued to decrease in extent (high confidence). There is high confidence that permafrost tempera- tures have increased in most regions since the early 1980s in response to increased surface temperature and changing snow cover. {1.1.3}
  • 12. The annual mean Arctic sea-ice extent decreased over the period 1979 to 2012, with a rate that was very likely in the range 3.5 to 4.1% per decade. Arctic sea-ice extent has decreased in every season and in every successive decade since 1979, with the most rapid decrease in decadal mean extent in summer (high confidence). It is very likely that the annual mean Antarctic sea-ice extent increased in the range of 1.2 to 1.8% per decade between 1979 and 2012. However, there is high confidence that there are strong regional differences in Antarctica, with extent increasing in some regions and decreasing in others. {1.1.3, Figure 1.1} Over the period 1901 to 2010, global mean sea level rose by 0.19 [0.17 to 0.21] m (Figure SPM.1b). The rate of sea level rise since the mid-19th century has been larger than the mean rate during the previous two millennia (high confidence). {1.1.4, Figure 1.1} SPM 1.2 Causes of climate change Anthropogenic greenhouse gas (GHG) emissions since the pre- industrial era have driven large increases in the atmospheric concentrations of carbon dioxide (CO2), methane (CH4) and nitrous oxide (N2O) (Figure SPM.1c). Between 1750 and 2011, cumulative anthropogenic CO2 emissions to the atmosphere were 2040 ± 310 GtCO2. About 40% of these emissions have remained in the atmosphere (880 ± 35 GtCO2); the rest was removed from the atmosphere and stored on land (in plants and soils) and in the ocean. The ocean has absorbed about 30% of the emitted anthropogenic CO2, causing ocean acidification. About half of the anthropogenic CO2 emissions between 1750 and 2011 have occurred in the last 40 years (high confidence) (Figure SPM.1d). {1.2.1, 1.2.2}
  • 13. Anthropogenic greenhouse gas emissions have increased since the pre-industrial era, driven largely by economic and population growth, and are now higher than ever. This has led to atmo- spheric concentrations of carbon dioxide, methane and nitrous oxide that are unprecedented in at least the last 800,000 years. Their effects, together with those of other anthropogenic driv- ers, have been detected throughout the climate system and are extremely likely to have been the dominant cause of the observed warming since the mid-20th century. {1.2, 1.3.1} Summary for Policymakers 5 SPM Total anthropogenic GHG emissions have continued to increase over 1970 to 2010 with larger absolute increases between 2000 and 2010, despite a growing number of climate change mitigation policies. Anthropogenic GHG emissions in 2010 have reached 49 ± 4.5 GtCO2-eq/yr 3. Emissions of CO2 from fossil fuel combustion and industrial processes contributed about 78% of the total GHG emissions increase from 1970 to 2010, with a similar percentage contribution for the increase during the period 2000 to 2010 (high confidence) (Figure SPM.2). Globally, economic and population growth continued to be the most important drivers of increases in CO2 emissions from fossil fuel combustion. The contribution of population growth between 2000 and 2010 remained roughly identical to the previous three decades, while the contribution of economic growth has
  • 14. risen sharply. Increased use of coal has reversed the long- standing trend of gradual decarbonization (i.e., reducing the carbon intensity of energy) of the world’s energy supply (high confidence). {1.2.2} The evidence for human influence on the climate system has grown since the IPCC Fourth Assessment Report (AR4). It is extremely likely that more than half of the observed increase in global average surface temperature from 1951 to 2010 was caused by the anthropogenic increase in GHG concentrations and other anthropogenic forcings together. The best estimate of the human-induced contribution to warming is similar to the observed warming over this period (Figure SPM.3). Anthro- pogenic forcings have likely made a substantial contribution to surface temperature increases since the mid-20th century over every continental region except Antarctica4. Anthropogenic influences have likely affected the global water cycle since 1960 and contributed to the retreat of glaciers since the 1960s and to the increased surface melting of the Greenland ice sheet since 1993. Anthropogenic influences have very likely contributed to Arctic sea-ice loss since 1979 and have very likely made a substantial contribution to increases in global upper ocean heat content (0–700 m) and to global mean sea level rise observed since the 1970s. {1.3, Figure 1.10} 3 Greenhouse gas emissions are quantified as CO2-equivalent (GtCO2-eq) emissions using weightings based on the 100-year Global Warming Potentials, using IPCC Second Assessment Report values unless otherwise stated. {Box 3.2} 4 For Antarctica, large observational uncertainties result in low confidence that anthropogenic forcings have contributed to the
  • 15. observed warming aver- aged over available stations. Gas CO 2 Fossil fuel and industrial processes CO 2 FOLU CH 4 N 2 O F-Gases 2010 2010 (GWP 100 SAR)Year (GWP 100 AR5) Total annual anthropogenic GHG emissions by gases 1970–2010 27 Gt
  • 18. 201020052000199519901985198019751970 +2.2%/yr 2000–2010 +1.3%/yr 1970–2000 10% 20% 62% Figure SPM.2 | Total annual anthropogenic greenhouse gas (GHG) emissions (gigatonne of CO2-equivalent per year, GtCO2-eq/yr) for the period 1970 to 2010 by gases: CO2 from fossil fuel combustion and industrial processes; CO2 from Forestry and Other Land Use (FOLU); methane (CH4); nitrous oxide (N2O); fluorinated gases covered under the Kyoto Protocol (F- gases). Right hand side shows 2010 emissions, using alternatively CO2-equivalent emission weightings based on IPCC Second Assessment Report (SAR) and AR5 values. Unless otherwise stated, CO2-equivalent emissions in this report include the basket of Kyoto gases (CO2, CH4, N2O as well as F-gases) calculated based on 100-year Global Warming Potential (GWP100) values from the SAR (see Glos- sary). Using the most recent GWP100 values from the AR5 (right-hand bars) would result in higher total annual GHG emissions (52 GtCO2-eq/yr) from an increased contribution of methane, but does not change the long-term trend significantly. {Figure 1.6, Box 3.2}
  • 19. Summary for Policymakers 6 SPM SPM 1.3 Impacts of climate change In recent decades, changes in climate have caused impacts on natural and human systems on all continents and across the oceans. Impacts are due to observed climate change, irrespec- tive of its cause, indicating the sensitivity of natural and human systems to changing climate. {1.3.2} Evidence of observed climate change impacts is strongest and most comprehensive for natural systems. In many regions, changing precipitation or melting snow and ice are altering hydrological systems, affecting water resources in terms of quantity and quality (medium confidence). Many terrestrial, freshwater and marine species have shifted their geographic ranges, seasonal activities, migration patterns, abundances and species interactions in response to ongoing climate change (high confidence). Some impacts on human systems have also been attributed to climate change, with a major or minor contribution of climate change distinguishable from other influences (Figure SPM.4). Assessment of many studies covering a wide range of regions and crops shows that negative impacts of climate change on crop yields have been more common than positive impacts (high confidence). Some impacts of ocean acidification on marine organisms have been attributed to human influence (medium confidence). {1.3.2}
  • 20. Combined anthropogenic forcings Other anthropogenic forcings OBSERVED WARMING Greenhouse gases Contributions to observed surface temperature change over the period 1951–2010 Natural forcings Natural internal variability –0.5 0.0 0.5 1.0 (°C) Figure SPM.3 | Assessed likely ranges (whiskers) and their mid-points (bars) for warming trends over the 1951–2010 period from well-mixed greenhouse gases, other anthropogenic forcings (including the cooling effect of aerosols and the effect of land use change), combined anthropogenic forcings, natural forcings and natural internal climate variability (which is the element of climate variability that arises spontaneously within the climate system even in the absence of forcings). The observed surface temperature change is shown in black, with the 5 to 95% uncertainty range due to observational uncertainty. The attributed warming ranges (colours) are based on observations combined with climate model simulations, in order to estimate the contribution of an individual external forcing to the observed warming. The contribution from the combined anthropogenic forcings can be
  • 21. estimated with less uncertainty than the contributions from greenhouse gases and from other anthropogenic forcings separately. This is because these two contributions partially compen- sate, resulting in a combined signal that is better constrained by observations. {Figure 1.9} Summary for Policymakers 7 SPM SPM 1.4 Extreme events Changes in many extreme weather and climate events have been observed since about 1950. Some of these changes have been linked to human influences, including a decrease in cold tem- perature extremes, an increase in warm temperature extremes, an increase in extreme high sea levels and an increase in the number of heavy precipitation events in a number of regions. {1.4} It is very likely that the number of cold days and nights has decreased and the number of warm days and nights has increased on the global scale. It is likely that the frequency of heat waves has increased in large parts of Europe, Asia and Australia. It is Widespread impacts attributed to climate change based on the available scientific literature since the AR4 medlow veryhigh
  • 22. very low high Glaciers, snow, ice and/or permafrost indicates confidence range Rivers, lakes, floods and/or drought Terrestrial ecosystems Impacts identified based on availability of studies across a region Marine ecosystemsCoastal erosion and/or sea level effects Wildfire Livelihoods, health and/or economics Food production Physical systems Biological systems Human and managed systems Filled symbols = Major contribution of climate change Outlined symbols = Minor contribution of climate change Confidence in attribution to climate change
  • 23. Observed impacts attributed to climate change for 9329 10544 8101 325529821987 AUSTRALASIA ASIANORTH AMERICA CENTRAL AND SOUTH AMERICA AFRICA EUROPE SMALL ISLANDS POLAR REGIONS (Arctic and Antarctic) Figure SPM.4 | Based on the available scientific literature since the IPCC Fourth Assessment Report (AR4), there are substantially more impacts in recent decades now attributed to climate change. Attribution requires defined scientific evidence on the role of climate change. Absence from the map of addi- tional impacts attributed to climate change does not imply that such impacts have not occurred. The publications supporting attributed impacts reflect a growing knowledge base, but publications are still limited for many regions, systems and processes, highlighting gaps in data and studies. Symbols indicate
  • 24. categories of attributed impacts, the relative contribution of climate change (major or minor) to the observed impact and confidence in attribution. Each symbol refers to one or more entries in WGII Table SPM.A1, grouping related regional-scale impacts. Numbers in ovals indicate regional totals of climate change publications from 2001 to 2010, based on the Scopus bibliographic database for publications in English with individual countries mentioned in title, abstract or key words (as of July 2011). These numbers provide an overall measure of the available scientific literature on climate change across regions; they do not indicate the number of publications supporting attribution of climate change impacts in each region. Studies for polar regions and small islands are grouped with neighbouring continental regions. The inclusion of publications for assessment of attribution followed IPCC scientific evidence criteria defined in WGII Chapter 18. Publications considered in the attribution analyses come from a broader range of literature assessed in the WGII AR5. See WGII Table SPM.A1 for descriptions of the attributed impacts. {Figure 1.11} Summary for Policymakers 8 SPM very likely that human influence has contributed to the observed global scale changes in the frequency and intensity of daily temperature extremes since the mid-20th century. It is likely that human influence has more than doubled the prob-
  • 25. ability of occurrence of heat waves in some locations. There is medium confidence that the observed warming has increased heat-related human mortality and decreased cold-related human mortality in some regions. {1.4} There are likely more land regions where the number of heavy precipitation events has increased than where it has decreased. Recent detection of increasing trends in extreme precipitation and discharge in some catchments implies greater risks of flooding at regional scale (medium confidence). It is likely that extreme sea levels (for example, as experienced in storm surges) have increased since 1970, being mainly a result of rising mean sea level. {1.4} Impacts from recent climate-related extremes, such as heat waves, droughts, floods, cyclones and wildfires, reveal significant vulnerability and exposure of some ecosystems and many human systems to current climate variability (very high confi- dence). {1.4} SPM 2. Future Climate Changes, Risks and Impacts Continued emission of greenhouse gases will cause further warming and long-lasting changes in all components of the climate system, increasing the likelihood of severe, pervasive and irreversible impacts for people and ecosystems. Limiting climate change would require substantial and sustained reductions in greenhouse gas emissions which, together with adaptation, can limit climate change risks. {2} SPM 2.1 Key drivers of future climate Cumulative emissions of CO2 largely determine global mean
  • 26. surface warming by the late 21st century and beyond. Projections of greenhouse gas emissions vary over a wide range, depending on both socio-economic development and climate policy. {2.1} Anthropogenic GHG emissions are mainly driven by population size, economic activity, lifestyle, energy use, land use patterns, technology and climate policy. The Representative Concentration Pathways (RCPs), which are used for making projections based on these factors, describe four different 21st century pathways of GHG emissions and atmospheric concentrations, air pollutant emissions and land use. The RCPs include a stringent mitigation scenario (RCP2.6), two intermediate scenarios (RCP4.5 and RCP6.0) and one scenario with very high GHG emissions (RCP8.5). Scenarios without additional efforts to constrain emissions (’baseline scenarios’) lead to pathways ranging between RCP6.0 and RCP8.5 (Figure SPM.5a). RCP2.6 is representative of a scenario that aims to keep global warming likely below 2°C above pre-industrial temperatures. The RCPs are consistent with the wide range of scenarios in the literature as assessed by WGIII5. {2.1, Box 2.2, 4.3} Multiple lines of evidence indicate a strong, consistent, almost linear relationship between cumulative CO2 emissions and projected global temperature change to the year 2100 in both the RCPs and the wider set of mitigation scenarios analysed in WGIII (Figure SPM.5b). Any given level of warming is associated with a range of cumulative CO2 emissions6, and therefore, e.g., higher emissions in earlier decades imply lower emissions later. {2.2.5, Table 2.2}
  • 27. 5 Roughly 300 baseline scenarios and 900 mitigation scenarios are categorized by CO2-equivalent concentration (CO2-eq) by 2100. The CO2-eq includes the forcing due to all GHGs (including halogenated gases and tropospheric ozone), aerosols and albedo change. 6 Quantification of this range of CO2 emissions requires taking into account non-CO2 drivers. Summary for Policymakers 9 SPM Year A nn ua l e m is si on s (G tC O
  • 28. 2/ yr ) 1950 2000 2050 2100 −100 0 100 200 Historical emissions RCP2.6 RCP4.5 RCP6.0 RCP8.5 Fu ll ra ng e of t he
  • 30. 530−580 480−530 430−480 (a) (b) WGIII scenario categories: RCP scenarios: 1 2 3 4 5 Te m pe ra tu re c ha
  • 31. ng e re la tiv e to 1 86 1– 18 80 (° C ) Warming versus cumulative CO2 emissions Total human-induced warming 1000 2000 3000 4000 5000 6000 7000 8000 90000 1000 GtC 2000 GtC Cumulative anthropogenic CO2 emissions from 1870 (GtCO2) 0 430–480
  • 32. 480–530 530–580 580–720 720–1000 baselines observed 2000s Figure SPM.5 | (a) Emissions of carbon dioxide (CO2) alone in the Representative Concentration Pathways (RCPs) (lines) and the associated scenario categories used in WGIII (coloured areas show 5 to 95% range). The WGIII scenario categories summarize the wide range of emission scenarios published in the scientific literature and are defined on the basis of CO2- eq concentration levels (in ppm) in 2100. The time series of other greenhouse gas emissions are shown in Box 2.2, Figure 1. (b) Global mean surface temperature increase at the time global CO2 emissions reach a given net cumulative total, plotted as a function of that total, from various lines of evidence. Coloured plume shows the spread of past and future projections from a hierarchy of climate- carbon cycle models driven by historical emissions and the four RCPs over all times out to 2100, and fades with the decreasing number of available models. Ellipses show total anthropogenic warming in 2100 versus cumulative CO2 emissions from 1870 to 2100 from a simple climate model (median climate response) under the scenario categories used in WGIII. The width of the ellipses in terms of temperature is caused by the
  • 33. impact of different scenarios for non-CO2 climate drivers. The filled black ellipse shows observed emissions to 2005 and observed temperatures in the decade 2000–2009 with associated uncertainties. {Box 2.2, Figure 1; Figure 2.3} Summary for Policymakers 10 SPM Multi-model results show that limiting total human-induced warming to less than 2°C relative to the period 1861–1880 with a probability of >66%7 would require cumulative CO2 emissions from all anthropogenic sources since 1870 to remain below about 2900 GtCO2 (with a range of 2550 to 3150 GtCO2 depending on non-CO2 drivers). About 1900 GtCO28 had already been emitted by 2011. For additional context see Table 2.2. {2.2.5} SPM 2.2 Projected changes in the climate system Surface temperature is projected to rise over the 21st century under all assessed emission scenarios. It is very likely that heat waves will occur more often and last longer, and that extreme precipitation events will become more intense and frequent in many regions. The ocean will continue to warm and acidify, and global mean sea level to rise. {2.2} The projected changes in Section SPM 2.2 are for 2081–2100
  • 34. relative to 1986–2005, unless otherwise indicated. Future climate will depend on committed warming caused by past anthropogenic emissions, as well as future anthropogenic emissions and natural climate variability. The global mean surface temperature change for the period 2016–2035 relative to 1986–2005 is similar for the four RCPs and will likely be in the range 0.3°C to 0.7°C (medium confidence). This assumes that there will be no major volcanic eruptions or changes in some natural sources (e.g., CH4 and N2O), or unexpected changes in total solar irradiance. By mid-21st century, the magnitude of the projected climate change is substantially affected by the choice of emissions scenario. {2.2.1, Table 2.1} Relative to 1850–1900, global surface temperature change for the end of the 21st century (2081–2100) is projected to likely exceed 1.5°C for RCP4.5, RCP6.0 and RCP8.5 (high confidence). Warming is likely to exceed 2°C for RCP6.0 and RCP8.5 (high confidence), more likely than not to exceed 2°C for RCP4.5 (medium confidence), but unlikely to exceed 2°C for RCP2.6 (medium confidence). {2.2.1} The increase of global mean surface temperature by the end of the 21st century (2081–2100) relative to 1986–2005 is likely to be 0.3°C to 1.7°C under RCP2.6, 1.1°C to 2.6°C under RCP4.5, 1.4°C to 3.1°C under RCP6.0 and 2.6°C to 4.8°C under RCP8.59. The Arctic region will continue to warm more rapidly than the global mean (Figure SPM.6a, Figure SPM.7a). {2.2.1, Figure 2.1, Figure 2.2, Table 2.1} It is virtually certain that there will be more frequent hot and fewer cold temperature extremes over most land areas on daily and seasonal timescales, as global mean surface temperature increases. It is very likely that heat waves will occur with a
  • 35. higher frequency and longer duration. Occasional cold winter extremes will continue to occur. {2.2.1} 7 Corresponding figures for limiting warming to 2°C with a probability of >50% and >33% are 3000 GtCO2 (range of 2900 to 3200 GtCO2) and 3300 GtCO2 (range of 2950 to 3800 GtCO2) respectively. Higher or lower temperature limits would imply larger or lower cumulative emissions respectively. 8 This corresponds to about two thirds of the 2900 GtCO2 that would limit warming to less than 2°C with a probability of >66%; to about 63% of the total amount of 3000 GtCO2 that would limit warming to less than 2°C with a probability of >50%; and to about 58% of the total amount of 3300 GtCO2 that would limit warming to less than 2°C with a probability of >33%. 9 The period 1986–2005 is approximately 0.61 [0.55 to 0.67] °C warmer than 1850–1900. {2.2.1} Summary for Policymakers 11 SPM Figure SPM.6 | Global average surface temperature change (a) and global mean sea level rise10 (b) from 2006 to 2100 as determined by multi-model simulations. All changes are relative to 1986–2005. Time series of projections and a measure of uncertainty (shading) are shown for scenarios RCP2.6
  • 36. (blue) and RCP8.5 (red). The mean and associated uncertainties averaged over 2081–2100 are given for all RCP scenarios as coloured vertical bars at the right hand side of each panel. The number of Coupled Model Intercomparison Project Phase 5 (CMIP5) models used to calculate the multi-model mean is indicated. {2.2, Figure 2.1} Changes in precipitation will not be uniform. The high latitudes and the equatorial Pacific are likely to experience an increase in annual mean precipitation under the RCP8.5 scenario. In many mid-latitude and subtropical dry regions, mean precipi- tation will likely decrease, while in many mid-latitude wet regions, mean precipitation will likely increase under the RCP8.5 scenario (Figure SPM.7b). Extreme precipitation events over most of the mid-latitude land masses and over wet tropical regions will very likely become more intense and more frequent. {2.2.2, Figure 2.2} The global ocean will continue to warm during the 21st century, with the strongest warming projected for the surface in tropical and Northern Hemisphere subtropical regions (Figure SPM.7a). {2.2.3, Figure 2.2} 10 Based on current understanding (from observations, physical understanding and modelling), only the collapse of marine- based sectors of the Antarctic ice sheet, if initiated, could cause global mean sea level to rise substantially above the likely range during the 21st century. There is medium confidence that this additional contribution would not exceed several tenths of a meter of sea level rise during the 21st century. Global mean sea level rise (relative to 1986–2005)
  • 39. .5 32 39 Global average surface temperature change (relative to 1986–2005) Mean over 2081–2100 (a) 2000 21002050 Year 6 4 2 0 –2 (° C ) Summary for Policymakers
  • 40. 12 SPM Earth System Models project a global increase in ocean acidification for all RCP scenarios by the end of the 21st century, with a slow recovery after mid-century under RCP2.6. The decrease in surface ocean pH is in the range of 0.06 to 0.07 (15 to 17% increase in acidity) for RCP2.6, 0.14 to 0.15 (38 to 41%) for RCP4.5, 0.20 to 0.21 (58 to 62%) for RCP6.0 and 0.30 to 0.32 (100 to 109%) for RCP8.5. {2.2.4, Figure 2.1} Year-round reductions in Arctic sea ice are projected for all RCP scenarios. A nearly ice-free11 Arctic Ocean in the summer sea- ice minimum in September before mid-century is likely for RCP8.512 (medium confidence). {2.2.3, Figure 2.1} It is virtually certain that near-surface permafrost extent at high northern latitudes will be reduced as global mean surface temperature increases, with the area of permafrost near the surface (upper 3.5 m) projected to decrease by 37% (RCP2.6) to 81% (RCP8.5) for the multi-model average (medium confidence). {2.2.3} The global glacier volume, excluding glaciers on the periphery of Antarctica (and excluding the Greenland and Antarctic ice sheets), is projected to decrease by 15 to 55% for RCP2.6 and by 35 to 85% for RCP8.5 (medium confidence). {2.2.3} 11 When sea-ice extent is less than one million km2 for at least five consecutive years. 12 Based on an assessment of the subset of models that most closely reproduce the climatological mean state and 1979–2012 trend of the Arctic sea-ice
  • 41. extent. RCP2.6 RCP8.5 −20 −10−30−50 −40 0 10 20 30 40 50 (b) Change in average precipitation (1986−2005 to 2081−2100) 3932 (%) (a) Change in average surface temperature (1986−2005 to 2081−2100) 3932 (°C) −0.5−1−2 −1.5 0 1 1.5 2 3 4 5 7 9 110.5 Figure SPM.7 | Change in average surface temperature (a) and change in average precipitation (b) based on multi-model mean projections for 2081–2100 relative to 1986–2005 under the RCP2.6 (left) and RCP8.5 (right) scenarios. The number of models used to calculate the multi-model mean is indicated in the upper right corner of each panel. Stippling (i.e., dots) shows regions where the projected change is large compared to natural internal variability and where at least 90% of models agree on the sign of change. Hatching (i.e., diagonal lines) shows regions where the projected change is less than one standard deviation of the natural internal variability. {2.2, Figure 2.2}
  • 42. Summary for Policymakers 13 SPM There has been significant improvement in understanding and projection of sea level change since the AR4. Global mean sea level rise will continue during the 21st century, very likely at a faster rate than observed from 1971 to 2010. For the period 2081–2100 relative to 1986–2005, the rise will likely be in the ranges of 0.26 to 0.55 m for RCP2.6, and of 0.45 to 0.82 m for RCP8.5 (medium confidence)10 (Figure SPM.6b). Sea level rise will not be uniform across regions. By the end of the 21st century, it is very likely that sea level will rise in more than about 95% of the ocean area. About 70% of the coastlines worldwide are projected to experience a sea level change within ±20% of the global mean. {2.2.3} SPM 2.3 Future risks and impacts caused by a changing climate Climate change will amplify existing risks and create new risks for natural and human sys- tems. Risks are unevenly distributed and are generally greater for disadvantaged people and communities in countries at all levels of development. {2.3} Risk of climate-related impacts results from the interaction of climate-related hazards (including hazardous events and trends) with the vulnerability and exposure of human and natural systems, including their ability to adapt. Rising rates and magnitudes of warming and other changes in the climate system, accompanied by ocean acidification, increase the risk
  • 43. of severe, pervasive and in some cases irreversible detrimental impacts. Some risks are particularly relevant for individual regions (Figure SPM.8), while others are global. The overall risks of future climate change impacts can be reduced by limiting the rate and magnitude of climate change, including ocean acidification. The precise levels of climate change sufficient to trigger abrupt and irreversible change remain uncertain, but the risk associated with crossing such thresholds increases with rising temperature (medium confidence). For risk assessment, it is important to evaluate the widest possible range of impacts, including low-probability outcomes with large consequences. {1.5, 2.3, 2.4, 3.3, Box Introduction.1, Box 2.3, Box 2.4} A large fraction of species faces increased extinction risk due to climate change during and beyond the 21st century, espe- cially as climate change interacts with other stressors (high confidence). Most plant species cannot naturally shift their geographical ranges sufficiently fast to keep up with current and high projected rates of climate change in most landscapes; most small mammals and freshwater molluscs will not be able to keep up at the rates projected under RCP4.5 and above in flat landscapes in this century (high confidence). Future risk is indicated to be high by the observation that natural global climate change at rates lower than current anthropogenic climate change caused significant ecosystem shifts and species extinctions during the past millions of years. Marine organisms will face progressively lower oxygen levels and high rates and magnitudes of ocean acidification (high confidence), with associated risks exacerbated by rising ocean temperature extremes (medium confidence). Coral reefs and polar ecosystems are highly vulnerable. Coastal systems and low-lying areas are at risk from sea level rise, which will continue for centuries even if the global mean temperature is stabilized (high confidence). {2.3, 2.4, Figure 2.5}
  • 44. Climate change is projected to undermine food security (Figure SPM.9). Due to projected climate change by the mid-21st century and beyond, global marine species redistribution and marine biodiversity reduction in sensitive regions will challenge the sustained provision of fisheries productivity and other ecosystem services (high confidence). For wheat, rice and maize in tropical and temper- ate regions, climate change without adaptation is projected to negatively impact production for local temperature increases of 2°C or more above late 20th century levels, although individual locations may benefit (medium confidence). Global tem- perature increases of ~4°C or more13 above late 20th century levels, combined with increasing food demand, would pose large risks to food security globally (high confidence). Climate change is projected to reduce renewable surface water and groundwater resources in most dry subtropical regions (robust evidence, high agreement), intensifying competition for water among sectors (limited evidence, medium agreement). {2.3.1, 2.3.2} 13 Projected warming averaged over land is larger than global average warming for all RCP scenarios for the period 2081– 2100 relative to 1986–2005. For regional projections, see Figure SPM.7. {2.2} Summary for Policymakers 14 SPM
  • 91. lo w , l ow , m ed iu m , h ig h or v er y hi gh . R is k le ve ls a
  • 110. ga tio n. Summary for Policymakers 15 SPM Until mid-century, projected climate change will impact human health mainly by exacerbating health problems that already exist (very high confidence). Throughout the 21st century, climate change is expected to lead to increases in ill-health in many regions and especially in developing countries with low income, as compared to a baseline without climate change (high confidence). By 2100 for RCP8.5, the combination of high temperature and humidity in some areas for parts of the year is expected to compromise common human activities, including growing food and working outdoors (high confidence). {2.3.2} In urban areas climate change is projected to increase risks for people, assets, economies and ecosystems, including risks from heat stress, storms and extreme precipitation, inland and coastal flooding, landslides, air pollution, drought, water scar- city, sea level rise and storm surges (very high confidence). These risks are amplified for those lacking essential infrastructure and services or living in exposed areas. {2.3.2} Climate change poses risks for food production
  • 111. Change in maximum catch potential (2051–2060 compared to 2001–2010, SRES A1B) Pe rc en ta ge o f y ie ld p ro je ct io ns –21 to –50%<–50% –6 to –20% –1 to –5% no data 0 to 4% 5 to 19% 20 to 49% 50 to 100% >100 % (a) (b) 0 to –5% –5 to –10%
  • 112. –10 to –25% –25 to –50% –50 to –100% 0 to 5% 5 to 10% 10 to 25% 25 to 50% 50 to 100% Range of yield change 0 20 40 60 80 100 increase in yield decrease in yield
  • 113. 2010–2029 2030–2049 2050–2069 2070–2089 2090–2109 Figure SPM.9 | (a) Projected global redistribution of maximum catch potential of ~1000 exploited marine fish and invertebrate species. Projections compare the 10-year averages 2001–2010 and 2051–2060 using ocean conditions based on a single climate model under a moderate to high warming scenario, without analysis of potential impacts of overfishing or ocean acidification. (b) Summary of projected changes in crop yields (mostly wheat, maize, rice and soy), due to climate change over the 21st century. Data for each timeframe sum to 100%, indicating the percentage of projections showing yield increases versus decreases. The figure includes projections (based on 1090 data points) for different emission scenarios, for tropical and temperate regions and for adaptation and no-adaptation cases combined. Changes in crop yields are relative to late 20th century levels. {Figure 2.6a, Figure 2.7} Summary for Policymakers 16 SPM Rural areas are expected to experience major impacts on water availability and supply, food security, infrastructure and agricultural incomes, including shifts in the production areas of food and non-food crops around the world (high confidence). {2.3.2} Aggregate economic losses accelerate with increasing
  • 114. temperature (limited evidence, high agreement), but global economic impacts from climate change are currently difficult to estimate. From a poverty perspective, climate change impacts are projected to slow down economic growth, make poverty reduction more difficult, further erode food security and prolong existing and create new poverty traps, the latter particularly in urban areas and emerging hotspots of hunger (medium confi- dence). International dimensions such as trade and relations among states are also important for understanding the risks of climate change at regional scales. {2.3.2} Climate change is projected to increase displacement of people (medium evidence, high agreement). Populations that lack the resources for planned migration experience higher exposure to extreme weather events, particularly in developing coun- tries with low income. Climate change can indirectly increase risks of violent conflicts by amplifying well-documented drivers of these conflicts such as poverty and economic shocks (medium confidence). {2.3.2} SPM 2.4 Climate change beyond 2100, irreversibility and abrupt changes Many aspects of climate change and associated impacts will continue for centuries, even if anthropogenic emissions of greenhouse gases are stopped. The risks of abrupt or irreversible changes increase as the magnitude of the warming increases. {2.4} Warming will continue beyond 2100 under all RCP scenarios except RCP2.6. Surface temperatures will remain approximately constant at elevated levels for many centuries after a complete cessation of net anthropogenic CO2 emissions. A large frac-
  • 115. tion of anthropogenic climate change resulting from CO2 emissions is irreversible on a multi-century to millennial timescale, except in the case of a large net removal of CO2 from the atmosphere over a sustained period. {2.4, Figure 2.8} Stabilization of global average surface temperature does not imply stabilization for all aspects of the climate system. Shifting biomes, soil carbon, ice sheets, ocean temperatures and associated sea level rise all have their own intrinsic long timescales which will result in changes lasting hundreds to thousands of years after global surface temperature is stabilized. {2.1, 2.4} There is high confidence that ocean acidification will increase for centuries if CO2 emissions continue, and will strongly affect marine ecosystems. {2.4} It is virtually certain that global mean sea level rise will continue for many centuries beyond 2100, with the amount of rise dependent on future emissions. The threshold for the loss of the Greenland ice sheet over a millennium or more, and an asso- ciated sea level rise of up to 7 m, is greater than about 1°C (low confidence) but less than about 4°C (medium confidence) of global warming with respect to pre-industrial temperatures. Abrupt and irreversible ice loss from the Antarctic ice sheet is possible, but current evidence and understanding is insufficient to make a quantitative assessment. {2.4} Magnitudes and rates of climate change associated with medium- to high-emission scenarios pose an increased risk of abrupt and irreversible regional-scale change in the composition, structure and function of marine, terrestrial and freshwater
  • 116. ecosystems, including wetlands (medium confidence). A reduction in permafrost extent is virtually certain with continued rise in global temperatures. {2.4} Summary for Policymakers 17 SPM SPM 3. Future Pathways for Adaptation, Mitigation and Sustainable Development Adaptation and mitigation are complementary strategies for reducing and managing the risks of climate change. Substantial emissions reductions over the next few decades can reduce cli- mate risks in the 21st century and beyond, increase prospects for effective adaptation, reduce the costs and challenges of mitigation in the longer term and contribute to climate-resilient pathways for sustainable development. {3.2, 3.3, 3.4} SPM 3.1 Foundations of decision-making about climate change Effective decision-making to limit climate change and its effects can be informed by a wide range of analytical approaches for evaluating expected risks and benefits, recognizing the importance of governance, ethical dimensions, equity, value judgments, economic assess- ments and diverse perceptions and responses to risk and uncertainty. {3.1}
  • 117. Sustainable development and equity provide a basis for assessing climate policies. Limiting the effects of climate change is necessary to achieve sustainable development and equity, including poverty eradication. Countries’ past and future contri- butions to the accumulation of GHGs in the atmosphere are different, and countries also face varying challenges and circum- stances and have different capacities to address mitigation and adaptation. Mitigation and adaptation raise issues of equity, justice and fairness. Many of those most vulnerable to climate change have contributed and contribute little to GHG emis- sions. Delaying mitigation shifts burdens from the present to the future, and insufficient adaptation responses to emerging impacts are already eroding the basis for sustainable development. Comprehensive strategies in response to climate change that are consistent with sustainable development take into account the co-benefits, adverse side effects and risks that may arise from both adaptation and mitigation options. {3.1, 3.5, Box 3.4} The design of climate policy is influenced by how individuals and organizations perceive risks and uncertainties and take them into account. Methods of valuation from economic, social and ethical analysis are available to assist decision-making. These methods can take account of a wide range of possible impacts, including low-probability outcomes with large conse- quences. But they cannot identify a single best balance between mitigation, adaptation and residual climate impacts. {3.1} Climate change has the characteristics of a collective action problem at the global scale, because most GHGs accumulate over time and mix globally, and emissions by any agent (e.g., individual, community, company, country) affect other agents.
  • 118. Effective mitigation will not be achieved if individual agents advance their own interests independently. Cooperative responses, including international cooperation, are therefore required to effectively mitigate GHG emissions and address other climate change issues. The effectiveness of adaptation can be enhanced through complementary actions across levels, including international cooperation. The evidence suggests that outcomes seen as equitable can lead to more effective cooperation. {3.1} SPM 3.2 Climate change risks reduced by mitigation and adaptation Without additional mitigation efforts beyond those in place today, and even with adaptation, warming by the end of the 21st century will lead to high to very high risk of severe, wide- spread and irreversible impacts globally (high confidence). Mitigation involves some level of co-benefits and of risks due to adverse side effects, but these risks do not involve the same possibility of severe, widespread and irreversible impacts as risks from climate change, increasing the benefits from near-term mitigation efforts. {3.2, 3.4} Mitigation and adaptation are complementary approaches for reducing risks of climate change impacts over different time- scales (high confidence). Mitigation, in the near term and through the century, can substantially reduce climate change Summary for Policymakers
  • 119. 18 SPM impacts in the latter decades of the 21st century and beyond. Benefits from adaptation can already be realized in addressing current risks, and can be realized in the future for addressing emerging risks. {3.2, 4.5} Five Reasons For Concern (RFCs) aggregate climate change risks and illustrate the implications of warming and of adaptation limits for people, economies and ecosystems across sectors and regions. The five RFCs are associated with: (1) Unique and threatened systems, (2) Extreme weather events, (3) Distribution of impacts, (4) Global aggregate impacts, and (5) Large- scale singular events. In this report, the RFCs provide information relevant to Article 2 of UNFCCC. {Box 2.4} Without additional mitigation efforts beyond those in place today, and even with adaptation, warming by the end of the 21st century will lead to high to very high risk of severe, widespread and irreversible impacts globally (high confidence) (Figure SPM.10). In most scenarios without additional mitigation efforts (those with 2100 atmospheric concentrations Un iqu e & th rea ten
  • 123. (% r el at iv e to 2 01 0 le ve ls ) no change relative to 2010e m is si on in cr ea se em
  • 124. is si on re du ct io ns observed 2000s 1 2 3 4 5 0 Cumulative anthropogenic CO 2 emissions from 1870 (GtCO 2 ) 1000 2000 3000 4000 5000 6000 7000 8000
  • 126. p re -in du st ria l l ev el s) Undetectable Moderate High Very high Level of additional risk due to climate change (see Box 2.4) (a) Risks from climate change... (b) ...depend on cumulative CO 2 emissions... (c) …which in turn depend on annual GHG emissions over the next decades baselines
  • 127. 430–480 480–530 530–580 580–720 720–1000 baselines 430–480 480–530 530–580 580–720 720–1000 Figure SPM.10 | The relationship between risks from climate change, temperature change, cumulative carbon dioxide (CO2) emissions and changes in annual greenhouse gas (GHG) emissions by 2050. Limiting risks across Reasons For Concern (a) would imply a limit for cumulative emissions of CO2 (b) which would constrain annual GHG emissions over the next few decades (c). Panel a reproduces the five Reasons For Concern {Box 2.4}. Panel b links temperature changes to cumulative CO2 emissions (in GtCO2) from 1870. They are based on Coupled Model Intercomparison Project Phase 5 (CMIP5) simulations (pink plume) and on a simple climate model
  • 128. (median climate response in 2100), for the baselines and five mitigation scenario categories (six ellipses). Details are provided in Figure SPM.5. Panel c shows the relationship between the cumulative CO2 emissions (in GtCO2) of the scenario catego- ries and their associated change in annual GHG emissions by 2050, expressed in percentage change (in percent GtCO2-eq per year) relative to 2010. The ellipses correspond to the same scenario categories as in Panel b, and are built with a similar method (see details in Figure SPM.5). {Figure 3.1} Summary for Policymakers 19 SPM >1000 ppm CO2-eq), warming is more likely than not to exceed 4°C above pre-industrial levels by 2100 (Table SPM.1). The risks associated with temperatures at or above 4°C include substantial species extinction, global and regional food insecurity, consequential constraints on common human activities and limited potential for adaptation in some cases (high confidence). Some risks of climate change, such as risks to unique and threatened systems and risks associated with extreme weather events, are moderate to high at temperatures 1°C to 2°C above pre- industrial levels. {2.3, Figure 2.5, 3.2, 3.4, Box 2.4, Table SPM.1} Substantial cuts in GHG emissions over the next few decades can substantially reduce risks of climate change by limiting
  • 129. warming in the second half of the 21st century and beyond. Cumulative emissions of CO2 largely determine global mean surface warming by the late 21st century and beyond. Limiting risks across RFCs would imply a limit for cumulative emissions of CO2. Such a limit would require that global net emissions of CO2 eventually decrease to zero and would constrain annual emissions over the next few decades (Figure SPM.10) (high confidence). But some risks from climate damages are unavoid- able, even with mitigation and adaptation. {2.2.5, 3.2, 3.4} Mitigation involves some level of co-benefits and risks, but these risks do not involve the same possibility of severe, wide- spread and irreversible impacts as risks from climate change. Inertia in the economic and climate system and the possibility of irreversible impacts from climate change increase the benefits from near-term mitigation efforts (high confidence). Delays in additional mitigation or constraints on technological options increase the longer-term mitigation costs to hold climate change risks at a given level (Table SPM.2). {3.2, 3.4} SPM 3.3 Characteristics of adaptation pathways Adaptation can reduce the risks of climate change impacts, but there are limits to its effec- tiveness, especially with greater magnitudes and rates of climate change. Taking a longer- term perspective, in the context of sustainable development, increases the likelihood that more immediate adaptation actions will also enhance future options and preparedness. {3.3} Adaptation can contribute to the well-being of populations, the security of assets and the maintenance of ecosystem goods, functions and services now and in the future. Adaptation is place- and context-specific (high confidence). A first step
  • 130. towards adaptation to future climate change is reducing vulnerability and exposure to present climate variability (high confidence). Integration of adaptation into planning, including policy design, and decision-making can promote synergies with develop- ment and disaster risk reduction. Building adaptive capacity is crucial for effective selection and implementation of adapta- tion options (robust evidence, high agreement). {3.3} Adaptation planning and implementation can be enhanced through complementary actions across levels, from individuals to governments (high confidence). National governments can coordinate adaptation efforts of local and sub-national govern- ments, for example by protecting vulnerable groups, by supporting economic diversification and by providing information, policy and legal frameworks and financial support (robust evidence, high agreement). Local government and the private sector are increasingly recognized as critical to progress in adaptation, given their roles in scaling up adaptation of commu- nities, households and civil society and in managing risk information and financing (medium evidence, high agreement). {3.3} Adaptation planning and implementation at all levels of governance are contingent on societal values, objectives and risk perceptions (high confidence). Recognition of diverse interests, circumstances, social-cultural contexts and expectations can benefit decision-making processes. Indigenous, local and traditional knowledge systems and practices, including indigenous peoples’ holistic view of community and environment, are a major resource for adapting to climate change, but these have not been used consistently in existing adaptation efforts.
  • 131. Integrating such forms of knowledge with existing practices increases the effectiveness of adaptation. {3.3} Constraints can interact to impede adaptation planning and implementation (high confidence). Common constraints on implementation arise from the following: limited financial and human resources; limited integration or coordination of gov- ernance; uncertainties about projected impacts; different perceptions of risks; competing values; absence of key adapta- tion leaders and advocates; and limited tools to monitor adaptation effectiveness. Another constraint includes insufficient research, monitoring, and observation and the finance to maintain them. {3.3} Summary for Policymakers 20 SPM Greater rates and magnitude of climate change increase the likelihood of exceeding adaptation limits (high confidence). Limits to adaptation emerge from the interaction among climate change and biophysical and/or socio-economic constraints. Further, poor planning or implementation, overemphasizing short-term outcomes or failing to sufficiently anticipate conse- quences can result in maladaptation, increasing the vulnerability or exposure of the target group in the future or the vulner- ability of other people, places or sectors (medium evidence, high agreement). Underestimating the complexity of adaptation as a social process can create unrealistic expectations about achieving intended adaptation outcomes. {3.3}
  • 132. Significant co-benefits, synergies and trade-offs exist between mitigation and adaptation and among different adap- tation responses; interactions occur both within and across regions (very high confidence). Increasing efforts to mitigate and adapt to climate change imply an increasing complexity of interactions, particularly at the intersections among water, energy, land use and biodiversity, but tools to understand and manage these interactions remain limited. Examples of actions with co-benefits include (i) improved energy efficiency and cleaner energy sources, leading to reduced emissions of health-damaging, climate-altering air pollutants; (ii) reduced energy and water consumption in urban areas through greening cities and recycling water; (iii) sustainable agriculture and forestry; and (iv) protection of ecosystems for carbon storage and other ecosystem services. {3.3} Transformations in economic, social, technological and political decisions and actions can enhance adaptation and promote sustainable development (high confidence). At the national level, transformation is considered most effective when it reflects a country’s own visions and approaches to achieving sustainable development in accordance with its national circumstances and priorities. Restricting adaptation responses to incremental changes to existing systems and structures, without consider- ing transformational change, may increase costs and losses and miss opportunities. Planning and implementation of trans- formational adaptation could reflect strengthened, altered or aligned paradigms and may place new and increased demands on governance structures to reconcile different goals and visions for the future and to address possible equity and ethical implications. Adaptation pathways are enhanced by iterative learning, deliberative processes and innovation. {3.3}
  • 133. SPM 3.4 Characteristics of mitigation pathways There are multiple mitigation pathways that are likely to limit warming to below 2°C relative to pre-industrial levels. These pathways would require substantial emissions reductions over the next few decades and near zero emissions of CO2 and other long-lived greenhouse gases by the end of the century. Implementing such reductions poses substantial technological, eco- nomic, social and institutional challenges, which increase with delays in additional mitigation and if key technologies are not available. Limiting warming to lower or higher levels involves similar challenges but on different timescales. {3.4} Without additional efforts to reduce GHG emissions beyond those in place today, global emissions growth is expected to persist, driven by growth in global population and economic activities. Global mean surface temperature increases in 2100 in baseline scenarios—those without additional mitigation— range from 3.7°C to 4.8°C above the average for 1850–1900 for a median climate response. They range from 2.5°C to 7.8°C when including climate uncertainty (5th to 95th percentile range) (high confidence). {3.4}14 Emissions scenarios leading to CO2-equivalent concentrations in 2100 of about 450 ppm or lower are likely to maintain warming below 2°C over the 21st century relative to pre- industrial levels15. These scenarios are characterized by 40 to 70% global anthropogenic GHG emissions reductions by 2050 compared to 201016, and emissions levels near zero or below in 2100. Mitigation scenarios reaching concentration levels of about 500 ppm CO2-eq by 2100 are more likely than not to limit
  • 134. temperature change to less than 2°C, unless they temporarily overshoot concentration levels of roughly 530 ppm CO2-eq 15 For comparison, the CO2-eq concentration in 2011 is estimated to be 430 ppm (uncertainty range 340 to 520 ppm) 16 This range differs from the range provided for a similar concentration category in the AR4 (50 to 85% lower than 2000 for CO2 only). Reasons for this difference include that this report has assessed a substantially larger number of scenarios than in the AR4 and looks at all GHGs. In addition, a large proportion of the new scenarios include Carbon Dioxide Removal (CDR) technologies (see below). Other factors include the use of 2100 concentration levels instead of stabilization levels and the shift in reference year from 2000 to 2010. Summary for Policymakers 21 SPM before 2100, in which case they are about as likely as not to achieve that goal. In these 500 ppm CO2-eq scenarios, global 2050 emissions levels are 25 to 55% lower than in 2010. Scenarios with higher emissions in 2050 are characterized by a greater reliance on Carbon Dioxide Removal (CDR) technologies beyond mid-century (and vice versa). Trajectories that are likely to
  • 135. limit warming to 3°C relative to pre-industrial levels reduce emissions less rapidly than those limiting warming to 2°C. A lim- ited number of studies provide scenarios that are more likely than not to limit warming to 1.5°C by 2100; these scenarios are characterized by concentrations below 430 ppm CO2-eq by 2100 and 2050 emission reduction between 70% and 95% below 2010. For a comprehensive overview of the characteristics of emissions scenarios, their CO2-equivalent concentrations and their likelihood to keep warming to below a range of temperature levels, see Figure SPM.11 and Table SPM.1. {3.4} 21002000 2020 2040 2060 2080 2100 –20 0 20 40 60 80 100 120 140 B as el in
  • 136. e RCP8.5 RCP6.0 RCP4.5 RCP2.6 Associated upscaling of low-carbon energy supply 0 20 40 60 80 100 2030 2050 2100 2030 2050 2100 2030 2050 2100 2030 2050 2100 Lo w -c ar bo n
  • 139. ppm CO 2 -eq ppm CO 2 -eq ppm CO 2 -eq ppm CO 2 -eq GHG emission pathways 2000–2100: All AR5 scenarios 90th Percentile Median 10th Percentile Min 75th Max Median 25th Percentile + 18
  • 141. 2010 580–720 ppm CO 2 -eq 530–580 ppm CO 2 -eq 480–530 ppm CO 2 -eq 430–480 ppm CO 2 -eq (a) (b) Figure SPM.11 | Global greenhouse gas emissions (gigatonne of CO2-equivalent per year, GtCO2-eq/yr) in baseline and mitigation scenarios for different long-term concentration levels (a) and associated upscaling requirements of low-carbon energy (% of primary energy) for 2030, 2050 and 2100 compared to 2010 levels in mitigation scenarios (b). {Figure 3.2} Summary for Policymakers 22 SPM
  • 142. Table SPM.1 | Key characteristics of the scenarios collected and assessed for WGIII AR5. For all parameters the 10th to 90th percentile of the scenarios is shown a. {Table 3.1} CO2-eq Con- centrations in 2100 (ppm CO2-eq) f Category label (conc. range) Subcategories Relative position of the RCPs d Change in CO2-eq emissions compared to 2010 (in %) c Likelihood of staying below a specific temperature level over the 21st cen- tury (relative to 1850–1900) d, e 2050 2100 1.5ºC 2ºC 3ºC 4ºC <430 Only a limited number of individual model studies have explored levels below 430 ppm CO2-eq j
  • 143. 450 (430 to 480) Total range a, g RCP2.6 –72 to –41 –118 to –78 More unlikely than likely Likely Likely Likely 500 (480 to 530) No overshoot of 530 ppm CO2-eq –57 to –42 –107 to –73 Unlikely More likely than not Overshoot of 530 ppm CO2-eq –55 to –25 –114 to –90 About as likely as not 550 (530 to 580)
  • 144. No overshoot of 580 ppm CO2-eq –47 to –19 –81 to –59 More unlikely than likely iOvershoot of 580 ppm CO2-eq –16 to 7 –183 to –86 (580 to 650) Total range RCP4.5 –38 to 24 –134 to –50 (650 to 720) Total range –11 to 17 –54 to –21 Unlikely More likely than not (720 to 1000) b Total range RCP6.0 18 to 54 –7 to 72 Unlikely h More unlikely than likely >1000 b Total range RCP8.5 52 to 95 74 to 178 Unlikely h Unlikely More unlikely than likely
  • 145. Notes: a The ‘total range’ for the 430 to 480 ppm CO2-eq concentrations scenarios corresponds to the range of the 10th to 90th percentile of the subcategory of these scenarios shown in Table 6.3 of the Working Group III Report. b Baseline scenarios fall into the >1000 and 720 to 1000 ppm CO2-eq categories. The latter category also includes mitigation scenarios. The baseline sce- narios in the latter category reach a temperature change of 2.5°C to 5.8°C above the average for 1850–1900 in 2100. Together with the baseline scenarios in the >1000 ppm CO2-eq category, this leads to an overall 2100 temperature range of 2.5°C to 7.8°C (range based on median climate response: 3.7°C to 4.8°C) for baseline scenarios across both concentration categories. c The global 2010 emissions are 31% above the 1990 emissions (consistent with the historic greenhouse gas emission estimates presented in this report). CO2-eq emissions include the basket of Kyoto gases (carbon dioxide (CO2), methane (CH4), nitrous oxide (N2O) as well as fluorinated gases). d The assessment here involves a large number of scenarios published in the scientific literature and is thus not limited to the Representative Concentration Pathways (RCPs). To evaluate the CO2-eq concentration and climate implications of these scenarios, the Model for the Assessment of Greenhouse Gas Induced Climate Change (MAGICC) was used in a probabilistic mode. For a comparison between MAGICC model results and the outcomes of the models used in WGI, see WGI 12.4.1.2, 12.4.8 and WGIII 6.3.2.6. e The assessment in this table is based on the probabilities calculated for the full ensemble of scenarios in WGIII AR5
  • 146. using MAGICC and the assessment in WGI of the uncertainty of the temperature projections not covered by climate models. The statements are therefore consistent with the statements in WGI, which are based on the Coupled Model Intercomparison Project Phase 5 (CMIP5) runs of the RCPs and the assessed uncertainties. Hence, the likelihood statements reflect different lines of evidence from both WGs. This WGI method was also applied for scenarios with intermediate concentration levels where no CMIP5 runs are available. The likelihood statements are indicative only {WGIII 6.3} and follow broadly the terms used by the WGI SPM for temperature projections: likely 66–100%, more likely than not >50–100%, about as likely as not 33–66%, and unlikely 0–33%. In addition the term more unlikely than likely 0–<50% is used. f The CO2-equivalent concentration (see Glossary) is calculated on the basis of the total forcing from a simple carbon cycle/climate model, MAGICC. The CO2- equivalent concentration in 2011 is estimated to be 430 ppm (uncertainty range 340 to 520 ppm). This is based on the assessment of total anthropogenic radiative forcing for 2011 relative to 1750 in WGI, i.e., 2.3 W/m2, uncertainty range 1.1 to 3.3 W/m2. g The vast majority of scenarios in this category overshoot the category boundary of 480 ppm CO2-eq concentration. h For scenarios in this category, no CMIP5 run or MAGICC realization stays below the respective temperature level. Still, an unlikely assignment is given to reflect uncertainties that may not be reflected by the current climate models. i Scenarios in the 580 to 650 ppm CO2-eq category include both overshoot scenarios and scenarios that do not exceed the concentration level at the high end of the category (e.g., RCP4.5). The latter type of scenarios,
  • 147. in general, have an assessed probability of more unlikely than likely to stay below the 2°C temperature level, while the former are mostly assessed to have an unlikely probability of staying below this level. j In these scenarios, global CO2-eq emissions in 2050 are between 70 to 95% below 2010 emissions, and they are between 110 to 120% below 2010 emissions in 2100. Summary for Policymakers 23 SPM Mitigation scenarios reaching about 450 ppm CO2-eq in 2100 (consistent with a likely chance to keep warming below 2°C relative to pre-industrial levels) typically involve temporary overshoot17 of atmospheric concentrations, as do many scenarios reaching about 500 ppm CO2-eq to about 550 ppm CO2-eq in 2100 (Table SPM.1). Depending on the level of overshoot, overshoot scenarios typically rely on the availability and widespread deployment of bioenergy with carbon dioxide capture and storage (BECCS) and afforestation in the second half of the century. The availability and scale of these and other CDR technologies and methods are uncertain and CDR technologies are, to varying degrees, associated with challenges and risks18. CDR is also prevalent in many scenarios without overshoot to compensate for residual emissions from sectors where mitigation is more expensive (high confidence). {3.4, Box 3.3}
  • 148. Reducing emissions of non-CO2 agents can be an important element of mitigation strategies. All current GHG emissions and other forcing agents affect the rate and magnitude of climate change over the next few decades, although long-term warming is mainly driven by CO2 emissions. Emissions of non- CO2 forcers are often expressed as ‘CO2-equivalent emissions’, but the choice of metric to calculate these emissions, and the implications for the emphasis and timing of abatement of the various climate forcers, depends on application and policy context and contains value judgments. {3.4, Box 3.2} 17 In concentration ‘overshoot’ scenarios, concentrations peak during the century and then decline. 18 CDR methods have biogeochemical and technological limitations to their potential on the global scale. There is insufficient knowledge to quantify how much CO2 emissions could be partially offset by CDR on a century timescale. CDR methods may carry side effects and long-term consequences on a global scale. Before 2030 After 2030 –12 –9 –6 –3 0 3
  • 149. 6 Past 1900–2010 2000–2010 AR5 scenario range Interquartile range and median of model comparisons with 2030 targets Cancún Pledges <50 GtCO 2 -eq Annual GHG emissions in 2030 >55 GtCO 2 -eq Future 2030–2050 0 + 90 % +
  • 150. 24 0% 2010 (G tC O 2- eq /y r) Year (% /y r) (% ) Annual GHG emissions Rate of CO 2 emissions change Share of zero and low-carbon energy 2005 2010 2015 2020 2025 2030 20 25
  • 151. 30 35 40 45 50 55 60 2030 2030 2050 2100 2100 2050 20 40 60 80 100 Figure SPM.12 | The implications of different 2030 greenhouse gas (GHG) emissions levels for the rate of carbon dioxide (CO2) emissions reductions and low-carbon energy upscaling in mitigation scenarios that are at least about as likely as not to keep warming throughout the 21st century below 2°C relative to pre-industrial levels (2100 CO2-equivalent concentrations of 430 to 530 ppm). The scenarios are grouped according to different emissions levels
  • 152. by 2030 (coloured in different shades of green). The left panel shows the pathways of GHG emissions (gigatonne of CO2- equivalent per year, GtCO2-eq/ yr) leading to these 2030 levels. The black dot with whiskers gives historic GHG emission levels and associated uncertainties in 2010 as reported in Figure SPM.2. The black bar shows the estimated uncertainty range of GHG emissions implied by the Cancún Pledges. The middle panel denotes the average annual CO2 emissions reduction rates for the period 2030–2050. It compares the median and interquartile range across scenarios from recent inter-model comparisons with explicit 2030 interim goals to the range of scenarios in the Scenario Database for WGIII AR5. Annual rates of historical emissions change (sustained over a period of 20 years) and the average annual CO2 emission change between 2000 and 2010 are shown as well. The arrows in the right panel show the magnitude of zero and low-carbon energy supply upscaling from 2030 to 2050 subject to different 2030 GHG emissions levels. Zero- and low-carbon energy supply includes renewables, nuclear energy and fossil energy with carbon dioxide capture and storage (CCS) or bioenergy with CCS (BECCS). [Note: Only scenarios that apply the full, unconstrained mitigation technology portfolio of the underlying models (default technology assumption) are shown. Scenarios with large net negative global emissions (>20 GtCO2-eq/yr), scenarios with exogenous carbon price assumptions and scenarios with 2010 emissions significantly outside the historical range are excluded.] {Figure 3.3} Summary for Policymakers
  • 153. 24 SPM Delaying additional mitigation to 2030 will substantially increase the challenges associated with limiting warming over the 21st century to below 2°C relative to pre-industrial levels. It will require substantially higher rates of emissions reductions from 2030 to 2050; a much more rapid scale-up of low-carbon energy over this period; a larger reliance on CDR in the long term; and higher transitional and long-term economic impacts. Estimated global emissions levels in 2020 based on the Cancún Pledges are not consistent with cost-effective mitigation trajectories that are at least about as likely as not to limit warming to below 2°C relative to pre-industrial levels, but they do not preclude the option to meet this goal (high confidence) (Figure SPM.12, Table SPM.2). {3.4} Estimates of the aggregate economic costs of mitigation vary widely depending on methodologies and assumptions, but increase with the stringency of mitigation. Scenarios in which all countries of the world begin mitigation immediately, in which there is a single global carbon price, and in which all key technologies are available have been used as a cost-effective benchmark for estimating macro-economic mitigation costs (Figure SPM.13). Under these assumptions mitigation scenarios that are likely to limit warming to below 2°C through the 21st century relative to pre-industrial levels entail losses in global consumption—not including benefits of reduced climate change as well as co-benefits and adverse side effects of mitiga- tion—of 1 to 4% (median: 1.7%) in 2030, 2 to 6% (median: 3.4%) in 2050 and 3 to 11% (median: 4.8%) in 2100 relative to consumption in baseline scenarios that grows anywhere from 300% to more than 900% over the century (Figure SPM.13).
  • 154. These numbers correspond to an annualized reduction of consumption growth by 0.04 to 0.14 (median: 0.06) percentage points over the century relative to annualized consumption growth in the baseline that is between 1.6 and 3% per year (high confidence). {3.4} In the absence or under limited availability of mitigation technologies (such as bioenergy, CCS and their combination BECCS, nuclear, wind/solar), mitigation costs can increase substantially depending on the technology considered. Delaying additional mitigation increases mitigation costs in the medium to long term. Many models could not limit likely warming to below 2°C over the 21st century relative to pre-industrial levels if additional mitigation is considerably delayed. Many models could not limit likely warming to below 2°C if bioenergy, CCS and their combination (BECCS) are limited (high confidence) (Table SPM.2). {3.4} 0 2 4 6 8 10 12 0
  • 156. b as el in e (% ) Global mitigation costs and consumption growth in baseline scenarios C on su m pt io n in c or re sp on di ng
  • 158. -eq) 450 (430–480) 0.06 (0.04 to 0.14) 500 (480–530) 0.06 (0.03 to 0.13) 550 (530–580) 0.04 (0.01 to 0.09) 580–650 0.03 (0.01 to 0.05) Percentage point reduction in annualized consumption growth rate over 21st century (%-point) 84th Percentile Median 16th Percentile Corresponding baseline scenarios 20 30
  • 159. 20 50 20 30 20 50 21 00 21 00 Figure SPM.13 | Global mitigation costs in cost-effective scenarios at different atmospheric concentrations levels in 2100. Cost-effective scenarios assume immediate mitigation in all countries and a single global carbon price, and impose no additional limitations on technology relative to the models’ default technology assumptions. Consumption losses are shown relative to a baseline development without climate policy (left panel). The table at the top shows percentage points of annualized consumption growth reductions relative to consumption growth in the baseline of 1.6 to 3% per year (e.g., if the reduction is 0.06 percentage points per year due to mitigation, and baseline growth is 2.0% per year, then the growth rate with mitigation would be 1.94% per year). Cost estimates shown in this table do not consider the
  • 160. benefits of reduced climate change or co-benefits and adverse side effects of mitigation. Estimates at the high end of these cost ranges are from models that are relatively inflexible to achieve the deep emissions reductions required in the long run to meet these goals and/or include assumptions about market imperfections that would raise costs. {Figure 3.4} Summary for Policymakers 25 SPM Mitigation scenarios reaching about 450 or 500 ppm CO2-eq by 2100 show reduced costs for achieving air quality and energy security objectives, with significant co-benefits for human health, ecosystem impacts and sufficiency of resources and resilience of the energy system. {4.4.2.2} Mitigation policy could devalue fossil fuel assets and reduce revenues for fossil fuel exporters, but differences between regions and fuels exist (high confidence). Most mitigation scenarios are associated with reduced revenues from coal and oil trade for major exporters (high confidence). The availability of CCS would reduce the adverse effects of mitigation on the value of fossil fuel assets (medium confidence). {4.4.2.2} Solar Radiation Management (SRM) involves large-scale methods that seek to reduce the amount of absorbed solar energy
  • 161. in the climate system. SRM is untested and is not included in any of the mitigation scenarios. If it were deployed, SRM would Table SPM.2 | Increase in global mitigation costs due to either limited availability of specific technologies or delays in additional mitigation a relative to cost-effective scenarios b. The increase in costs is given for the median estimate and the 16th to 84th percentile range of the scenarios (in parentheses) c. In addition, the sample size of each scenario set is provided in the coloured symbols. The colours of the symbols indicate the fraction of models from systematic model comparison exercises that could successfully reach the targeted concentration level. {Table 3.2} Mitigation cost increases in scenarios with limited availability of technologies d [% increase in total discounted e mitigation costs (2015–2100) relative to default technology assumptions] Mitigation cost increases due to delayed additional mitigation until 2030 [% increase in mitigation costs relative to immediate mitigation] 2100 concentrations (ppm CO2-eq) no CCS nuclear phase out limited solar/wind limited bioenergy medium term costs
  • 162. (2030–2050) long term costs (2050–2100) 450 (430 to 480) 138% (29 to 297%) 7% (4 to 18%) 6% (2 to 29%) 64% (44 to 78%) } 44% (2 to 78%) 37% (16 to 82%) 500 (480 to 530) not available (n.a.) n.a. n.a. n.a.
  • 163. 550 (530 to 580) 39% (18 to 78%) 13% (2 to 23%) 8% (5 to 15%) 18% (4 to 66%) } 15% (3 to 32%) 16% (5 to 24%) 580 to 650 n.a. n.a. n.a. n.a. Symbol legend—fraction of models successful in producing scenarios (numbers indicate the number of successful models) : all models successful : between 80 and 100% of models successful : between 50 and 80% of models successful
  • 164. : less than 50% of models successful Notes: a Delayed mitigation scenarios are associated with greenhouse gas emission of more than 55 GtCO2-eq in 2030, and the increase in mitigation costs is mea- sured relative to cost-effective mitigation scenarios for the same long-term concentration level. b Cost-effective scenarios assume immediate mitigation in all countries and a single global carbon price, and impose no additional limitations on technology relative to the models’ default technology assumptions. c The range is determined by the central scenarios encompassing the 16th to 84th percentile range of the scenario set. Only scenarios with a time horizon until 2100 are included. Some models that are included in the cost ranges for concentration levels above 530 ppm CO2-eq in 2100 could not produce associ- ated scenarios for concentration levels below 530 ppm CO2-eq in 2100 with assumptions about limited availability of technologies and/or delayed additional mitigation. d No CCS: carbon dioxide capture and storage is not included in these scenarios. Nuclear phase out: no addition of nuclear power plants beyond those under construction, and operation of existing plants until the end of their lifetime. Limited Solar/Wind: a maximum of 20% global electricity generation from solar and wind power in any year of these scenarios. Limited Bioenergy: a maximum of 100 EJ/yr modern bioenergy supply globally (modern bioenergy used for heat, power, combinations and industry was around 18 EJ/yr in 2008). EJ = Exajoule = 1018 Joule. e Percentage increase of net present value of consumption losses in percent of baseline consumption (for scenarios from
  • 165. general equilibrium models) and abatement costs in percent of baseline gross domestic product (GDP, for scenarios from partial equilibrium models) for the period 2015–2100, discounted at 5% per year. Summary for Policymakers 26 SPM entail numerous uncertainties, side effects, risks and shortcomings and has particular governance and ethical implications. SRM would not reduce ocean acidification. If it were terminated, there is high confidence that surface temperatures would rise very rapidly impacting ecosystems susceptible to rapid rates of change. {Box 3.3} SPM 4. Adaptation and Mitigation Many adaptation and mitigation options can help address climate change, but no single option is sufficient by itself. Effective implementation depends on policies and cooperation at all scales and can be enhanced through integrated responses that link adaptation and mitiga- tion with other societal objectives. {4} SPM 4.1 Common enabling factors and constraints for adaptation and mitigation responses
  • 166. Adaptation and mitigation responses are underpinned by common enabling factors. These include effective institutions and governance, innovation and investments in environmentally sound technologies and infrastructure, sustainable livelihoods and behavioural and lifestyle choices. {4.1} Inertia in many aspects of the socio-economic system constrains adaptation and mitigation options (medium evidence, high agreement). Innovation and investments in environmentally sound infrastructure and technologies can reduce GHG emis- sions and enhance resilience to climate change (very high confidence). {4.1} Vulnerability to climate change, GHG emissions and the capacity for adaptation and mitigation are strongly influenced by livelihoods, lifestyles, behaviour and culture (medium evidence, medium agreement). Also, the social acceptability and/or effectiveness of climate policies are influenced by the extent to which they incentivize or depend on regionally appropriate changes in lifestyles or behaviours. {4.1} For many regions and sectors, enhanced capacities to mitigate and adapt are part of the foundation essential for managing climate change risks (high confidence). Improving institutions as well as coordination and cooperation in governance can help overcome regional constraints associated with mitigation, adaptation and disaster risk reduction (very high confidence). {4.1} SPM 4.2 Response options for adaptation Adaptation options exist in all sectors, but their context for implementation and potential to
  • 167. reduce climate-related risks differs across sectors and regions. Some adaptation responses involve significant co-benefits, synergies and trade-offs. Increasing climate change will increase challenges for many adaptation options. {4.2} Adaptation experience is accumulating across regions in the public and private sectors and within communities. There is increasing recognition of the value of social (including local and indigenous), institutional, and ecosystem-based measures and of the extent of constraints to adaptation. Adaptation is becoming embedded in some planning processes, with more limited implementation of responses (high confidence). {1.6, 4.2, 4.4.2.1} The need for adaptation along with associated challenges is expected to increase with climate change (very high confidence). Adaptation options exist in all sectors and regions, with diverse potential and approaches depending on their context in vulnerability reduction, disaster risk management or proactive adaptation planning (Table SPM.3). Effective strategies and actions consider the potential for co-benefits and opportunities within wider strategic goals and development plans. {4.2} Summary for Policymakers 27 SPM Table SPM.3 | Approaches for managing the risks of climate change through adaptation. These approaches should be considered overlapping rather than
  • 168. discrete, and they are often pursued simultaneously. Examples are presented in no specific order and can be relevant to more than one category. {Table 4.2} V u ln er ab il it y & E xp o su re R ed u ct io n t hr
  • 172. al a d ju st m en ts Tr an sf o rm at io n Overlapping Approaches Category Examples Human development Improved access to education, nutrition, health facilities, energy, safe housing & settlement structures, & social support structures; Reduced gender inequality & marginalization in other forms.
  • 173. Poverty alleviation Improved access to & control of local resources; Land tenure; Disaster risk reduction; Social safety nets & social protection; Insurance schemes. Livelihood security Income, asset & livelihood diversification; Improved infrastructure; Access to technology & decision- making fora; Increased decision-making power; Changed cropping, livestock & aquaculture practices; Reliance on social networks. Disaster risk management Early warning systems; Hazard & vulnerability mapping; Diversifying water resources; Improved drainage; Flood & cyclone shelters; Building codes & practices; Storm & wastewater management; Transport & road infrastructure improvements. Ecosystem management Maintaining wetlands & urban green spaces; Coastal afforestation; Watershed & reservoir management; Reduction of other stressors on ecosystems & of habitat fragmentation; Maintenance of genetic diversity; Manipulation of disturbance regimes; Community-based natural resource management. Spatial or land-use planning
  • 174. Provisioning of adequate housing, infrastructure & services; Managing development in flood prone & other high risk areas; Urban planning & upgrading programs; Land zoning laws; Easements; Protected areas. Structural/physical Engineered & built-environment options: Sea walls & coastal protection structures; Flood levees; Water storage; Improved drainage; Flood & cyclone shelters; Building codes & practices; Storm & wastewater management; Transport & road infrastructure improvements; Floating houses; Power plant & electricity grid adjustments. Technological options: New crop & animal varieties; Indigenous, traditional & local knowledge, technologies & methods; Efficient irrigation; Water-saving technologies; Desalinisation; Conservation agriculture; Food storage & preservation facilities; Hazard & vulnerability mapping & monitoring; Early warning systems; Building insulation; Mechanical & passive cooling; Technology development, transfer & diffusion. Ecosystem-based options: Ecological restoration; Soil conservation; Afforestation & reforestation; Mangrove conservation & replanting; Green infrastructure (e.g., shade trees, green roofs); Controlling overfishing; Fisheries co-management; Assisted species migration & dispersal; Ecological corridors; Seed banks, gene banks & other ex situ conservation; Community-based natural resource management. Services: Social safety nets & social protection; Food banks &