
Recommended
Recommended
More Related Content
Similar to The Effects of a 2-Year PhysicalEducation Program (SPARK)o.docx
Similar to The Effects of a 2-Year PhysicalEducation Program (SPARK)o.docx (20)
More from todd701
More from todd701 (20)
Recently uploaded
Recently uploaded (20)
The Effects of a 2-Year PhysicalEducation Program (SPARK)o.docx
- 1. The Effects of a 2-Year Physical Education Program (SPARK) on Physical Activity and Fitness in Elementary School Students James F Sallis, PhD, Thomas L McKenzie, PhD, John E. Alcaraz, PhD, Bohdan Kolody, PhD, Nell Faucette, PhD, and Melbourne E Hovell, PhD, MPH Introduction Regular physical activity during childhood and adolescence is associated with improvements in numerous physi- ological and psychological variables.",2 School physical education is the primary societal institution with the responsibility for promoting physical activity in youth, and 97% of elementary school students take physical education.3 However, there is evidence that physical education is not adequately filling this role.4 Observations revealed that physical education special- ists provided students with only 3 minutes of moderate to vigorous physical activity per physical education class; that is less than 10% of class time.5'6 This is far below the national objective that children should be active at least 50% of physical education class time.7 Well-designed physical education programs have pro-
- 2. duced significant health benefits,8-'3 so further development and evaluation of health-related physical education pro- grams are needed. For public health benefit, physical education should promote generalization of physical activity outside of school, because physical activity recommenda- tions cannot be met through physical education alone.4 Physical education8"3 and classroom programs'0"4 may increase physical activity throughout the day, but specific programs to promote generaliza- tion must be developed and rigorously evaluated. This paper reports the primary out- comes of 2 years of a health-related elementary physical education program on children's physical activity during physical education and physical activity out of school. Increased physical activity is expected to lead to improvements in health-related physical fitness. 'The program is titled Sports, Play, and Active Recreation for Kids (SPARK). Methods Experimental Design Seven elementary schools were as- signed to one of three conditions. In the specialist-led condition, certified physical education specialists implemented the
- 3. programs. In the teacher-led condition, classroom teachers were trained to imple- ment the intervention because they are responsible for teaching physical educa- tion in most elementary schools.4 The third condition was control, or usual physical education, as implemented by untrained classroom teachers. Two consecutive cohorts of students entered the study as fourth graders, and students participated in their respective experimental conditions in the fourth and fifth grades. Self-report and fitness mea- sures were collected near the beginning and end of each school year. Selection ofSchools The study was conducted in Poway, Calif, a suburb of San Diego. Principals of 12 of the 16 elementary schools in the district were willing to participate in the James F. Sallis is with the Department of Psychology; Thomas L. McKenzie is with the Department of Exercise and Nutritional Sciences; John E. Alcaraz and Melbourne F. Hovell are with the Graduate School of Public Health; and Bohdan Kolody is with the Department of Sociology, all of San Diego State University, California. Nell Faucette is with the School of Physical Education, Wellness, and Sport Studies, University of South Florida, Tampa. Requests for reprints should be sent to
- 4. James F. Sallis, PhD, Department of Psychology, San Diego State University, 6363 Alvarado Court, #103, San Diego, CA 92120. This paper was accepted October 1, 1996. August 1997, Vol. 87, No. 8 Effects ofPhysical Education study and agreed to be randomly assigned to condition. Because of resource limita- tions, the 7 smallest schools were se- lected, and they were stratified into two groups by the percentage of minority students. Four schools, ranging from 17% to 19% minority, formed one stratum; 3 schools, ranging from 8% to 13% minor- ity, formed the other. Within each stratum, 1 school was randomly assigned to each of the three experimental conditions. To guard against loss of control schools, the remaining school was assigned to the control condition. All schools completed the study. Subjects Approximately 98% of the fourth- grade children during 2 years of recruit- ment (1990 and 1991) obtained written parental consent in all three conditions. At baseline, 1538 students completed sur- veys and were considered subjects. The
- 5. ethnic distribution of subjects was similar to that of the community'5: 82% European American, 12% Asian/Pacific Islander, 4% Latino, 2% African American. Fifty- three percent were male, and there were no differences in sex or ethnic distribution by condition. There was a significant difference in age by condition (P < .01), but the range of means was only 9.49 to 9.62 years. The sample for present analyses consisted of students with complete or nearly complete data for the survey, fitness measures, and physical activity monitor. Retention was defined as com- pleting the baseline (fall, fourth grade) and final (spring, fifth grade) surveys and fitness tests. Retained students had to have at least one valid accelerometer measure in both the fourth and fifth grades. Of students with baseline surveys, 78.4% had complete survey data; 73.4% had com- plete fitness data; and 66.0% had com- plete data on the weekday accelerometer measure. Of students with baseline sur- veys, 62.1% (n = 955) met criteria for inclusion. There were 264 students in specialist-led, 331 in teacher-led, and 360 in control conditions. There were no differences in reten- tion rates by experimental condition. Analyses were conducted to determine whether attrition rates varied by demo- graphic variables. There was no difference
- 6. in sex distribution between retained stu- dents and dropouts (P < .90). Although there was a significant difference in age (P < .01), retained students were only 0.1 year older than dropouts. Minority stu- dents were more likely to be retained in the study than European Americans (P < .05). Intervention Components Physical educationprogram SPARK physical education classes were designed to promote high levels ofphysical activity, teach movement skills, and be enjoyable. Recommended frequency ofphysical edu- cation classes was 3 days a week. A typical SPARK lesson lasted 30 minutes and had two parts: health-fitness activities (15 minutes) and skill-fitness activities (15 minutes). Ten health-related activity units in- cluded aerobic dance, aerobic games, walking/jogging, and jump rope. Progres- sion was developed by modifying the intensity, duration, and complexity of the activities. Although the main focus was on developing cardiovascular endurance, brief activities to develop abdominal and upper body strength were included. To enhance motivation, students self-assessed and recorded their own fitness levels monthly. Nine sport units that developed
- 7. skill-related fitness included basketball and soccer. These sports and games had the potential for promoting cardiovascular fitness and generalizing to the child's community (e.g., Frisbee games). Low- activity games, such as softball, were modified to make them more active. Self-managementprogram. The self- management program taught behavior- change skills'6 to help children generalize regular physical activity outside of school. Self-management was taught in weekly 30-minute classroom sessions, and skills included self-monitoring, goal setting, stimulus control, self-reinforcement, self- instruction, and problem solving. The sessions were guided by scripted fourth- and fifth-grade curricula. Each session included a review of the previous week's goals, introduction of a new skill or topic, and goal setting for the next week. Homework and monthly newsletters were intended to stimulate parent-child interaction and support for physical activ- ity. During the first part of each school year, students were awarded prizes (e.g., pencils, sports water bottles) for meeting weekly activity goals. Extrinsic rewards were phased out as students learned to use self-reward. Experimental Conditions Physical education specialist-led
- 8. condition. Three certified physical educa- tion specialists taught physical education and self-management while receiving ongoing taining and supervision from the investigators. The quality of teaching was monitored and enhanced by feedback based on videotapes of physical education and self-management classes. Trained classroom teacher-led con- dition. Training was designed to familiar- ize classroom teachers with the curricula and develop class-management and in- structional skills so that teachers could implement the physical education and self-management programs effectively. During each taining session, teachers participated in the activities and were assisted in planning a personal program of regular physical activity. The first year of training was exten- sive (32 hours over seven sessions) but decreased in subsequent years. Twenty- eight teachers participated in staffdevelop- ment, and attendance was 97%. Substitute teachers were provided to allow class- room teachers to attend training during the school day. About 70% of the time was allocated to physical education and 30% to self-management. A mean satisfaction score of 4.83 on a 5-point scale indicated that teachers evaluated the sessions posi- tively.
- 9. Follow-up support was provided during each teacher's physical education classes. A physical education specialist provided feedback, encouragement, and direct assistance during visits that ranged in frequency from biweekly to bimonthly. Control condition. Principals of con- trol schools were asked to continue with usual physical education programs during the study. All schools, including control schools, were provided with sufficient physical education equipment to carry out the SPARK program. Measures Self-reported physical activity. Out- of-school physical activity was assessed with a 1-day recall in a checklist format, which had previously been validated.'7 Children reported participation in 20 activities, and a summary score was based on the intensity weightings of each activity. Accelerometer The Caltrac acceler- ometer (Hemokinetics, Inc, Madison, Wis- consin) is a small electronic instrument that gives a practical objective measure of physical activity. Validity with children has been supported by field and laboratory studies.'8 Out-of-school physical activity was monitored 1 weekday per semester and 1
- 10. weekend per school year. It was not possible to gather a pre-intervention base- American Joumal of Public Health 1329August 1997, Vol. 87, No. 8 Sallis et al. line measure. For weekday measures, 82% were returned with valid data. Frequent reasons for missing data were absence from school (5% of attempts) and forgetting the accelerometer (6% of at- tempts). Data are presented as "activity counts per hour worn." Fitness and anthropometric mea- sures. Adaptations of the FHTFNESS- GRAM protocols'9 were used to measure health-related physical fitness.20 Cardio- vascular endurance was measured with the mile-run test. The number of bent- knee sit-ups in 60 seconds was an indicator of muscular strength and endur- ance. The number of pull-ups was an indicator of upper body strength. The sit-and-reach test was a measure of hamstring flexibility. Height and weight were measured in stocking feet. Calf and triceps skinfolds were assessed three times using calibrated Lange calipers. The interobserver agree- ment (intraclass correlations) were .87 for
- 11. triceps skinfold and .93 for calf skinfold (n = 47). Observations of physical education classes. Implementation of the school physical education program was assessed by direct observation by means of the previously validated SOFIT instrument (System for Observing Fitness Instruction Time).2' Four randomly chosen children were observed every 20 seconds during rotating 4-minute blocks throughout the class. Activity codes 1 through 4 de- scribed the body position of the student (lying down, sitting, standing, waLking), and code 5 (very active) identified when the student was expending more energy than ordinary walking. The caloric cost of activity codes was estimated on the basis of heart-rate monitoring data.22 Each year, physical education classes at all schools were observed during 2 full weeks. Interobserver agreement was 91% for activity codes. Statistical Analysis Similar analysis methods were used for out-of-school physical activity and fitness outcomes. All measures were adjusted for baseline age. For all measures except the accelerometer, which had no baseline data available, posttest scores were also adjusted for baseline values. Modified one-way analyses of variance
- 12. (ANOVAs) were performed on the ad- justed scores to test for differences among groups. The ANOVAs were modified to account for clustering of values within schools,23 because school was the unit of assignment. Methods of adjusting scores were as follows. In a single regression that in- cluded students from all three experimen- tal conditions, the raw score for each variable was regressed on baseline age and baseline score (or only baseline age, in the case of the accelerometer), and residuals were computed. The mean of the variable's raw score (across all students, all groups) was also determined. Each student's adjusted score was then calcu- lated as the sum of the overall mean and the student's residual score. Methods of modifying the ANOVAs were as follows. Within each experimen- tal condition, the sample size, mean, and variance of the adjusted score were calculated. Also within condition, the intracluster correlation of the adjusted score was computed, with schools as clusters.24 If the computed intracluster correlation was negative, it was set equal to zero. In accordance with Donner et al.,23 the previously calculated sample variance of the adjusted score was itself adjusted-"inflated" by a function of the intracluster correlation. For each experi-
- 13. mental condition, a sample size, sample mean, and adjusted sample variance were computed. These values were inserted into the usual formulas for one-way ANOVA to test for differences among conditions. Effect sizes were calculated to assess the practical significance of the interven- tions in relation to the control condition. Effect size was the difference between two group means, divided by the underly- ing standard deviation. Effect sizes greater than 0.4 are considered large; 0.3 is moderate; and 0.1 is small.25 Separate analyses were conducted for boys and girls. Results Physical Activity in Physical Education Observations revealed substantial dif- ferences by condition in the extent to which children were exposed to physical education. As shown in Table 1, students in the control condition had physical education less frequendly and spent signifi- candy fewer minutes per week in physical education classes. Most importantly, stu- dents in the two intervention conditions spent more time in physical activity in school. Specialist-led students partici- pated in twice as much moderate to vigorous physical activity and expended twice as many calories during physical
- 14. education each week as control students, with teacher-led students in between. 1330 American Journal of Public Health TABLE 1-Observed Minutes per Week of Student Physical Activity in Physical Education Classes and Frequency and Duration of Physical Education, by Condition: Seven Schools in Poway, Calif, 1990 through 1993 Condition (1) Control Classes (2) Trained Teachers (3) PE Specialists Significant (95% Cl) (95% Cl) (95% Cl) ANOVA Contrasts (n = 33 classes) (n = 38 classes) (n = 32 classes) P between Conditions Student activity variables Moderate to vigorous activity, walking 17.8 (13.2, 22.3) 32.7 (29.1, 36.2) 40.2 (36.8, 43.7) <.001 3 > 2 > 1 + very active, min/wk Energy expenditure, kcal/kg/wka 3.3 (2.4, 4.1) 5.8 (5.3, 6.3) 7.2 (6.8, 7.6) <.001 3 > 2 > 1 Amount of physical education Lessons per week, no. 1.8 (1.4, 2.3) 2.6 (2.4, 2.9) 2.9 (2.8, 2.9) <.001 2, 3 > 1 PE per week, min 38.0 (27.9, 48.1) 64.6 (59.0, 70.2) 79.7 (76.3, 83.1) <.001 3 > 2 > 1 Note. Cl = confidence interval; PE = physical education; ANOVA = analysis of variance. aBased on estimates of energy expenditure according to heart-
- 15. rate monitoring data.22 August 1997, Vol. 87, No. 8 Effects of Physical Educadon Out-of-School Physical Activity Outcomes Accelerometer scores. The acceler- ometer was considered the primary physi- cal activity measure. No baseline scores were available, so the data were subjected to simple posttest analyses of covariance, with adjustment for age and clustering within schools. The interpretation of these tests differs from that of all other posttest analyses performed here. Whereas the other posttests are conditional on baseline values, the accelerometer analyses are unconditional. There were no significant group differences on any accelerometer measure, and weekday and weekend scores for fifth grade are shown in Table 2. One-day physical activity recall. Weekday and weekend recalls of physical activity performed out of school were averaged. There was no significant differ- ence among conditions. Health-Related Fitness Outcomes Increased physical activity in inter-
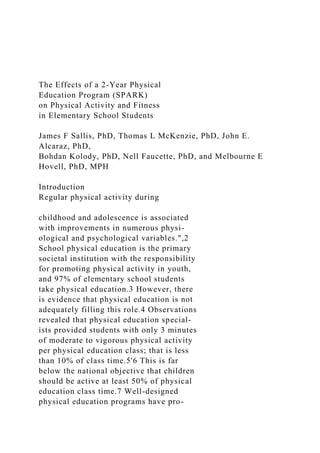
- 16. vention conditions was expected to result in enhanced fitness. Significant interven- tion effects were found on two of five fitness measures (Table 3). Girls in the specialist-led condition improved substan- tially in mile-run time. The mean differ- ence between specialist-led and control conditions of 1 minute at posttest reflected a "moderate" effect size of .32. There was no significant intervention effect for boys. Figure 1 displays results at all four assessment points. On the sit-up test, girls in the specialist-led condition improved more than those in the control condition. The mean difference of about 11 sit-ups in 1 minute at posttest produced a "moderate" effect size of .31. Although there was not a significant difference for boys at posttest, differences between specialist-led and control conditions were significant at spring of fourth grade (P < .002) and fall of fifth grade (P < .001). Figure 2 shows that improvements in sit-ups were consis- tently greater in the teacher-led and specialist-led conditions. There were no significant intervention effects on skin- folds, sit-and-reach, or pull-ups. Discussion Physical education classes in elemen- tary schools have the potential to provide 97% of children in the United States with
- 17. regular physical activity3 that has multiple health benefits in youth."2 To achieve public health goals, elementary physical education programs should promote physi- cal activity during physical education classes as well as outside of school. If the increases in physical activity are suffi- cient, physical fitness should be im- proved.26 The SPARK health-related physical education program increased physical activity during physical educa- tion classes but not out of school. This increase in physical activity was sufficient to improve two components of health- related fitness in girls significantly. The stronger intervention effect in girls may be explained in part by their lower levels of fitness at baseline. The health-related physical educa- tion program provided children with substantially more physical activity than the control condition. It is estimated that during a 36-week school year, students in specialist-led classes spent about 13 more hours in moderate to vigorous physical activity than students in control classes. National7 and international2 groups recommend that young people should participate in at least 30 minutes of moderate to vigorous physical activity on most days. Physical education classes can play a role in providing some of this physical activity for young people. Data from the control condition suggest that
- 18. physical education is supplying only 18 (12%) of the recommended 150 minutes of physical activity per school week. The teacher-led condition supplied 22%, and the specialist-led condition supplied 27%. Although it is not possible for school physical education to provide all the recommended daily physical activity, physical education should be judged in part on how it contributes to national health objectives. Extracurricular pro- grams, community programs, and family involvement are needed to ensure that children receive adequate amounts of physical activity. One of the goals of the SPARK program was to promote regular physical activity outside of school through behav- ioral skills training, parent involvement, and a reward system. Neither objective nor self-report data indicated that this goal was achieved. It is possible that the physical activity measures were insensi- tive to changes that occurred, but there are American Journal of Public Health 1331 TABLE 2-Gender-Specific Effects of the Intervention on Physical Activity Outside of School for 2 Years: Results of Analyses of Covariance, Adjusted for Age and Clustering within Schools (and Baseline for Physical Activity Survey) Boys (n = 487) Girls (n = 468)
- 19. Adjusted Mean Effect Adjusted Mean Effect Variable Condition (95% Cl) P Size (95% Cl) P Size Accelerometer activity, counts/h Weekday, fifth grade Specialist-led 8.36 (7.7, 9.0) .26 .05 6.94 (6.5, 7.4) .09 .05 Teacher-led 7.77 (7.4, 8.2) .13 7.56 (6.9, 8.2) .13 Control 8.21 (7.7, 8.7) 7.86 (7.3, 8.4) Weekend, fifth grade Specialist-led 5.98 (4.3, 7.7) .19 .18 4.75 (4.0, 5.5) .95 .05 Teacher-led 4.18 (3.3, 5.0) .09 4.73 (4.1, 5.4) .04 Control 4.78 (3.0, 6.5) 4.54 (3.3, 5.8) 1-day physical activity recall,a Specialist-led 24.3 (18.6, 30.0) .55 .04 20.3 (18.0, 22.6) .12 .23 spring, fifth grade Teacher-led 22.7 (20.5, 24.9) .12 21.5 (18.5, 24.5) .16 Control 25.3 (23.1, 27.5) 23.9 (21.9, 25.9) Note. Cl = confidence interval. al -day physical activity recall is mean of weekday and weekend self-reports. August 1997, Vol. 87, No. 8 Sallis et al. alternative explanations. First, the self- management curriculum could be poorly designed or not developmentally appropri- ate. Second, the intervention may have
- 20. been well designed but not adequately implemented. Preliminary data suggest that some components of the self- management lessons were not consis- tently implemented. Third, children may have leamed effective self-management skills but have been unable to use them. Anecdotal reports suggest that many children are told to stay indoors after school because of safety concerns. Fourth- and fifth-grade children may not have sufficient control over their schedules to implement the behavioral skills they learned. Self-management may be more effective with older children, who are making more autonomous decisions. A fourth explanation is an inability to show improvement over baseline. The children in this suburban setting may have more access to sports and activity programs than many other children. Over 75% reported being involved in a sports team or activity program at baseline. Present findings of a failure to increase physical activity out of school are generally consistent with previous studies of self-management,27 although some programs have been effective.'0"4 Pro- grams that increased children's physical activity relied mainly on external control, such as physical education classes8"13 and parental reinforcement.28'29 More ef- fective self-management interventions or
- 21. supervised programs are needed to pro- mote children's physical activity. Consistent with observed physical activity during physical education classes, the largest fitness gains were found in specialist-led students. The intervention led to improvements on fitness compo- nents that were emphasized most in the curriculum, notably cardiorespiratory fit- ness. The significant effects for fitness only in girls extends recent findings from other physical activity and dietary change programs that girls seem to be more responsive to these interventions.30'3' It is difficult to demonstrate significant im- provement in boys, because they had higher fitness and activity levels at base- line. 1332 American Journal of Public Health TABLE 3-Gender-Specific Effects of the Intervention for 2 School Years on Health-Related Fitness Measures: Results of Analyses of Covariance, Adjusted for Baseline Values, Age, and Clustering within Schools Adjusted 2-Year Effect Baseline Mean Posttest Mean P (Pairwise Size vs Fitness Variable Condition (95% Cl) (95% Cl) Comparisonsa)
- 22. Control Boys (n = 487) Mile run, sec (3) Specialist-led 819.2 (763.2, 875.3) 578.1 (517.3, 638.8) .33 .144 (2) Teacher-led 697.8 (634.8, 760.9) 639.0 (587.8, 690.4) .018 (1) Control 775.0 (717.7, 832.3) 632.4 (565.4, 699.3) Skinfolds, calf + (3) Specialist-led 26.9 (19.6, 34.1) 26.4 (23.7, 29.1) .55 .076 tricep, mm (2) Teacher-led 26.8 (24.2, 29.4) 25.5 (20.8, 30.1) .119 (1) Control 27.1 (25.4, 28.9) 28.0 (26.3, 29.6) Sit-ups, no. in 1 min (3) Specialist-led 28.3 (26.6, 30.0) 43.2 (31.1, 55.4) .29 .183 (2) Teacher-led 33.1 (28.4, 37.9) 38.3 (34.7, 42.0) .070 (1) Control 30.5 (27.7, 33.3) 35.3 (30.9, 39.7) Pull-ups, total no. (3) Specialist-led 1.6 (1.1, 2.1) 1.8 (1.4, 2.1) .47 .085 (2) Teacher-led 1.5 (1.2, 1.8) 1.9 (1.3, 2.6) .131 (1) Control 1.6 (1.2,1.9) 1.6 (1.3,1.8) Sit-and-reach, in inches (3) Specialist-led 9.8 (9.1, 10.4) 9.4 (9.1, 9.8) .38 .015 (2) Teacher-led 10.2 (9.9,10.6) 8.4 (6.5, 10.3) .139 (1) Control 9.8 (8.9,10.7) 9.5 (9.0,10.1) Girls (n = 468) Mile run, sec (3) Specialist-led 927.3 (793.0, 1061.6) 668.0 (629.3, 706.6) .03 (3 < 1) .318 (2) Teacher-led 814.9 (761.1, 868.6) 709.2 (677.5, 740.9) .099
- 23. (1) Control 916.3 (849.2, 983.4) 727.8 (703.9, 751.7) Skinfolds, calf + (3) Specialist-led 28.7 (24.5, 33.0) 30.0 (28.8, 31.2) .14 .008 tricep, mm (2) Teacher-led 30.4 (27.4, 33.4) 28.0 (25.6, 30.4) .201 (1) Control 31.2 (28.7, 33.7) 30.1 (29.0, 31.1) Sit-ups, no. in 1 min (3) Specialist-led 25.3 (23.9, 26.7) 40.9 (31.5, 50.2) .03 (1 < 3) .308 (2) Teacher-led 28.8 (23.6, 34.0) 35.6 (31.3, 39.9) .160 (1) Control 26.7 (24.3, 29.1) 30.0 (26.5, 33.4) Pull-ups, total no. (3) Specialist-led 1.1 (0.4, 1.7) 0.9 (0.4, 1.4) .75 .030 (2) Teacher-led 1.0 (0.5,1.5) 1.1 (0.1, 2.1) .084 (1) Control 0.7 (0.4, 1.0) 0.8 (0.4,1.1) Sit-and-reach, in inches (3) Specialist-led 10.9 (10.1, 11.7) 11.6 (11.2,11.9) .33 .030 (2) Teacher-led 11.3 (11.0, 11.7) 9.7 (6.7,12.8) .132 (1) Control 10.9 (10.3, 11.5) 11.2 (10.9, 11.6) Note. Cl = confidence interval. aNumbers refer to conditions. August 1997, Vol. 87, No. 8 Effects of Physical Education Girls 45- Girls 900-
- 24. U 1850 9 1 402 o S~~~~~~~~~~~~~~~~c z 750- C S~~~~~~~%CS . 30. 650I 1 9 1 3 1 9 25 Months 1 9 13 19 Boys Months 800- 45- 750-~~~~~~~~~~~~~*C 750 Boys 0 -o P E 0 l o PEU .T 700- 40 p c 650- Noe CO = otocodto;T 600c CO3 c o b~~~ 550* ______I_____I_____I U9 131s9
- 25. Months 30 m 1 9 1 3 1 9 condition (mean experiMonths TT ....0....~O PES 0.... PES - TT Note. CO control condition; UT = trained teacher condition; PES = physical education specialist condi- Note. PES = physical education special- tion. ist condition; TT = trained teacher condition; CO = control condition. FIGURE 1-Gender-specificng. adJuspecifimile run times at FGR -edrseii four measurement sit-up scores at four points, by measurement experimental points, by condition (mean experimental time In seconds is condition (mean adjusted for sit-ups in 60 baseline score, age, seconds are and clustering), adjusted for baseline score, age, and clustering). The teacher-led condition had no apparent effect on mile-run time for boys or girls. The increase of only 7 minutes per week of vigorous physical activity in the teacher-led condition, compared with the control condition, would not be
- 26. expected to produce a cardiorespiratory training effect.26 It is likely the specialists were more consistent than trained classroom teachers in carrying out abdominal strength and endurance activities during physical edu- cation, which may explain why there were significant effects only in the specialist- led condition. The effect was significant for girls at the 2-year posttest, but the significant group differences for boys at intermediate measurements suggest an intervention effect for boys. SPARK physical education classes probably in- cluded insufficient strength and flexibility activities to produce fitness improvements in these components. Previous studies found few effects of school-based health promotion programs on adiposity or body weight,32 so present results support earlier findings. Physical education specialists were superior to trained classroom teachers in most outcomes. Specialists spent more time in physical education classes, pro- vided students with more physical activ- ity, and enhanced female students' fitness. These results support position statements calling for certified physical education specialists at all grade levels. Present results also support the con-
- 27. clusion that elementary classroom teach- ers, with adequate training and support, can improve their teaching of physical education. Compared with control teach- ers, trained classroom teachers taught more physical education and provided students with more physical activity. These outcomes support the effectiveness of the SPARK teacher-training program. Limitations include the small num- ber of schools, the quasi-experimental design, the restriction of the study to a single school district, and the lack of baseline measures for the accelerometer. Owing to an inability to remeasure all variables in all subjects assessed at baseline, it is possible that intervention effect sizes were smaller for subjects who were dropped from the analyses. All these factors limit the generalizability of the results. Elementary physical education can be improved with a program that is feasible in real-world settings. Health- related physical education curricula, with effective teacher training and support, have the potential to provide children with much more physical activity than they receive in typical physical education classes,5'6 and this increased physical activity is expected to contribute to multiple health benefits in youth." 2 Fur- ther work is needed to promote generaliza- tion of physical activity throughout the
- 28. child's day and to evaluate similar pro- grams in more ethnically and socioeco- nomically diverse schools. Elementary school administrators and teachers are encouraged to adopt health-related physi- cal education programs that are effective in providing children with substantial amounts of physical activity. [] Acknowledgments This work was supported by NIH grant HL44467. The assistance of the Poway, Calif, Unified School District is gratefully acknowl- edged, with special thanks to Romeo Camozzi. Julia J. Roby, Paul Rosengard, Kathleen J. Goggin, Colin Armstrong, Kecia Carrasco, and May Tai contributed substantially to this study. References 1. Baranowski T, Bouchard C, Bar-Or 0, et al. Assessment, prevalence and cardiovas- cular benefits of physical activity and fitness in youth. Med Sci Sports Ezce,r. 1992;24(suppl):S221-S236. August 1997, Vol. 87, No. 8 American Journal of Public Health 1333 Sallis et al.
- 29. 2. Sallis JF, Patrick K. Physical activity guidelines for adolescents: consensus state- ment. Pediatr Exerc Sci. 1994;6:302-314. 3. Ross JG, Gilbert GG. The National Chil- dren and Youth Fitness Study: a summary of findings. J Phys Educ Recreat Dance. 1985;56(l):45-50. 4. Sallis JF, McKenzie TL. Physical educa- tion's role in public health. Res Q Exerc Sport. 1991;62:124-137. 5. Simons-Morton BG, Taylor WC, Snider SA, et al. The physical activity of fifth- grade students during physical education. Am J Public Health. 1993;83:262-265. 6. Simons-Morton BG, Taylor WC, Snider SA, et al. Observed levels of elementary and middle school children's physical activity during physical education classes. Prev Med. 1994;23:437-441. 7. Healthy People 2000: National Health Promotion and Disease Prevention Objec- tives. Washington, DC: Public Health Service; 1991. DHHS publication PHS 91-50212. 8. Shephard RJ, JeQuier J, LaVallee H, et al. Habitual physical activity: effects of sex, milieu, season, and required activity. J Sports Med. 1980;20:55-66. 9. Simons-Morton BG, Parcel GS,
- 30. Baranowski T, et al. Promoting healthful diet and physical activity among children: results of a school-based intervention study. Am J Public Health. 1991;81:986- 991. 10. Luepker RV, Peny CL, McKinlay SM, et al. Outcomes of a field trial to improve children's dietary patterns and physical activity: the Child and Adolescent Trial for Cardiovascular Health (CATCH). JAMA. 1996;275:768-776. 11. Duncan B, Boyce WT, Itami R, et al. A controlled trial of a physical fitness pro- gram for fifth grade students. J Sch Health. 1983;53:467-471. 12. Dwyer T, Coonan WE, Leitch DR, et al. An investigation of the effects of daily physi- cal activity on the health of primary school students in South Australia. Int J Epide- miol. 1983;12:308-312. 13. Siegel JA, Manfredi TG. Effects of a ten month fitness program on children. Physi- cian Sportsmed. 1984;12:91-97. 14. Kelder SH, Perry CL, Klepp K-I. Commu- nity-wide youth exercise promotion: out- comes from the Minnesota Heart Health Program and Class of 1989 Study. J Sch Health. 1993;63:218-223. 15. 1990 Census of Population and Housing: Summary Population and Housing Charac-
- 31. teristics, California. Washington, DC: US Dept of Commerce, Bureau of the Census; 1990. 1990 CPH-1-6. 16. Holroyd KA, Creer TL. Self-Management of Chronic Disease. New York, NY: Academic Press; 1986. 17. Sallis JF, Condon SA, Goggin KJ, et al. The development of self-administered physical activity surveys for 4th grade students. Res Q Exerc Sport. 1993;64: 25-31. 18. Sallis JF, Buono MJ, Roby JJ, et al. The Caltrac accelerometer as a physical activity monitor for school-age children. Med Sci Sports Exerc. 1990;22:698-703. 19. Institute for Aerobics Research. FITNESS- GRAM User's Manual. Dallas, Tex: Insti- tute for Aerobics Research; 1987. 20. Morrow JR, Falls HB, Kohl HW, eds. The Prudential FITNESSGRAM: Technical Ref- erence Manual. Dallas, Tex: Cooper Insti- tute for Aerobics Research; 1994. 21. McKenzie TL, Sallis JF, Nader PR. SOFIT: system for observing fitness instruction time. J Teach Phys Educ. 1991;I1l:195-205. 22. McKenzie TL, Sallis JF, Nader PR, et al. BEACHES: an observational system for assessing children's eating and physical
- 32. activity behaviors and associated events. J ApplBehavAnal. 1991;24:141-151. 23. Donner A, Birkett N, Buck C. Randomiza- tion by cluster: sample size requirements and analysis. Am J Epidemiol. 1981;114: 906-914. 24. Snedecor G, Cochran W. Statistical Meth- ods. 8th ed. Iowa City, Iowa: Iowa State University Press; 1989. 25. Cohen J. Statistical PowerAnalysisfor the Behavioral Sciences. New York, NY: Aca- demic Press; 1977. 26. Morrow JR, Freedson PS. Relationship between habitual physical activity and aerobic fitness in adolescents. Ped Exerc Sci. 1994;6:315-329. 27. Sallis JF, Simons-Morton BG, Stone EJ, et al. Determinants of physical activity and interventions in youth. Med Sci Sport Exerc. 1992;24(suppl):S248-S257. 28. Epstein LH. Adherence to exercise in obese children. J Card Rehabil. 1984;4: 185-195. 29. Taggart AC, Taggart J, Siedentop D. Effects of a home-based activity program: a study with low-fitness elementary school children. Behav Modif: 1986;10:487-507. 30. Stone EJ, Baranowski T, Sallis JF, et al.
- 33. Review of behavioral research for cardio- pulmonary health: emphasis on youth, gender, and ethnicity. J Health Educ. 1995;26(suppl):S9-S 17. 31. Vandongen R, Jenner DA, Thompson C, et al. A controlled evaluation of a fitness and nutrition intervention program on cardio- vascular health in 10- to 12-year-old children. Prev Med. 1995;24:9-22. 32. Sallis JF, Chen AH, Castro CM. School- based interventions for childhood obesity. In: Cheung LWY, Richmond JB, eds. Child Health, Nutrition, and Physical Activity. Champaign, Ill: Human Kinetics; 1995: 179-204. 1334 American Journal of Public Health August 1997, Vol. 87, No. 8 Assignment: Evidence-Based Project Is there a difference between “common practice” and “best practice”? When you first went to work for your current organization, experienced colleagues may have shared with you details about processes and procedures. Perhaps you even attended an orientation session to brief you on these matters. As a “rookie,” you likely kept the nature of your questions to those with answers that would best help you perform your new role. Over time and with experience, perhaps you recognized aspects of these processes and procedures that you wanted to question further. This is the realm of clinical inquiry.
- 34. Clinical inquiry is the practice of asking questions about clinical practice. To continuously improve patient care, all nurses should consistently use clinical inquiry to question why they are doing something the way they are doing it. Do they know why it is done this way, or is it just because we have always done it this way? Is it a common practice or a best practice? In this Assignment, you will identify clinical areas of interest and inquiry and practice searching for research in support of maintaining or changing these practices. You will also analyze this research to compare research methodologies employed. To Prepare: · Review the Resources and identify a clinical issue of interest that can form the basis of a clinical inquiry. · Based on the clinical issue of interest and using keywords related to the clinical issue of interest, search at least four different databases in the Walden Library to identify at least four relevant peer-reviewed articles related to your clinical issue of interest. · Review the results of your peer-reviewed research and reflect on the process of using an unfiltered database to search for peer-reviewed research. · Reflect on the types of research methodologies contained in the four relevant peer-reviewed articles you selected. Part 1: An Introduction to Clinical Inquiry Create a 4- to 5-slide PowerPoint presentation in which you do the following: · Identify and briefly describe your chosen clinical issue of interest. · Describe how you used keywords to search on your chosen clinical issue of interest. · Identify the four research databases that you used to conduct your search for the peer-reviewed articles you selected. · Provide APA citations of the four peer-reviewed articles you
- 35. selected. Part 2: Identifying Research Methodologies After reading each of the four peer-reviewed articles you selected, use the Matrix Worksheet template to analyze the methodologies applied in each of the four peer-reviewed articles. Your analysis should include the following: · The full citation of each peer-reviewed article in APA format. · A brief (1-paragraph) statement explaining why you chose this peer-reviewed article and/or how it relates to your clinical issue of interest, including a brief explanation of the ethics of research related to your clinical issue of interest. · A brief (1-2 paragraph) description of the aims of the research of each peer-reviewed article. · A brief (1-2 paragraph) description of the research methodology used. Be sure to identify if the methodology used was qualitative, quantitative, or a mixed-methods approach. Be specific. · A brief (1- to 2-paragraph) description of the strengths of each of the research methodologies used, including reliability and validity of how the methodology was applied in each of the peer-reviewed articles you selected. Assignment: Evidence - Based Project Is there a difference between “common prac tice” and “best practice”? When you first went to work for your current organization, experienced colleagues may have shared with you details about processes and procedures. Perhaps you even attended an orientation session to brief you on these matters. As
- 36. a “rookie,” you likely kept the nature of your questions to those with answers that would best help you perform your new role. Over time and with experience, perhaps you recognized aspects of these processes and procedures that you wanted to question furt her. This is the realm of clinical inquiry. Clinical inquiry is the practice of asking questions about clinical practice. To continuously improve patient care, all nurses should consistently use clinical inquiry to question why they are doing something the way they are doing it. Do they know why it is done this way, or is it just because we have always done it this way? Is it a common practice or a best practice? In this Assignment, you will identify clinical areas of interest and inquiry and practice searc hing for research in support of maintaining or changing these practices. You will also analyze this research to compare research methodologies employed. To Prepare: ·
- 37. Review the Resources and identify a clinical issue of interest that can form the basis of a clinical inquiry. · Based on the clinical issue of interest and using keywords related to the clinical issue of interest, search at least four different databases in the Walden Library to identify at least four relevant peer - reviewed articles related to you r clinical issue of interest. · Review the results of your peer - reviewed research and reflect on the process of using an unfiltered database to search for peer - reviewed research. · Reflect on the types of research methodologies contained in the four relevant p eer - reviewed articles you selected. Part 1: An Introduction to Clinical Inquiry
- 38. Create a 4 - to 5 - slide PowerPoint presentation in which you do the following: · Identify and briefly describe your chosen clinical issue of interest. · Describe how you used keywords to search on your chosen clinical issue of interest. · Identify the four research databases that you used to conduct your search for the peer - reviewed articles you selected. · Provide APA citations of the four peer - reviewed artic les you selected. Part 2: Identifying Research Methodologies After reading each of the four peer -
- 39. reviewed articles you selected, use the Matrix Worksheet template to analyze the methodologies applied in each of the four peer - reviewed articles. Your analysi s should include the following: · The full citation of each peer - reviewed article in APA format. Assignment: Evidence-Based Project Is there a difference between “common practice” and “best practice”? When you first went to work for your current organization, experienced colleagues may have shared with you details about processes and procedures. Perhaps you even attended an orientation session to brief you on these matters. As a “rookie,” you likely kept the nature of your questions to those with answers that would best help you perform your new role. Over time and with experience, perhaps you recognized aspects of these processes and procedures that you wanted to question further. This is the realm of clinical inquiry. Clinical inquiry is the practice of asking questions about clinical practice. To continuously improve patient care, all nurses should consistently use clinical inquiry to question why they are doing something the way they are doing
- 40. it. Do they know why it is done this way, or is it just because we have always done it this way? Is it a common practice or a best practice? In this Assignment, you will identify clinical areas of interest and inquiry and practice searching for research in support of maintaining or changing these practices. You will also analyze this research to compare research methodologies employed. To Prepare: st that can form the basis of a clinical inquiry. related to the clinical issue of interest, search at least four different databases in the Walden Library to identify at least four relevant peer-reviewed articles related to your clinical issue of interest. -reviewed research and reflect on the process of using an unfiltered database to search for peer-reviewed research. thodologies contained in the four relevant peer- reviewed articles you selected. Part 1: An Introduction to Clinical Inquiry Create a 4- to 5-slide PowerPoint presentation in which you do the following: al issue of interest. clinical issue of interest.
- 41. your search for the peer- reviewed articles you selected. of the four peer-reviewed articles you selected. Part 2: Identifying Research Methodologies After reading each of the four peer-reviewed articles you selected, use the Matrix Worksheet template to analyze the methodologies applied in each of the four peer- reviewed articles. Your analysis should include the following: -reviewed article in APA format.