1. THE NET LEASE MARKET REPORT
Q4 2013
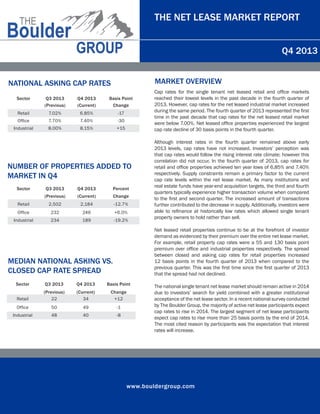
NATIONAL ASKING CAP RATES
MARKET OVERVIEW
Cap rates for the single tenant net leased retail and office markets
reached their lowest levels in the past decade in the fourth quarter of
2013. However, cap rates for the net leased industrial market increased
during the same period. The fourth quarter of 2013 represented the first
time in the past decade that cap rates for the net leased retail market
were below 7.00%. Net leased office properties experienced the largest
cap rate decline of 30 basis points in the fourth quarter.
Sector
Q3 2013
(Previous)
Q4 2013
(Current)
Basis Point
Change
Retail
7.02%
6.85%
-17
Office
7.70%
7.40%
-30
Industrial
8.00%
8.15%
+15
NUMBER OF PROPERTIES ADDED TO
MARKET IN Q4
Sector
Q3 2013
Q4 2013
Percent
(Previous)
(Current)
Change
Retail
2,502
2,184
-12.7%
Office
232
246
+6.0%
Industrial
234
189
-19.2%
Net leased retail properties continue to be at the forefront of investor
demand as evidenced by their premium over the entire net lease market.
For example, retail property cap rates were a 55 and 130 basis point
premium over office and industrial properties respectively. The spread
between closed and asking cap rates for retail properties increased
12 basis points in the fourth quarter of 2013 when compared to the
previous quarter. This was the first time since the first quarter of 2013
that the spread had not declined.
MEDIAN NATIONAL ASKING VS.
CLOSED CAP RATE SPREAD
Although interest rates in the fourth quarter remained above early
2013 levels, cap rates have not increased. Investors’ perception was
that cap rates would follow the rising interest rate climate; however this
correlation did not occur. In the fourth quarter of 2013, cap rates for
retail and office properties achieved ten year lows of 6.85% and 7.40%
respectively. Supply constraints remain a primary factor to the current
cap rate levels within the net lease market. As many institutions and
real estate funds have year-end acquisition targets, the third and fourth
quarters typically experience higher transaction volume when compared
to the first and second quarter. The increased amount of transactions
further contributed to the decrease in supply. Additionally, investors were
able to refinance at historically low rates which allowed single tenant
property owners to hold rather than sell.
Sector
Q3 2013
Q4 2013
Basis Point
Retail
(Previous)
22
(Current)
34
Change
+12
Office
50
49
-1
Industrial
48
40
-8
The national single tenant net lease market should remain active in 2014
due to investors’ search for yield combined with a greater institutional
acceptance of the net lease sector. In a recent national survey conducted
by The Boulder Group, the majority of active net lease participants expect
cap rates to rise in 2014. The largest segment of net lease participants
expect cap rates to rise more than 25 basis points by the end of 2014.
The most cited reason by participants was the expectation that interest
rates will increase.
www.bouldergroup.com
2. THE NET LEASE MARKET REPORT
Q4 2013
SELECTED SINGLE TENANT SALES COMPARABLES
Sale
Date
Sector
Price
Per SF
Cap
Rate
Oct-13
Retail
LA Fitness
Houston
TX
$12,000,000
$267
7.50%
15
Oct-13
Retail
Dick’s Sporting Goods
Durham
NC
$11,800,000
$204
7.50%
9
Oct-13
Retail
Trader Joe’s
Evanston
IL
$11,000,000
$733
5.08%
15
Dec-13
Retail
Kohl’s
Avondale
AZ
$10,600,000
$120
6.55%
10
Nov-13
Retail
Walgreens
Greenwood
IN
$9,200,000
$695
5.92%
25
Nov-13
Retail
Besy Buy
Mishawaka
IN
$7,000,000
$140
10.83%
10
Oct-13
Retail
Bank of America
Chicago
IL
$6,940,000
$733
5.62%
12
Oct-13
Retail
Walgreens
Memphis
TN
$6,410,000
$440
5.90%
22
Oct-13
Office
GSA - DEA
Tallahassee
FL
$6,150,000
$322
7.64%
6
Dec-13
Retail
Aldi
Addison
IL
$5,475,000
$198
5.81%
15
Oct-13
Retail
CVS
Opelika
AL
$5,250,000
$482
6.66%
19
Tenant
City
State
Price
Lease Term
Remaining
NET LEASED CAP RATE TRENDS
8.75%
8.25%
7.75%
7.25%
6.75%
Q2
Q3
Q4
Q1
Q2
2006 2006 2006 2007 2007
Q3
2007
Q4
2007
Q1
2008
Q2
2008
Q3
2008
Q4
2008
Q1
2009
Q2
2009
Q3
2009
Q4
2009
Q1
2010
Q3
Q2
Q3
Q4 Q1 Q2 Q3
Q4
Q1
Q2
2010 2010 2010 2011 2011 2011 2011 2012 2012 2012
Retail
www.bouldergroup.com
Q4
2012
Q1
2013
Office
Q2
Q3
Q4
2013 2013 2013
Industrial