9. identification of rice hybrids and their parental lines based on
•
0 likes•687 views


Recommended
Recommended
More Related Content
What's hot
What's hot (20)
Viewers also liked
Viewers also liked (17)
Similar to 9. identification of rice hybrids and their parental lines based on
Similar to 9. identification of rice hybrids and their parental lines based on (20)
More from Vishwanath Koti
More from Vishwanath Koti (20)
Recently uploaded
Recently uploaded (20)
9. identification of rice hybrids and their parental lines based on
- 1. 176 F O R M A T T E D P R O O F N. NETHRA, S. RAJENDRA PRASAD, K. VISHWANATH, K.N. DHANRAJ AND R. GOWDA * Author for correspondence Nethra, N., Rajendra Prasad, S., Vishwanath, K., Dhanraj, K.N. and Gowda, R. (2007), Seed Sci. & Technol., 35, 176-186 Identification of rice hybrids and their parental lines based on seed, seedling characters, chemical tests and gel electrophoresis of Total soluble proteins N. NETHRA, S. RAJENDRA PRASAD, K. VISHWANATH*, K.N. DHANRAJ AND R. GOWDA Department of Seed Science and Technology, UAS, G.K.V.K, Bangalore-560065, India (E-mail: vishwakoti@gmail.com) (Accepted September 2006) Summary Identification of rice genotypes is of prime importance to ensure quality seed, which is required for achieving global food demand. Three rice hybrids and their parental lines were identified on the basis of seed colour, seed size and 1000 seed weight, response to different chemicals (Phenol, Modified phenol with Copper sulphate or Ferrous sulphate, NaOH, GA3 and 2,4-D) and electrophoresis of soluble seed proteins (SDS-PAGE). All the genotypes were identified by using key based on seed colour, 1000 seed weight and seed size except for the female lines and their maintainers. No individual chemical test was able to distinguish all the genotypes. However, the combinations of different rapid chemical tests were useful in identification of individual genotypes. While all the cultivars were identified successfully by using electrophoresis of seed protein (SDS-PAGE) and hence it could be used as a powerful tool to identify every genotype in a short period of time. Introduction Rice is the most important cereal grain of the world. It is estimated that half of the world’s population depends on rice as its main source of food and Asia is considered as the homeland of rice. India has the largest acreage under rice growing countries of world but ranks second in production, owing to its lower productivity. To sustain its high production and productivity, a number of high yielding varieties and hybrids have been developed and notified in the recent past, out of which many varieties and hybrids are now in seed production chain. The release of large number of rice hybrids has increased the task as well as the responsibilities of seed technologists in order to ensure the quality of seed. Seed technologists must be well equipped to identify different varieties and hybrids, both at field and at seed level. Varietal descriptions given by the breeders most often relate to field characters and not sufficient to identify genotypes or seed lot adequately. Frequently, information is required rapidly, which can be only provided by identification at the seed or seedling level or some chemical tests, which should be rapid, reliable and reproducible.
- 2. 177 F O R M A T T E D P R O O F IDENTIFICATION OF RICE HYBRIDS Many researchers have used seed, seedling morphological characters and different chemical tests for varietal identification. Electrophoresis is a relatively sophisticated reliable and reproducible technique that has been used extensively by many workers for wheat, soybean, barley, pearl millet, oat and other crop species for varietal identification (Grabe, 1957, Cooke, 1987; Vanangamudi et al., 1988; Varier, 1993; Cooke, 1993). The present study was under taken to develop laboratory keys based on seed, seedling characters, chemical test and electrophoretic analysis of total seed proteins for identification of some rice hybrids and their parental lines. Material and methods Pure seeds of three elite rice hybrids, viz., KRH-2, APRH-2, and DRRH-1: their parental lines (IR-58025A, IR-58025B, IR-62829A, IR-62829B, KMR-3R, MTU-9992R, and IR- 40750R) were obtained from Directorate of Rice Research, Hyderabad. Observations on seed colour, seed size and 1000 seed weight were recorded. Fifty seeds of each genotype were observed visually for seed colour with the aid of magnifying glass and Munsell soil colour charts (Anon., 1954) were used for assigning seed colour classes. Seed length, width and thickness were measured with the help of grain micrometer and seed size was calculated by using the formula (l × w × t) 1/3 . Eight replications of 1000 seeds each were used to calculate test weight. Phenol test: The standard phenol test for varietal purity testing as suggested by Walls (1965) was followed. Four replications of 100 seeds each were soaked in distilled water for 24 hours. The seeds were then placed in petri dishes containing filter paper moistened with 5 ml of 1% phenol solution and kept at room temperature (28°C) for 24 hours. After that, the seeds were examined and grouped into different colour classes as no colour change, light brown, brown and dark brown. Modified phenol test with Copper sulphate or Ferrous sulphate: As described by Banerjee and Chandra (1977), the procedure similar to the standard phenol test except that the seeds were soaked in a solution of 0.5% CuSo4 or 1% FeSo4 instead of soaking the seeds in distilled water. The seeds were examined and grouped into five distinct groups namely, no colour change, light brown, brown, dark brown and black. NaOH test: Four replications of fifty seeds each were soaked in 3% NaOH solution for 3 hours and thereafter the change in colour of the solution was observed. Based on intensity of colour reaction, the genotypes were classified into three groups viz., no colour change, light yellow and wine red. GA3 test: Four hundred seeds were soaked in 25, 50 and 100 ppm GA3 and germinated as per ISTA (1996). The shoot length was measured and the percentage increase in shoot length over that of control was computed and different groups were made based on their response viz., Low (<35%), Medium (51-75%), High (76-100%) and Very high (>100%).
- 3. 178 F O R M A T T E D P R O O F N. NETHRA, S. RAJENDRA PRASAD, K. VISHWANATH, K.N. DHANRAJ AND R. GOWDA 2,4-D test: Four hundred seeds were soaked in 5 and 10 ppm 2,4-D and germinated as per ISTA (1996). Observations were recorded on 7th day in terms of decrease in shoot length over that of control and genotypes were grouped as Tolerant (<50%), Susceptible (50- 60%) and Highly Susceptible (60%). Electrophoretic technique of Total soluble seed proteins: SDS-PAGE of total soluble seed proteins was carried out by using 15 per cent gels according to the methods prescribed by Laemmli (1970) with slight modifications. Protein was extracted from single seed by adding 0.2 ml Tris glysine extraction buffer (25 mM, pH 8.5). The suspension was centrifuged at 10000 rpm for 15 minutes. The extract was dissolved in equal amount of working buffer (Tris-HCl 0.0625 M, pH 6.8, 2% SDS, 5% 2- mercaptoethanol, 15% glycerol and 0.001% bromophenol blue) and kept in boiling water for 2 minutes, again centrifuged and the supernatant was used for loading on to the gels. A current of 1.5 mA per well with a voltage of 80 V was applied until the tracking dye crossed the stacking gel. Later the current was increased to 2 mA per well and voltage up to 120 V. The electrophoresis was stopped when the tracking dye reached the bottom of the resolving gel. Then the gel was stained using coomaasie brilliant blue solution overnight and destained using a mixture of 227 ml of methanol, 46 ml of acetic acid and 227 ml of distilled water until the bands were clearly visible. Results and discussion The data for seed characteristics, presented in table 1, showed an ample amount of variation for seed colour, seed size, and 1000 seed weight. Four types of seed colours were observed in the genotypes studied viz., yellow (KMR-3R), yellowish white (IR-40750R), pale yellow (MTU-9992R and IR-62829B) and very pale brown (IR-62829A, IR-58025A, IR- 58025B, KRH-2, APRH-2, DRRH-1). Pascual et al., (1983) and Ramaiah and Rao, (1953) have also described different seed colour classes in rice seeds. Two groups were made based on seed size namely medium (3.03-3.51; all the genotypes except MTU 9992R) and large (>3.51; MTU 9992R). Based on the 1000 seed weight, the genotypes were grouped into three different categories viz., light (<18.0g; IR-62829A) medium (18.1-23.0g; IR- 58025A, IR-58025B, IR-62829B, IR-40750R, KMR-3R, KRH-2, APRH-2 and DRRH-1) and heavy (> 23.0g; MTU-9992R). A key based on the seed characters was constructed as an aid for the identification of these hybrids and their parental lines (figure 4). The genotypes were also grouped on the basis of the reaction of seeds to the various chemical tests (table 2). Standard Phenol test: The ten genotypes were grouped depending upon the intensity of staining. Hybrid DRRH-1 stained dark brown, APRH-2 and IR-62829A stained light brown, while rest of the genotypes stained brown. This test was unable to discriminate all the cultivars.
- 4. 179 F O R M A T T E D P R O O F IDENTIFICATION OF RICE HYBRIDS Table 1. Seed characters of rice hybrids and their parental lines. Genotypes Seed Seed 1000 seed colour Size (mm) weght (g) Female lines IR 58025A Very pale brown 3.19 20.63 IR 62829A Very pale brown 3.32 17.61 Maintainers IR 58025B Very pale brown 3.36 19.45 IR 62829B Pale yellow 3.20 18.67 Restorer lines KMR-3R Yellow 3.51 19.00 MTU 9992R Pale yellow 3.67 23.90 IR 40750R Yellowish white 3.31 20.73 Hybrid KRH-2 Very pale brown 3.16 19.61 APRH-2 Very pale brown 3.04 18.59 DRRH-1 Very pale brown 3.22 18.65 S. Em ± 0.175 0.174 CD (0.05P) 0.524 0.519 Table 2. Changes in seed coat colour due to various chemicals in rice genotypes. Genotype Standard Modified phenel test NaOH GA3 2,4-D phenol test test test test CuSo4 FeSo4 (0.5%) (1%) IR 58025A B B B WR Low Susceptible IR 62829A LB LB LB WR Medium Susceptible IR 58025B B B DB LY Medium Susceptible IR 62829B B B B LY Very high Tolerant KMR-3R B B B WR High Susceptible MTU 9992R B LB LB LY High Tolerant IR 40750R B B BL LY Medium Susceptible KRH-2 B BL B LY Medium Susceptible APRH-2 LB B B LY Medium Susceptible DRRH-1 DB BL BL LY Medium Susceptible Note: NC – No colour change; BL – Black; LB – Light Brown; LY – Light Yellow; B – Brown; WR – Wine Red; DB – Dark Brown
- 5. 180 F O R M A T T E D P R O O F N. NETHRA, S. RAJENDRA PRASAD, K. VISHWANATH, K.N. DHANRAJ AND R. GOWDA Modified Phenol test: The modified phenol test using Cu++ ions helped in further subdividing the standard phenol groups (Jaiswal and Agarwal, 1995). Seeds of MTU992R and APRH-2 with brown colour in standard phenol test were subdivided into light brown and brown respectively by modified phenol test with Cu++ ions. Similarly, IR-58025A, IR-58025B, KMR-3R and IR-40750R which were brown in standard phenol test were further subcategorized into brown (IR-58025A and KMR-3R), dark brown (IR-58025B) and black (IR-40750R) by using Fe++ ions. NaOH test: Based on the NaOH test, genotypes could be divided into two groups: Reddish brown (IR-62829B, MTU-9992R and APRH-2) and light yellow (rest of the genotypes studied) (figure 1). GA3 test: The present study, GA3 (25, 50 and 100ppm) was used and its effect on increase in shoot growth over control was studied (Goyal and Baijal, 1980; Bansal et al., 1992). Based on the response to 100ppm concentration it was possible to categorize the genotypes into different groups; Low i.e. < 50% (IR-58025A), medium i.e. 51-75 % (IR-62829A, IR-40750R, KRH-2, DRRH-1 and APRH-2), high i.e. 76-100 % (KMR-3R and MTU- 9992R) and very high i.e. > 100% (IR-62829B) (figure 2). Figure 1. Response of rice genotypes to NAOH test. Figure 2. Response of rice genotypes to GA3 (100ppm).
- 6. 181 F O R M A T T E D P R O O F IDENTIFICATION OF RICE HYBRIDS Figure 3. Response of rice genotypes to 2, 4-D (10ppm). 2,4-D test: Based on the response to 2,4-D (5 and 10 ppm) shoot length inhibition, the genotypes categorized into two groups; tolerant i.e. < 30% reduction over control (IR- 62829B, and MTU-9992R) and susceptible i.e. > 60% reduction over control (rest of the other genotypes). The difference in reduction in seedling growth genotypes might be due to differential ethylene production up on application of 2,4-D (Sundaru et al., 1983). Based on seed colour genotypes KMR-3R (Yellow) and IR-40750 (Yellowish white) could be distinguished from other genotypes. IR-62829B and MTU-992R showed pale yellow seed colour and these two genotypes could be further distinguished by 1000 seed weight (figure. 4). Most of the genotypes could be identified by using key based on seed colour, 1000 seed weight and seed size except for female lines and their maintainers. This showed that based on seed characteristics it is difficult to identify all the genotypes unambiguously. The genotypes IR-58025A and IR 58025B that showed same seed colour, 1000 seed weight and seed size, could be distinguished clearly by their response to modified phenol test with FeSO4 (figure 5). Further, all the genotypes could be grouped in to two different categories based on response to NaOH. However, by standard and modified phenol tests each cultivar was sub categorized and identified. Response of seeds to different chemicals helped in grouping the genotypes rather than clear cut differentiation from each other. No individual chemical test was efficient in distinguishing the genotypes individually. However, they can use as supplement to each other. The soluble seed proteins of rice inbreds/hybrids were extracted and separated by an SDS-PAGE method. Based on the strongly staining bands in the central region of the electrophorograms, it was possible to characterize all the genotypes individually (figure 6 and 7).
- 7. 182 F O R M A T T E D P R O O F N. NETHRA, S. RAJENDRA PRASAD, K. VISHWANATH, K.N. DHANRAJ AND R. GOWDA Total soluble seed proteins could be fractionated into 28 bands, which showed heterogeneity among the genotypes. The highest number of bands (18) was observed in APRH-2 (figure 7). Regions C (43 KD), D (29 KD) and E (20 KD) were found useful to identify most of the genotypes studied, as the banding pattern was distinct for each of the genotypes in these regions. The cultivars differed in the number of bands, their mobility (position) and intensity. The results on the banding pattern of the protein profiles suggested that the specific genotype could be differentiated by either based on either the position or intensity of bands but not on number, as some of the genotypes expressed similar number of bands (table 3). These results are inline with results of Chauhan and Nanda (1984). The results of the present study suggests that the genotypes of rice examined can be characterized, distinguished and identified by combination of seed, seedling characters and chemical tests. However, these need extended time to perform all these tests. In the present study all the cultivars were identified successfully by using electrophoresis of seed protein and hence it could be powerful tool to identify every genotype in a short period of time. Seed Colour 1000 Seed weight 1000 Seed weight Seed size Medium IR-58025A& IR-58025B Light IR-62829A Medium IR-58025A& IR-58025B Yellow KMR-3R Yellowish white IR-40750R Pale Yellow IR-62829 B MTU-9992R Very pale brown IR-62829A, APRH-2, KRH-2, DRRH-1, IR-58025A, IR-58025B Medium IR-62829B High MTU-9992R Figure 4. Identification of rice genotypes based on seed and seedling characters.
- 8. 183 F O R M A T T E D P R O O F IDENTIFICATION OF RICE HYBRIDS NaOH test Reddish brown Light Yellow IR 62829B, MTU 9992R IR-58025A, IR-58025B, KMR-3R, & APRH-2 IR-40750R, KRH-2 & DRRH-1 Standard Phenol test Standard Phenol test Light Brown Brown Light Brown Brown Dark brown IR 62829B MTU 9992R & APRH-2 IR-62829A IR 58025A, IR 58025B, DRRH-1 KMR-3R, IR-40750R & KRH-2 Modified Phenol test with CuSo4 Modified Phenol test with CuSo4 Light Brown Brown Brown Dark brown MTU 9992R APRH-2 IR 58025A, IR 58025B, KRH-2 KMR-3R & IR 40750R Modified Phenol test with FeSo4 Brown Dark brown Black IR 58025A IR 58025B IR 40750R & KMR-3R GA3 test Low High IR 58025A KMR 3R Lane 1: APRH-2, 2: IR-62829A, 3: IR-62829B, 4: MTU-9992R, 5: KRH-2, 6: IR-58025A, 7: IR-58025B, 8: KMR-3R, 9: DRRH-1, 10: IR-58025A, 11: IR-58025B, 12: IR-40750R, M: Standard Protein Marker. 1 2 3 4 5 6 7 8 9 10 11 12 M Figure 5. Identification of rice genotypes based on chemical tests. Figure 6. SDS-PAGE for rice genotypes.
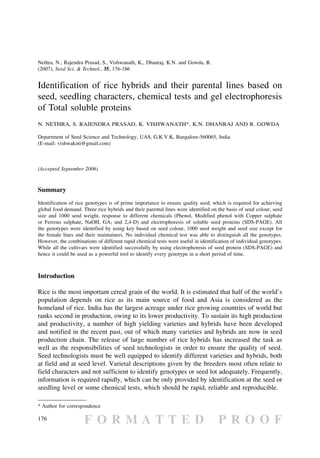
- 9. 184 F O R M A T T E D P R O O F N. NETHRA, S. RAJENDRA PRASAD, K. VISHWANATH, K.N. DHANRAJ AND R. GOWDA Table3.PresenceofseedproteinbandsatdifferentRelativemobility(Rm)inricehybridsandtheirparentallines. BandNo.RmAPRH-2IR-62829AIR-62829BMTU-9992RKRH-2IR-58025AIR-58025BKMR-3RDRRH-1IR-40750R 280.039+++++++-++ 270.059+++++++-++ 260.084++-+------ 250.107--------+- 240.119--------+- 230.238+++------- 220.259++++++++++++++++++++ 210.283+++-+++-+- 200.298++++++++++++++++++++ 190.333--------+- 180.358---------- 170.388++++++++++++++++++++ 160.411---------- 150.435++++++++++++++++++++ 140.456+++++++-+- 130.468+++------- 120.498+--------- 110.522--+------- 100.552--+++----- 90.589---------- 80.664---------- 70.688++++++++++++++++++++ 60.725++++++++++++++++++++ 50.755+-------++ 40.814----++---- 30.871+++++++-+- 20.925++++++++++++++++++++++++++++++ 10.97++++++++++ TotalNo.ofbands1816171415141381711 +:weak;++:medium;+++:highintensitybands
- 10. 185 F O R M A T T E D P R O O F IDENTIFICATION OF RICE HYBRIDS Lane1:APRH-2,2:IR-62829A,3:IR-62829B,4:MTU-9992R,5:KRH-2,6:IR-58025A,7:IR-58025B,8:KMR-3R,9:DRRH-1,10:IR-58025A, 11:IR-58025B,12:IR-40750R,M:StandardProteinMarker. Figure7.Electrophorogramsoftotalsolubleseedproteinofricegenotypes. TotalNo. ofbands18161714151413817141311 REGIONS A97,000Daltons (Phosphorylaseb) B68,000Daltons (Bovineresumalbumin) C43,000Daltons (Ovalbumin) D29,000Daltons (Carbonicanhydrase) E20,000Daltons (Soybeantrypsininhibit) F14,300Daltons (Lysozyme) 01 02 03 04 05 06 07 08 09 10 28–– 27–– 26–– 25–– 24–– 23–– 22–– 21–– 20–– 19–– 18–– 17–– 16–– 15–– 14–– 13–– 12–– 11–– 10–– 9–– 8–– 7–– 6–– 5–– 4–– 3–– 2–– 1–– BANDNUMBERS +123456789101112M
- 11. 186 F O R M A T T E D P R O O F N. NETHRA, S. RAJENDRA PRASAD, K. VISHWANATH, K.N. DHANRAJ AND R. GOWDA Acknowledgements Authors would like thank Indian Council of Agricultural Research (ICAR), New Delhi for providing grants and Directorate of Rice Research (DRR), Hyderabad, for providing seed material. References Anonymous (1954). Munsell soil colour charts, Munsell Color Macbeth Division of Kollmorgan Corporation, 2441, North Calvert Street, Baltimore. Banerjee, S.K., Chandra, S. (1977). Modified phenol test for the varietal identification of wheat seed. Seed Science and Technology, 5, 53–60 Bansal, R, Malik CP, Thind, SK. (1992). Effect of GA in some early cultivars at early seedling stage. Oryza, 29, 51–53. Chauhan, J.S., Nanda, J.S. (1984). Varietal identification in rice (Oryza sativa L.) by physico-chemical characters of the grain and electrophoretic variants of salt soluble seed proteins. Seed Research, 12, 78–79. Cooke R.J. (1987). The classification of wheat cultivars using a standard reference electrophoresis method. Journal of National Institute of Agricultural Botany, 17, 273–281. Cooke, R. J. (1993). Variety identification by electrophoresis. Seed Research., Special Volume 1, 369–371 Goyal, A.K. and Baijal, B.D. (1980). Response of certain rice varieties to GA at early seedling stage. Acta Botanica Indica., 8, 37–40 Grabe, F.D., (1957). Identification of soybean varieties by lab techniques. Proceedings of Association of Official Seed Analysis, 43, 105. International Seed Testing Association (1996). International rules for seed testing. Seed Science and Technology, 24, Supplement, 1-228pp. Jaiswal, J.P. and Agarwal, R.L. (1995). Varietal purity determination in rice modification of the phenol test. Seed Science and Technology, 23, 33–42. Laemmli, U.K. (1970). Sodium Dodecyl Sulphate-Poly Acrylamide Gel Electrophoresis. Nature (London), 227, 680. Pascual-villalobos, M.J., Oritz, J.M. and Coorreal, E., (1993). Morphometric characterization of seeds of Euphorbia lagascae. Seed Science and Technlogy, 21, 53–60. Sundaru, M. Baba, I., Tanabe, T., Tamai, F. and Matoda, Y., (1983). Varietal differences of Indonesian rice plants in their susceptibility to 2,4-D injury and inter-relationship with ethylene. Japanese Journal of Crop Science, 52, 323–330. Ramaiah, K. and Rao, M.B.V.N. (1953). In Rice Breeding and Genetics, ICAR, New Delhi. Vanangamudi, K., Palaniswamy, V. and Natesan, (1988). Variety identification in rice: Phenol and KOH tests. Seed Science and Technology, 16, 465–470. Varier, A., (1993). Identification of varieties of pearl millet and sunflower using electrophoresis methods. In: Plant Breeder’s rights seed certification and storage. Proceedings of Indo British Workshop, 20-22 February, 1992, IARS, New Delhi, Pp. 131-139 Walls, F.W., (1965). A standard phenol method for testing wheat for varietal purity. Hand Book of Seed Testing, AOSA, Contribution No. 28.