SlideShare a Scribd company logo
1 of 23
Download to read offline
DS-620 Data Visualization
Chapter 6. Summary
Valerii Klymchuk
July 29, 2015
0. EXERCISE 0
6 Vector Visualization
A vector is a tuple of n scalar components v = (v1, ..., vn), vi ∈ R. An n− dimensional vector describes, for
example, a position, direction, rate of change, or force in R . Most visualization software defines all vectors
to have three components. 2D vectors are modeled as 3D vectors with the third (z) component equal to null.
Vector fields are functions f : D → R , where D is a subset of R2
or R3
. Vector datasets are samplings
of vector fields over discrete spatial domains.
Computational fluid dynamics (CFD) solutions of a simulation consists of several datasets, each
for s different time step. For each time step, several attributes are computed and stored into the solution
dataset, such as velocity, pressure, density, flow divergence, and vorticity.
6.1 Divergence and Vorticity
Given a vector field v :R3
→ R3
, the divergence of v = (vx, vy, vz)1
is the scalar quantity
div v =
∂vx
∂x
+
∂vy
∂y
+
∂vz
∂z
.
If v is a flow field that transports mass, div v characterizes the increase or loss of mass at a given point
p in the vector field in unit time.
• A positive divergence at p denotes that mass would spread from p outward. Positive divergence points
are called sources.
• A negative divergence at p denotes that mass gets sucked into p (sinks.)
• A zero divergence at p denotes that mass is transported without getting spread or sucked, i.e., without
compression or expansion.
An equivalent definition of the divergence if v at a point p is
div v(p) = lim
Γ→p
1
|Γ| Γ
(v · nΓ) ds.
Here, Γ is a closed hypersurface (a curve for 2D vector fields and a surface for 3D vector fields) around
the current point p, |Γ| is the area (2D) or volume (3D) of the space enclosed by Γ, and nΓ is the outward
normal of Γ (see Figure 6.1(a)).
Vorticity rot v of vector field v is a vector quantity
rot v =
∂vz
∂y
−
∂vy
∂z
,
∂vx
∂z
−
∂vz
∂x
,
∂vy
∂x
−
∂vx
∂y
.
1
Vorticity, also called the curl or rotor of v2
is a vector field that is locally perpendicular to the plane of
rotation of v and whose magnitude expresses the speed of angular rotation of v around rot v. Hence, it
characterizes the speed and direction of rotation of a given vector field at every point.
Vorticity signals the presence of vortices - regions where the vector field locally circles around a point
called the vortex center. High vorticity and high divergence are typically complimentary. When combining
divergence and curl metrics in the construction of a visualization, it is useful to recall that div rot v = 0 for
any vector field v.
Phenomena called turbulent flow exhibits a pattern as high number of vortices and the alternation of
their spinning directions.
Streamwise vorticity Ω of a field v is the scalar quantity equal to the projection of rot v along v itself:
Ω =
v · rot v
||v||
.
It describes, how quickly v turns around itself.
Helicity is defined as one-half the scalar product of the velocity and vorticity vectors. It describes the
extend to which the vector field exhibits a corkscrew-like local motion. Helicity is a conserved quantity if
the flow is inviscid and homogeneous in density. In tornadoes the velocity and vorticity vectors tend to be
aligned.
To compute divergence and vorticity and related quantities we need the partial derivatives of the vector
field, which on a discrete dataset can be approximated using the formulas specific for every grid cell type
given in Section 3.7. However, derivatives, are sensitive to noise.
6.2 Vector Glyphs
The vector glyph mapping technique associates a vector glyph (or icon), with every sample point of the
vector dataset. Various properties of the icon, such as location, direction, orientation, size, and color are
adjusted to reflect the value of the vector attribute it represents (direction, orientation and magnitude).
Line glyphs. Lines show the position, direction, and magnitude of a set of vectors. Oriented line glyphs
sometimes also called hedgehogs. On a sample domain D, we associate a line l = (x, x + kv(x)) with every
sample point x ∈ D, that has a vector attribute v(x). The parameter k represents the scaling factor used to
map the vector magnitudes to the geometric domain.
High-resolution vector datasets must be subsampled in order to be visualized with hedgehogs. Ideally, a
glyph should be as large as possible, since larger glyphs have an easier perceivable direction. , but not too
large, so it would not intersect neighboring glyphs. If we scale all glyphs to the same size, this constraint is
easy to obey by scaling each glyph to the average cell size at its origin - this removes clutter.
Cone and arrow glyphs. Such glyphs are able to convey a signed direction. However, these glyphs also
take more space to draw, so they increase the clutter or require lower-resolution datasets. An interesting
effect of arrow is achieved by shading the line glyph from full color (or full opacity) at the origin to the
background color (or full transparency) at the line tip.
6.2.1 Vector Glyph Discussion
We say that the color mapping produces a dense visualization, where every pixel represents an interpolated
data value. In contrast, most glyph-based visualizations cannot draw one glyph at every pixel, since a glyph
takes more space, than just a pixel. All glyph visualizations share this discreteness. This affects the inverse
image-to-data mapping.
Vector glyphs in 2D
Scalar color-mapping techniques produce a piecewise linear visualizations. Glyph techniques produce a
purely discrete visualizations. In the first case, we do not have to mentally interpolate between drawn pixels,
as graphics has done this task for us. In the second case, we only have visual indication at the sample points
(i.e., cell vertices), so we must do this interpolation ourselves.
Another problem of vector glyph visualization is caused by the regular pattern of the sample points present
in uniform and rectilinear grids. The regular subsampling problem is present also when the subsampling
2
grid is not aligned with the original grid. By subsampling the dataset using a randomly distributed (instead
of regularly arranged) set of points, the problem can be alleviated.
Vector glyphs in 3D. Besides the known problems of glyphs in 2D, an additional problem of 3D glyph
visualization becomes apparent: occlusion. Using arrow instead of line glyphs only increases the occlusion
problem, as arrows have a larger screen area than lines. We can alleviate the occlusion problem by further
subsampling the dataset. A different way to tackle the occlusion problem is to draw the glyphs transparently.
Closer glyphs now cause less occlusion, allowing us to see deeper inside the dataset. An interesting effect
is achieved by using monochrome instead of color mapped, transparent line glyphs. The high velocity flow
core located at the center of the fluid flow is now easily visible as a dark region.
Vector glyphs on 3D surfaces. Glyph based visualization can be used also on 3D surfaces embedded
in volumetric dataset. First, we select a surface of interest from a given 3D dataset (i.e., velocity magnitude
isosurface of the vector field itself). Next, we draw vector glyphs at the sample points of the surface.
The interpretation difficulties caused by these problems can be partially overcome by techniques such as
random subsampling, carefully setting glyph length, etc.
6.3 Vector Color Coding
Similar to scalar color mapping, vector color coding associates a color with every point of a given surface
on which we have defined a vector dataset. The color is used to encode the vector orientation and direction
attributes. Vector color coding is easier to understand if we present colors in the hue-saturation-value (HSV)
system using color wheel. Every distinct hue corresponds to a different angle of the color wheel, saturation
is presented as a distance from the wheel center to a given color point. Value is usually represented as a
separate one-dimensional luminance parameter.
Color coding on 2D surfaces. The vector orientation is encoded in the hue and the vector length
in the value. The saturation parameter is set to one (we use only fully saturated colors). The color-coding
process is applied for every point of the dataset, similarly to the scalar color coding, either via texture or
polygon color interpolation.
Besides the directional color-coding, we can also directly encode the vector components vx, vy, vz into
colors. In this setting, a 3D vector is visualized by three separate scalar color-mapped fields. Although this
method is the simplest, it has limited effectiveness.
Color coding on 3D surfaces. Performing the inverse mapping from hue to 3D orientation visually
is generally a very challenging task. For example, we can be interested in seeing how much the actual flow
direction differs from the isosurface normal or, in other words, how far this isosurface is from a stream surface
tangent to the flow. For this we can color-code the angle between the surface normal (n) and the vector
data v, computed as :
α = arcos
n · v
||v||
.
The result is a scalar field that can be visualized with color mapping. On top of the colored isosurface, the
vector field itself is visualized with semitransparent glyphs.
6.4 Displacement Plots
Displacement plots show only the end points of a trajectory (vector glyphs show both points and a line
in-between.) Given a surface S ∈ D inside the domain D of a vector field, a displacement plot of S is a new
surface S given by the set of sample points
pi = pi + kv (pi),
where v is a vector field that controls the displacement of the surface and k is the displacement factor. In
the simplest example we can set v = v and displace the surface in the direction of the actual vector field
itself.
Displacement plots are sometimes called warped plots. Displacements plots produce a visually continuous
results. We can set s to ||v|| to show the magnitude of v, or respectively to v = sn to show the magnitude
in the direction orthogonal to our surface S.
3
Parameter settings. First, the displacement parameter k must be carefully set. Large numbers can
displace the displayed surface far away from its actual location.
A second important parameter is the shape and position of the surface to be warped. Planar surfaces
are often a popular choice. However, , the worst case takes place when the surface is almost tangent to the
vector field to be visualized. In this case, the warped surface stays in the same plane, as the original surface.
6.5 Stream Objects
Rather than a single visualization technique, stream objects are more of a family of such techniques,
related by the idea of visualizing the trajectory of some input object in a vector field over a given interval.
6.5.1 Streamlines and Their Variations
Time-dependent vector fields v : D × T are defined over some spatial domain D and time interval T.
That is at the same spatial position x ∈ D, the vector field v(x, t) can have different values at different time
moments t ∈ T. Time-independent, or stationary, vector fields v : D are defined over a spatial domain
D and do not change the value in time.
For time-independent vector fields, a streamline is a curved path starting from a given point x0 which
is tangent at v. Streamlines are defined for time-independent vector fields. If concept of time is mentioned,
it refers to the parameters τ and s, which can be thought of as integration time, and should not be
confounded with the physical time of a time-dependent dataset.
If we model a streamline as a parametric function Sstream(τ) = x(τ), where τ represents the arc-length
coordinate along the curve, then a streamline obeys the equation:
dx(τ)
dτ
× v(x(τ)) = 0.
This says, that the streamline point at position x is tangent to the vector field v(x) at the same position.
This can also be expressed in terms of the ordinary differential equation
dx(τ)
dτ
= v(x(τ)) = 0
with initial condition x(τ = 0) = x0 and with the constraint τ ∈ [0, Smax]. If we integrate over τ, we obtain
the streamline
Sstream = {x(τ), τ ∈ [0, Smax]}, x(τ) = x(0) +
τ
s=0
v(x(s)) ds, with x(τ = 0) = x0.
In case of time-dependent vector fields v(x, t), several types of curves can be integrated in the vector
field. First and simplest, can be computed by freezing the physical time t to a desired value tfixed and
using Equation 6.10 to compute the curves that a particle would follow in v(x, tfixed). A second option is to
compute the actual path x(t) of a particle in the time-dependent vector field, given by
dx(t)
dt
= v(x(t), t) = 0
starting from a given point x(t0) = x0 This is nothing but applying Equation 6.9 while making the integration
time τ run in sync with the physical time t. The emerging curves Spath = x(t) are called particle traces,
or pathlines. They describe the actual trajectory, over physical time, that a particle released at x0 follows
in the time-dependent vector field.
Streaklines. For time-dependent vector fields, we can define a different type of curve besides pathlines.
Imagine, ink being continuously released from x0, being advected in the vector field v(x, t) yielding a time-
dependent curve, moved with the flow. Streakline as a time-dependent curve Sstreak = x(τ, t), where τ is
the arc length coordinate along the streakline for a fixed time t. Then we have:
dx(τ, t)
dt
= v(x(τ, t))
4
x(τ = t, t) = Spath(τ), x(0, 0) = x0
The end point (for τ = t) of a streakline coincides with the end point of the pathline starting at the same
seed point x0 and running for time t.
Note that, for stationary vector fields, all above concepts (streamlines, pathlines, and streaklines) are
identical, i.e., they lead to the same curves.
Computing streamlines. Several numerical methods solve Equation 6.10 approximately by discretizing
the time t and replacing the integral with a finite sum. The simplest, but also least accurate, method is the
Euler integration, given by
T
t=0
v(x(t)) dt
N=T/∆t
i=0
v(xi)∆t,
where xi = xi−1 + vi−1∆t. The points xi sample the streamline starting from the seed point x0. The Euler
integration considers the vector field v to be spatially constant and equal to v(xi) between every sample
point xi and the next one xi+1. Hence, the streamline will be approximated bya a piecewise-linear curve, or
polyline (x0, ..., xN ).
The streamline is saved as as a polyline into an unstructured grid s. The tails of long streamlines tend
to deviate from the actual correct location. A frequently used replacement for the Euler integration is the
Runge-Kutta method. This method approximates the vector v between two sample points xi and xi+1
along a stream object with the average value v(xi)+v(xi+1)
2 . This method produces more accurate streamlines
than the Euler method for the same step ∆t.
Finding optimal values for ∆t is, in general, a difficult problem. A simple way to alleviate the problem
is to adapt ∆t locally to the vector field magnitude so that the spatial integration step ||v||∆t has constant
length. Setting ∆t so that this length is smaller than the current cell size ensures that no vector samples are
skipped during the integration. In practice, spatial integration steps of around one-third of a cell size should
yield good results for most vector fields.
Stop criterion. An intuitive stop criterion for integration is to set a maximal length for the streamline,
e.g., as a fraction of the domain size. Separately, the integration process should be stopped when the vector
field magnitude ||v becomes zero (drops under some small ), since the trajectory comes to an end there.
Geometry. When using small ∆t values (for precision), this would generate too densely sampled stream-
lines that take large storage space. An optional solution is to use distance travelled so far along the integration
path (variable l) to determine the addition of new sample points: given a user specified minimal distance
∆l, we add a new streamline point whenever l has increased with ∆l from the last added point. This way,
the time sampling ∆t and spatial sampling ∆l can be controlled independently.
Streamline seeding.A crucial issue foe the effectiveness is the choice of the location and number of seed
points. A variant of a question is: “show all points on the trajectory ending here”. This can be achieved by
using negative ∆t values, i.e., tracing the streamline upstream. By tracing both upstream and downstream
streamlines, we can answer another question: “show all points on the trajectory passing through here.”
A different strategy for the seed point distribution is to densely sample the complete dataset instead
of only some given area (seed area). The aim of this strategy is to produce visualization that answer the
question: “show the complete dataset with streamlines.” The resulting visualization should have several
properties, as follows:
• Coverage: Every dataset point should be at a minimal (small) distance from some streamline, stream-
line should cover all important flow features (features of the vector field that are of interest for a given
user in a given application context), so that relevant features are reflected in visualization.
• Uniformity: The density of the streamlines in the final image should be confined between some minimal
and maximal values. If we have too many streamlines over a given area, cluttering will occur. If we
have too few, then undersampling occurs.
• Continuity: Longer streamlines are preferred over short ones, as they produce less discontinuous, easier
to interpret, visualizations.
Several sampling strategies are possible to create dense streamline visualizations. The simplest solution
is to distribute the seed points regularly or randomly in the domain and trace streamlines of some minimal
length. This solution gives good coverage but can lead to cluttering. A better solution is to trace a streamline
5
untill it gets closer to any of the already traced streamlines or itself than a user specified distance, minimizing
cluttering and combine it with maximizing the streamline average length. A simple to implement method
was proposed by Jobard and Lefer. This method produces all streamlines in a single pass, but has tendency of
favoring short streamlines instead of potentially longer ones, and also does not guarantee a uniform coverage
of the domain. Turk and Banks method generates on average longer streamlines, but is more complex to
implement and is slower. It starts with small streamline fragments which are iteratively merged, shortened,
lengthened, or new created, until the desired uniform coverage is obtained.
A different method for creating evenly distributed streamlines for 2D vector fields is the farthest point
streamline seeding (FPSS). It starts iterating new streamlines as far away as possible from the existing
ones. Such streamlines have the greatest chance of achieving maximal length before getting too close to
existing ones, since they start far away from the latter. FPSS computes a Delaunay triangulation of all
sample points of already added streamlines. The center of the largest circumscribed circle of all these
triangles is a good estimate for the center of the largest existing cavity and is a good estimate for the next
streamline seed point to place. The method is simple to implement and generates densely seeded streamlines
images for large 2D vector fields in a matter of seconds.
As an additional display enhancement, streamlines can be rendered using tapering, i.e., thicker close
to their midpoints and thinner close to their start and end points. This creates a visually more uniform
coverage of the data domain with ink.
One approach for 3D vector fields is to generate seeds on a curved surface embedded in 3D, backproject
these seeds into 3D, and trace streamlines from these 3D seed points. Streamlines are next selected for
rendering if their screen-space projections are evenly spaced. A simpler, and visually more effective solution
is to work entirely in image space. Given a 3D seed surface S3D, we project the vector field, restricted
to S, to the 2D image plane. Next, we apply the 2D evenly-spaced stream generation (of Jobard and
Lefer) to the projected vector field over the 2D projection S2D of S3D. Additional care needed to prevent
that the generated 2D streamlines stop at the points of S2D where the depth to the image plane exhibits
discontinuities, so that streamlines do not jump between parts of the surface which are close on S2D but far
away on S3D.
6.5.2 Stream Tubes
We can use other shapes i.e., stream tubes to visualize the integral trajectories. These can be constructed by
sweeping a circular section along the streamline curve computed as described previously. At every streamline
point, the cross section is kept orthogonal to the streamline tangent vector.
The thickness, or radius, parameter of stream tubes can be also used to convey some extra information,
i.e., to modulate the tube radius to map a scalar value along the stream tubes, such as temperature, density,
viscosity, or pressure, but also flow-related quantities, such as vorticity.
An interesting effect can be obtained by modulating both the tube radius and color as functions of the
normalized tube length. For every seed point we trace a stream tube whose radius varies linearly from some
maximum value Rmax to 0 and whose luminance varies from black to white. The luminance and radius
visual cues enhance each other to convey an arguably better insight, than the plain streamlines.
6.5.3 Streamlines and Tubes in 3D Datasets
The streamlines get colored by the velocity magnitude using blue-to-red colormap. We undersample first
at a certain rate and use a maximal streamline length of 100, which is close to the size of the domain’s
length. Increasing streamline density makes flow structure easier to follow. Occlusion problem can be solved
by lowering the transparency of the streamlines to 0.1. Finally, we can trace streamlines until a maximal
time of 100 is reached. We now obtain many very short streamlines in the low speed areas. This lets better
visualize the flow’s high-speed inner core.
Being 3D objects, stream tubes have the extra advantage of providing some shading and occlusion cues,
which allow us to better determine their actual relative position and orientation in 3D vector visualizations,
as compared to plain streamlines drawn as 1D curves.
6
6.5.4 Stream Ribbons
The visual cues we look for are stream tubes that twist around each other, yet stay close to each other. We
can use a visualization technique called stream ribbons. A ribbon is created by launching two streamlines
from two seed points close to each other. The surface created by the lines of minimal length with end points
on the two streamlines is called a stream ribbon. If the two streamlines stay relatively close to each other
then the stream ribbon’s twisting around its center curve gives a measure of the twisting of the vector field
around the direction of advection. We can color ribbons with the streamwise vorticity using blue-to-red
colormap, and two streamlines that form the edge of each ribbon are visualized with stream tubes.
6.5.5 Stream Surfaces
We saw how stream ribbons, densely seeded on a given curve, can be used to visualize how that curve would
be advected in the vector field. Given a seed curve Γ, a stream surface SΓ is a surface that contains Γ
and is everywhere tangent to the vector field. For stream tubes, the seed curve is a short closed curve such
as a circle. For the stream ribbons - short line segment. The flow described by the vector field is always
tangent to the surface, i.e., cannot cross it. Hence, stream surfaces whose seed curves intersect the flow
domain boundary or are closed curves can be used to segment the flow domain into disjoint regions that
exhibit noninterfering flow patterns.
A simple approach to construct a stream surface by tracing densely seeded streamlines from the seed
curve. Next, the traced streamlines are connected to generate the stream surface. Points on all streamlines
that have the same traveled distance value are next connected.
A different approach that avoids the mesh construction challenges is to define the stream surface im-
plicitly. Given a 3D vector field domain Ω ⊂ R3
, we first define a scalar function f∂Ω : ∂Ω → R on the
boundary ∂Ω of Ω. f should be defined so that one or several isolines over ∂Ω correspond to our seed curve(s)
of interest Γ. Next, from each point x of the discretization of Ω, a streamline S is traced backwards in the
vector field. If S hits ∂Ω at some point y after a given amount of time, the value f(y) is assigned to all
points along it in Ω. After all points of Ω have been thus visited, we obtain a scalar field fΩ : Ω → R. Next,
the desired stream surface corresponding to Γ can be easily extracted as an isosurface of fΩ corresponding
to the value that Γ takes over ∂Ω, using for example the marching cubes algorithm. This method cannot
extract stream surfaces, which do not pass through the boundary of the dataset.
6.5.6 Streak Surfaces
Given a seed curve Γ, a streak surface SΓ is a surface that contains all massless particles that pass through
Γ, a streak surface Γ at different time moments, or, in other words, the (time-dependent) locus of dye
advected in the flow that originates at Γ. Streaklines are traced in the flow starting from a densely sampled
representation of the seed curve Γ. The streak surface is then constructed by connecting streaklines for
adjacent seeds to yield a quad mesh.
Apart from the additional challenges posed by highly divergent and/or convergent flow regions already
outlined for stream surfaces, streak surfaces are computationally much more dependent.
6.6 Texture-Based Vector Visualization
By their very nature, discrete visualizations cannot convey information about every point of a given dataset
domain. Texture-based visualizations present a user with a (piece-wise) continuous signal that can be
easier to interpret. The idea is to create a texture signal that encodes the direction and magnitude of a
vector field in the various texture parameters such as luminance, graininess, color, and pattern structure.
Using texture graininess for encoding vector direction into the texture parameters is a good idea.
Line integral convolution. For each pixel p of the domain, we trace a streamline S(p, s) upstream
and downstream through p for some maximal distance L. We set the value T(p) of the output texture T at
the current location p to be the weighted sum of the values of the input noise texture N measured along
the streamlines S(p) that passes through every pixel p. As a weighting function k(s) : R → R+, we can use
a Gaussian k(s) = e−s2
, or other functions that are 1 at the origin and decay smoothly and symmetrically
7
from the origin until they reach near-zero values at the maximal distance L. The obtained value T(p) is
T(p) =
L
−L
N(S(p, s))k(s) ds
L
−L
k(s) ds
.
We can think of this process as blurring, or filtering, the noise image along the streamlines with a set of
filters k(s) that are aligned with the streamlines. The filtering operation can be seen as a convolution of the
noise and filter functions N and k. This process is known as line integral convolution (LIC).
Using smaller values for L creates textures increasingly similar to the input noise. Using larger values
for L increases the length of the perceived snake-like texture patterns.
6.6.1 IBFV Method
Image Based Flow Visualization method (IBFV) produce not just static, but animated, flow textures
in real time, can handle both stationary and instationary fields defined on domains ranging from planar 2D
to volumetric ones.
Consider a time-dependent scalar property, such as the image intensity. The value I(x, t) → [0, 1]
describes our property at a given point x ∈ D of the flow domain D at a time moment t. The advection in
time of the property I in a vector field v : D × R+ → R2
is given by
I(x + v(x, t)∆t, t + ∆t) = I(x, t).
This process is sometimes called forward advection, as it states that the property I at a location
x + v(x, t)∆t downstream and at a future moment t + ∆t is equal to the current property I(x, t) at the
current moment t. We would like to advect a noise texture so that we obtain an image with low contrasts
along a pathline and high contrasts across neighboring streamlines.
We can add an injection term, which can be seen as ink or dye that is injected into the flow domain at
every point x in space and moment t in time.
I(x + v(x, t)∆t, t + ∆t) = (1 − α)I(x, t) + αN(x + v(x, t)∆t, t + ∆t).
Here, N(x, t) describes the injected property, which is also a function of space and time. Setting α to a
value between 0 and 1 yields an image that exhibits both local variations (due to injected noise) and also
coherence along pathlines (due to advection). A value of α = 0 states that there is no injection. Good values
in practice are α ∈ [0, 0.2].
Let us consider a time independent signal N(x), consisting of black and white dots, the size d of the dots
should be correlated with the velocity magnitude. In practice, using a dot size d ∈ [2, 10] pixels gives a good
result.
Let us take a time-dependent noise texture N (x, t) that is obtained from our original stationary noise
texture N(x) as
N (x, t) = f((t + N(x) mod 1)
The intensity of every pixel x of the time-dependent texture N(x, t) oscillates in time controlled by the
periodic function f, but all pixels have different (random) initial phases controlled by the static noise N(x).
Using N instead of N produces an animated texture that seems to move with the flow, an effect that is
especially suited for visualizing time-dependent vector fields v(x, t).
6.6.2 IBFV Implementation
6.6.3 IBFV Examples
Streamlines are often used in exact engineering applications where one wants accurately determine the
trajectory of a point starting from a precisely specified seed location. Ink advection is useful in getting
insight into how the flow from a given seed area spreads out over a larger domain. Placing differently colored
ink sources at the sources of a flow field, i.e., the points of high positive divergence and letting them get
advected until the process visually converges will produce an image showing the flow domain decomposed
8
into several spatial components colored differently as a function of their corresponding source. The curves
that separate these areas are called separatrices and are important advanced concept in the study of vector
fields.
To be able to see through 3D dense flow texture, the injection step is modified in the 3D case by adding
alpha, or transparency, noise to the grayscale noise. The alpha noise plays the role of “erasers” injected in
the flow domain, yielding a sparsely filled visualization that lets one see through the flow domain.
6.7 Simplified Representation of Vector Fields
Regions that exhibit important characteristics for an application area, such as vortices, speed extrema, or
separation lines between regions of laminar flow, should be visualized in different ways as compared to the
less-important regions, in order to help users detect their presence in a dataset. Such regions are also called
features of the vector field.
Dense visualizations can suffer from occlusion, therefore using simplified version of the vector field
is beneficial for large datasets if simplification emphasizes the features and removes a large amount of
uninterested data.
6.7.1 Vector Field Topology
Which are the regions of the 2D flow domain from where the flow is gathered by a sink, respectively which
are the regions reached by flow from a source?
Consider the vector field defined by a function v : D ⊂ R2
→ R2
. First, we define all so-called critical
points of the field, i.e., points where the vector field magnitude ||v|| is zero. Assuming that the vector field
is continuous, these will include all sources, sinks, and a number of additional point types. To discriminate
between the different types of critical points, we compute the Jacobian matrix of the field v defined as
J =
∂vx
∂x
∂vx
∂y
∂vy
∂x
∂vy
∂y
J is computed at each point x ∈ D. Next, we evaluate the eigenvalues and eigenvectors of J. It can be
shown that a vector field has the six types of critical points, which can be discriminated from each other
based on the signs of the real and imaginary parts of λ1 and λ2. We see that negative values of Re describe
attraction, while positive values of Re describe repulsion, while nonzero values for Im describe rotation.
After having classified critical points, we consider now the small region surrounding such a critical point c.
Such a region can be divided into several compact sectors Si of three types, based on behavior of streamlines
which pass through that sector:
• Parabolic sectors: Streamlines in Si have one end at c
• Elliptic sectors: Streamlines have both ends at c
• Hyperbolic sectors: Streamlines in Si do not pass through c.
The streamlines that separate such sectors, or constitute sector borders, are called separatrices. To
compute separatrices we first observe that saddle points are a special case, where exactly four separatrices
meet. The algorithms for computing separatrices from a given 2D field can proceed by linking saddle points
to other streamline endpoints, as follows:
1. Compute and classify all critical points
2. For all saddle points s, start tracing two streamlines in the directions of their eigenvectors having
positive Re values.
3. Stop tracing when the streamline hits the boundary of D or another critical point where ||v|| = 0.
4. Merge curves that start and end between the same endpoints.
The output of this algorithm is a graph whose nodes are critical points or points where streamlines leave
the computational domain, and edges are the respective separatrices.
9
Since all our computations are done using interpolated data, the conditions on the real and imaginary
components of eigenvalues of the Jacobian are naturally subject to numerical errors. In practice these
conditions are relaxed to compare Re and Im with finite-size, nonzero, threshold values. A way to simplify
a visualization is to cluster or merge critical points which are close to each other within a small spatial
distance.
6.7.2 Feature Detection Methods
Feature detection methods reduce the vector field to a set of features of interest, described as a set of
parameters, such as feature type, position, extent, and strength. It is hard to define precise numerical criteria
to detect such features, like it is hard to quantify the presence and/or absence of a vortex. Second, features
appear at different spatial scales in vector fields. Finally, there is often no clear spatial separation between
a feature and a non-feature area or between several features of the same or different types.
6.7.3 Field Decomposition Methods
The third class of methods is formed by field decomposition methods. Such methods partition the vector
dataset into regions of strong intraregional (internal) similarity and weak interregional similarity. At the
core of such methods is a similarity metric f that defines how similar two regions are. A frequently used
similarity metric compares the direction and magnitude of the vector data. Two regions are considered
highly similar, if the vector field has the same orientation and magnitude on both regions, and dissimilar
otherwise. After choosing the metric, decomposition method usually perform a top-down partitioning or
bottom-up agglomerative clustering of the dataset. In the top-down case, the dataset is recursively
split in regions that have the least similarity. In the bottom-up case, we start with each sample point (or
equivalent small area) being a different region and iteratively cluster the most similar regions. Both methods
produce a multi-scale representation of the vector dataset that can be seen as a tree with the smallest regions,
or data samples, as leaves and the whole dataset as the root region.
Top-down decomposition subdivides one original cluster containing all the points using a weighted
best-fit plane so that variance of an error metric over its two children is minimized. For each cluster, a
representative vector is computed as the average of the vector samples in that cluster.
Bottom-up decomposition. We begin clustering by defining, for every point pj of the dataset, a region
Rj = (pj, v(pj), pi) containing the point and its vector attribute that has the origin at the point itself. The
complete region R = {Ri} is next simplified iteratively by clustering, at every step, the two most similar
regions Ra ∈ R, Rb ∈ R to form a new region Rab. This new region contains the union of all points in
Ra and Rb and a vector v(Rab) that should best reflect merging of Ra and Rb. A simple way to compute
v(Rab) is as the average of v(Ra) and v(Rb). weighted by the number of points |P(a)| and |P(b)| in the
merged regions. The origin O(Rab) of v(Rab) can be computed similarly by weighted averaging. Finally, we
set Ra and Rb as children of Rab, so that a binary region tree, or dendrogram, gets constructed during
the clustering. From initial R”, the clustering creates region sets R1
, ..., RF
until reaching a final region set
RF
that contains a user-specified number of N regions. These regions are roots of several region trees
that encode the clustering. We can use these trees to obtain several types of simplified representations of
our vector field. A simplified representation, or s-rep, is a region set R = {R1, ..., Rk} of k disjoint
regions where each Ri is a node in a different region tree described earlier and whose union ∪k
i−1Ri covers
the complete dataset.
Multiscale decomposition is a more sophisticated clustering technique, which employs mathematical
tool called the algebraic multigrid (AMG). Given a vector dataset that has an underlying grid with n
sample points p1, ..., pn, we define a so-called coupling matrix M = {mij}1<i,j<n. Given two points pi and
pj, the entry mij essentially encodes the similarity metric f between the vector values v(pi) and v(pj) as
follows:
mij =



f(pi, pj), pi, pj are grid neighbors,
1 − k∈neighbors(i) mik, i = j,
0, otherwise.
The diagonal entries mij describe the so-called self-coupling, which is set so that the sum of couplings of
a point with all other points is 1.
10
The preceding matrix M describes the finite element discretization of an anisotropic diffusion operator
using piecewise linear basis functions. Given some domain D ∈ Rn
, the equation
∂tu − div (A u) = 0
describes the diffusion in time of a scalar function u : D × [0, ∞) → R starting from an initial value u(t = 0).
The discretization of the operator div(A u) produces our matrix M. In finite element terminology, M is
called a stiffness matrix, a term that suggests the metaphor of coupling of the grid points. IT encodes the
vector field structure on the finest level given by the dataset grid. Given a matrix M, AMG constructs a
sequence of matrices M0
= M, M1
, ..., Mk
, starting with the size S of the matrix M0
until the final matrix
Mk
, which has size 1, i.e., is a scalar value. This reduction in size is done by eliminating matrix entries
involved in weak couplings and merging neighboring entries involved in similar strong couplings. This process
is similar to the bottom-up agglomerative clustering described above.
Multiscale IBFV.
Consider again the original fine-scale IBFV noise N(x, y, t) that was sampled on a n × n image. Every
pixel of this image can be seen as being represented by a constant basis function ψi which is 1 over that
pixel and zero elsewhere. Hence, the noize term from equation (6.16) can be rewritten as
N(x, y, t) =
n2
i=1
ψi(x, y) f ((t + 1) mod 1) .
Here, f(t) is exactly the same periodical function as in equation 6.17, Ni is the noise phase of the i th region
corresponding to ψi, which is equivalent to the per-pixel noise phase N(x). We can generalize and define a
multi-scale noise signal
N(x, y, t) =
sj
i=1
ψj
i (x, y) p (t + ri) .
Here we use the basis functions on any level 1 < j < k of the AMG decomposition.
By replacing the initial fine-scale noise N(x, y, t) with any of the multiscale noise signals Nj
(x, y, t) defined
by equation 6.23, we obtain a multiscale image-based flow visualization, or MIBFV method. MIBFV keeps all
the strong points of its predecessor (dense field representation, real-time animation, intuitive representation,
simple implementation) and adds a spatial multiscale aspect that emphasizes the vector field features at a
user-chosen scale k.
MIBFV is less suited to visualize time-dependent vector fields than IBFV. If the vector field changes, we
must re-run the AMG decomposition and noise texture computation after every time step.
6.8 Illustrative Vector Field Rendering
Illustrative vector visualizations use simple, well understood, visual metaphors for depicting vector fields.
On the other hand, they use various rendering effects to simplify the perceived complexity of the final image,
thereby making it easier to grasp.
Depth-dependent halos.Given a set of streamlines, represented as curves, the method creates polygon
strips of small constant width ∆, centered around the individual streamlines. These streams are similar
to stream ribbons. However, in contrast to ribbons, they are oriented parallel to the viewing plane, using
technique, known as billboarding. Also, their depth is modulated linearly from being equal to the depth
coordinates of the visualized streamlines to a slightly lower value. Additionally strips are textured with a
one-dimensional monochrome texture that assigns a fixed base color (black) to a narrow band δ around the
center (streamline location) and white to the rest. When rendering these strips, the strips which are closer
to each other than the value δ get visually merged and appear as a single compact shape rendered in the
base color. Strips which are farther away from each other that δ in terms of depth, however, will show a
distinct “halo”, as strips closer to the viewer visibly obscure further strips and get delineated by a white
border.
Depth-dependent halos can show a much larger amount of streamlines, with limited clutter and good
depth perception, even if the rendering is monochrome. Also, streamlines which are close to each other
get locally merged into thick black “bundles”, thereby creating an effective image-space simplification and
clutter reduction of the rendering.
11
6.9 Conclusion
Methods range from simple (vector glyphs) up to multiscale textures animated in real time (MIBFV. In
recent years, new families of vector field visualizations techniques were created that exploit animation and
dense visual representations, such as textures, as opposed to the “classical” vector field visualizations that
use sparse geometric primitives, such as glyphs, streamlines, and stream surfaces.
Two-dimensional surfaces permit a straightforward mapping to the 2D graphics viewpoint, which simpli-
fies visualization problem. Three-dimensional volumetric vector fields pose a much more challenging problem
due to the inherent occlusion of the visualization primitives, especially in case of dense visualizations. Ani-
mation is an intuitive means of representing the time-dependent aspect.
What have you learned in this chapter?
In this chapter author discusses a number of popular visualization methods for vector datasets: vector
glyphs, vector color-coding, displacement plots, stream objects, texture-based vector visualization, and the
simplified representation of vector fields.
Section 6.5 presents stream objects, which use integral techniques to construct paths in vector fields.
Section 6.7 discusses a number of strategies for simplified representation of vector datasets. Section 6.8
presents a number of illustrative visualization techniques for vector fields, which offer an alternative mech-
anism for simplified representation to the techniques discussed in Section 6.7 Chapter presents also feature
detection methods, algorithm for computing separatrices on field’s topology, and top-down and bottom-up
field decomposition methods.
What surprised you the most?
• That a very important domain for vector visualization is computational fluid dynamics (CFD).
• That besides planes, other geometric objects can also be used to create displacement plots: like sphere
and box for example.
• That Multiscale IBFV (MIBFV) visualizations of a field can vary depending on its coarse-scale.
What applications not mentioned in the book you could imagine for the techniques ex-
plained in this chapter?
Lowering opacity (increasing transparency) of streamlines or tubes alleviates occlusion problem in 3D
Datasets. Imagine a rendering technique, which computes transparency for each pixel of a 3D scene based on
the viewpoint, so that streamlines or tubes closer to the front viewing plane get higher transparency (since
they are already in front of our eye - relatively easy to see); and parts or pixels farthest from the viewpoint
get rendered with the lowest transparency levels (far corners are harder to see since they get blocked with
items from the front of the scene). Using translucent elements (of depth-dependent opacity for the scene
observed) might improve our ability to see through volumetric data.
In order to visualize “multidimensional” information we can use glyphs with multiple (10 or more) degrees
of freedom, as a multidimensional animated textures.
By subsampling the dataset using a randomly distributed (instead of regularly arranged) set of points
we can alleviate the subsampling problem, when subsampling grid is not aligned with the original grid.
1. EXERCISE 1
Consider a scalar field f(x, y) → R. The gradient f is a vector field, so we can compute its vorticity,
v = rot( f). What is the value of v?
Hints: Use the definitions of the gradient and vorticity based on partial derivatives of f.
Gradient f is a 2-component vector: v = (vx = ∂f
∂x , vy = ∂f
∂y ).
Our 2-component gradient vector field can be seen as a 3D vector: v = (vx, vy, vz = 0), which exists
only on a plane vz = 0, where vx, vy are independent from z, meaning
∂vy
∂z = ∂vx
∂z = 0.
The vorticity is a 3D vector quantity rot(v) = rot( f) = ∂vz
∂y −
∂vy
∂z , ∂vx
∂z − ∂vz
∂x ,
∂vy
∂x − ∂vx
∂y
There fore in our case we get the following value:
rot(v) = 0, 0,
∂vy
∂x
−
∂vx
∂y
= 0, 0,
∂2
f
∂y∂x
−
∂2
f
∂x∂y
= (0, 0, 0) = 0.
12
In other words, rot (grad v) = 0 for any vector field v.
2. EXERCISE 2
Consider now a 2D vector field v(x, y), and its vorticity rot v(x, y). We now compute the divergence field
d = div(rot v). What is the value of d?
Hints: Use the definitions of divergence and vorticity based on partial derivatives of a function of two
variables.
Let’s look at our field in 3D: v(x, y) = (vx, vy, vz = 0)
rot v(x, y) = (sx, sy, sz) =
∂vz
∂y
−
∂vy
∂z
,
∂vx
∂z
−
∂vz
∂x
,
∂vy
∂x
−
∂vx
∂y
.
d = div (rot v) =
∂sx
∂x
+
∂sy
∂y
+
∂sz
∂z
In our case : d = ∂vz
∂y∂x −
∂vy
∂z∂x + ∂vx
∂z∂y − ∂vz
∂x∂y +
∂vy
∂x∂z − ∂vx
∂y∂z = 0.
In other words, div (rot v) = 0 for any vector field v.
3. EXERCISE 3
Consider the following three 3D vector fields:
v1(x, y, z) = (−y, x, 0) (4.1)
v2(x, y, z) = (y, x, 0) (4.2)
v3(x, y, z) = (3x, 3y, 0) (4.3)
Plot these three vector fields using hedgehog glyphs (oriented arrows) for a square domain centered at
the origin and embedded in the x y plane.
13
Figure 1: Glyph visualization of a 2D vector field v1(x, y, z) = (−y, x, 0) on [−10, 10] × [−10, 10] domain
with scaling factor 0.1.
14
Figure 2: Glyph visualization of a 2D vector field v2(x, y, z) = (y, x, 0) on [−10, 10] × [−10, 10] domain with
scaling factor 0.1.
15
Figure 3: Glyph visualization of a 2D vector field v3(x, y, z) = (3x, 3y, 0) on [−10, 10] × [−10, 10] domain
with scaling factor 0.035.
4. EXERCISE 4
Consider the following three 3D vector fields (the same ones as for Exercise 3):
v1(x, y, z) = (−y, x, 0) (4.1)
v2(x, y, z) = (y, x, 0) (4.2)
v3(x, y, z) = (3x, 3y, 0) (4.3)
Which of these three fields has a zero curl? Which has a zero divergence? Argue your answer by
computing the actual divergence and curl values.
16
div v1 =
∂(−y)
∂x
+
∂(x)
∂y
+
∂(0)
∂z
= 0 + 0 + 0 = 0
div v2 =
∂(y)
∂x
+
∂(x)
∂y
+
∂(0)
∂z
= 0 + 0 + 0 = 0
div v3 =
∂(3x)
∂x
+
∂(3y)
∂y
+
∂(0)
∂z
= 3 + 3 + 0 = 6
rot v1 = 0, 0,
∂(x)
∂x
−
∂(−y)
∂y
= (0, 0, 2) = 2
rot v2 = 0, 0,
∂(x)
∂x
−
∂(y)
∂y
= (0, 0, 0) = 0
rot v3 = 0, 0,
∂(3y)
∂x
−
∂(3x)
∂y
= (0, 0, 0) = 0
5. EXERCISE 5
Vector field visualization is considered to be, in general, a more challenging problem than scalar visual-
ization. Indeed, intuitively speaking, for a sampled dataset of, say, N points, a scalar field would have N
values, whereas a (3D) vector field would have 3N values to show. Consider now the case of visualizing a
scalar field with N samples vs visualizing a 3D vector field with N/3 samples. Both fields need to store the
same amount of data values, i.e., N. Which of the following assertions do you support for this situation:
• Visualizing both fields is, in general, equally challenging
• Visualizing the vector field is, in general, more challenging than visualizing the vector
field.
Support your answer with a detailed explanation.
Visualizing a scalar field with N samples is relatively easy, and can be implemented with height plots,
and number of samples provides a good sampling rate. Visualizing vector fields is a harder task, since 3D
signal can have more complex topography, it usually requires a higher sampling rate as well, which in our
example is going to be compromised by lowering number of samples. This can compromise the effectiveness
of 3D visualization, since computing normals, derivatives, isolines, and streamlines can be sensitive to errors
due to interpolation.
6. EXERCISE 6
Consider a smooth 2D scalar field f(x, y), and its gradient f, which is a 2D vector field. Consider now
that we are densely seeding the domain of f and trace streamlines in f, upstream and downstream. Where
do such streamlines meet? Can you give an analytic definition of these meeting points in terms of values of
the scalar field f?
Hints: Consider the direction in which the gradient of a scalar field points.
They can meet in critical points, such as sinks, sources, where ||v|| = 0 and values of f are close to
maxima or minima.
7. EXERCISE 7
Consider a smooth 2D scalar field f(x, y), and its gradient f, which is a 2D vector field. Consider now
the divergence d = div ( f), also called the Laplacian of f. What is the relation between the local extrema
(minima and maxima) of f and those of d ?
In local extrema of f 2D gradient f = 0 equals to zero and changes its sign. Divergence d = div( f)
is a scalar ∂( fx)
∂x +
∂( fy)
∂y = ∂2
f
∂x2 + ∂2
f
∂y2 .
None of the above statements is true. Extrema of gradient field and extrema of scalar field do not have to
coexist. They do share the same location, in case if following condition holds: ∂3
f
∂x3 + ∂3
f
∂y3 + ∂3
f
∂y2∂x + ∂3
f
∂x2∂y =
∂2
f
∂x2 + ∂2
f
∂y2 = 0.
17
8. EXERCISE 8
Can any 2D vector field v(x, y) be seen as the gradient of some scalar field f(x, y)? That is: Given any
vector field v, can we find a scalar field f, so that v(x, y) = f(x, y), for all points (x, y)? If so, argue why,
and show how we construct f from v. If not, show and discuss a counter-example.
Hints: Consider the vector calculus identities involving curl and gradient.
Yes, for our vector field v(x, y) = (vx, vy) we can assign our scalar f to be f = vxx + vyy, so that
f = (∂f
∂x , ∂f
∂y ) = (vx, vy)
9. EXERCISE 9
Intuitively, we can think of the (mean) curvature of an oriented 3D surface as a scalar function, defined
on the surface, which takes large positive values where the surface is convex, large negative values where the
surface is concave, and is zero where the surface is locally flat. How can we compute such a scalar curvature
function using just the vector-field defined by the surface normals?
We can compute such curvature by calculating gradient n (derivative) of the vector normal n =
(nx, ny, nz), which defines our field v(x, y, z). Gradient n can describe the variation of surface normal
at each point z = f(x, y), and clearly can be used as a measure of curvature. We can use cross product
n× n to compute the rate of change of the surface normal, or acceleration, measured by the derivative of the
tangent vector (the second derivative) as k = ||f (u)×f (u)||
||f (u)||3 . where f (u) = −(nx, ny). Note: 1/||f (u)||3
= n3
z
and ||f (u) × f (u)|| = ||n(u)×n (u)||
n3
z
, so that k = ||n(u) × n (u)||.
By the definition of cross product:
u × v =
i j k
u1 u2 u3
v1 v2 v3
=


s1
s2
s3

 =


u2v3 − u3v2
u3v1 − u1v3
u1v2 − u2v1

 .
We get:
n × n =


s1
s2
s3

 =
i j k
nx ny nz
∂ n
∂x
∂ n
∂y
∂ n
∂z
=


ny
∂ n
∂z − nz
∂ n
∂y
nz
∂ n
∂x − nx
∂ n
∂z
nx
∂ n
∂y − ny
∂ n
∂x

 ,
so we can now compute a measure of curavture
k = ||n × n|| = s2
1 + s2
2 + s2
3
10. EXERCISE 10
Vector glyphs are one of the simplest, and most used, methods for visualizing vector fields. However,
careless use of vector glyphs can lead to either visual clutter (too many glyphs drawn over the same small
screen space) or visual subsampling (large areas in the field’s domain which do not contain any vector glyph).
Given a 3D vector field, which we want to visualize with vector glyphs, describe all parameters that one can
control, and how these should be controlled, to reduce both visual clutter and visual subsampling.
Using higher scaling factor values that provides larger glyphs and better perceivable direction can elim-
inate clutter. We can scale all the line glyphs into same length or to the average cell size at its origin to
eliminate clutter, but it eliminates the use of glyph size as a visual cue. We can also color glyphs by the
vector magnitude blue-to-red in order to strengthen length cues. By shading the line glyph from full color
(or full opacity) at the glyph origin to the background color (or full transparency) at the line tip, a visual
effect similar to a thin arrow can be obtained without the need of extra screen space.
Drawing glyphs transparently helps fight occlusion in 3D, as well as using support isosurface does, when
glyphs are rendered on top of some surface.
11. EXERCISE 11
18
Consider the rectangular areas shown in the figure below. All areas have the same aspect ratio (2l, 1.5l).
For each case, we define four 2D vector values v1, ..., v4 at the area’s vertices, and visualize these by the blue
vector glyphs. Now, for each area, look at its center (indicated by a black point). What is the value of the
vector field that you perceive there, based on the surrounding four blue glyphs? Draw a vector glyph at the
central point to indicate the direction and magnitude of your perceived vector.
Figure 4: Vector values perceived at the center of the area given vertex values.
12. EXERCISE 12
Consider the figure from the previous exercise (shown again below). For each area, compute the value
of the vector field at the central black point, assuming that we are using bilinear interpolation of the four
vertex values. Next, draw the resulting interpolated vectors using vector glyphs at the respective central
points. Finally, compare the result with the one of the previous exercise. Do you see any differences? If so,
which ones, and how do you explain them?
19
Figure 5: Vector values perceived at the center of the area given vertex values.
T−1
rect = (r, s) =
(p − p1) · (p2 − p1)
p2 − p1
2 ,
(p − p1) · (p4 − p1)
p4 − p1
2 , where :
p =(1, 0.75),
p1 =(0, 0),
p2 =(2, 0),
p3 =(2, 1.5),
p4 =(0, 1.5).
(p − p1) =(1 − 0, 0.75 − 0) = (1, 0.75),
(p2 − p1) =(2 − 0, 0 − 0) = (2, 0),
(p4 − p1) =(0 − 0, 1.5 − 0) = (0, 1.5),
p2 − p1
2
=(2 − 0)2
= 4,
p4 − p1
2
=(1.5 − 0)2
= 1.52
.
(r, s) = T−1
rect =
(1, 0.75) · (2, 0)
4
,
(1, 0.75) · (0, 1.5)
1.52
=
2
4
,
0.75 · 1.5
1.52
=
1
2
,
1
2
.
Calculating 4 basis functions as follows:
Φi(T−1
rect) =



Φ1
1(r, s) = (1 − r)(1 − s) = (1 − 1/2)(1 − 1/2) = 1/4,
Φ1
2(r, s) = r(1 − s) = (1/2) · (1 − 1/2) = 1/2 × 1/2 = 1/4,
Φ1
3(r, s) = rs = 1/2 × 1/2 = 1/4 = 1/4,
Φ1
4(r, s) = (1 − r)s = (1 − 1/2) · (1/2) × 1 = 1/4.
Finally, we calculate value for: v(p) = ˆp(x, y) =
4
i=1 viΦ1
i = 1
4
4
i=1 vi
20
v(p) =
1
4
((1, 0) + (−1, 1) + (1, 0) + (1, −1)) =
1
4
(1 + (−1) + 1 + 1, 0 + 1 + 0 − 1) =
1
4
(2, 0) = (1/2, 0);
v(p) =
1
4
((1, 0) + (0, 1) + (1, 1) + (2, 1)) =
1
4
· (1 + 0 + 1 + 2, 0 + 1 + 1 + 1) =
1
4
(4, 3) = (−1/4, 0);
v(p) =
1
4
((−1, 2) + (−1, −1) + (0, −2) + (1, 1)) =
1
4
(−1 − 1 + 0 + 1, 2 − 1 − 2 + 1) =
1
4
(−1, 0) = (−1/4, 0);
v(p) =
1
4
((0, 2) · +(0, 1) + (1, 1) + (2, 1)) =
1
4
· (0 + 0 + 1 + 2, 2 + 1 + 1 + 1) =
1
4
· (3, 5) = (3/4, 5/4).
Answer:
a) v(p) = (1/2, 0),
b) v(p) = (1, 3/4),
c) v(p) = (−1/4, 0),
d) v(p) = (3/4, 5/4).
13. EXERCISE 13
Consider the use of a 3D vector-glyph plot for the visualization of a 3D vector field. Each glyph is drawn
as an arrow oriented and scaled by the vector field’s direction and magnitude respectively. Without any
additional cues such as interactively changing the viewpoint, it is clearly very hard to perceive the correct
orientation of the resulting arrow glyphs in 3D. Propose and describe two visual enhancements (not using
interaction) that would make the perception of 3D orientation of the resulting vector glyphs easier from a
given viewpoint.
Our perception of orientation in 3D will become easier if we use semitransparent glyphs. Closer glyphs
now case lee occlusion allowing us to see deeper inside the dataset.
We can alleviate the occlusion problem by randomly subsampling our dataset.
An interesting effect can be achieved by using monochrome, instead of color mapped, transparent line
glyphs (arrows have larger screen size). The high velocity flow core is now more visible as a dark region.
Glyph visualization of stream surfaces, where vectors are tangent to the surface, are easier to understand,
since the glyphs tend to stay on the surface, rather than on surfaces, which the field is not tangent, where
the glyphs get visually entangled and cause more visual clutter.
Evenly-spaced streamline seeding is applicable to 3D datasets. Streamlines and glyphs evenly spaced
in 3D space can be generated by methods, similar to FPSS (Farthest Point Streamline Seeding method).
However this does not guarantee that the rendered streamlines will be evenly spaced in screen space.
One approach is to generate seeds on a curved surface embedded in 3D, backproject these seeds into
3D, and trace streamlines from these 3D seed points. Streamlines are next selected for rendering, if their
screen-space projections are evenly spaced. We can use slice planes, isosurfaces of various flow quantities
(such as vector magnitude), or stream surfaces can be used.
We can also take a given seed surface S3D and project vector field, restricted to S, to the 2D (screen)
image plane. Next, we apply the 2D evenly-spaced streamline generation to the projected vector field over
the 2D projection S2D. We can also use tapered streamlines, by having the thickness of a streamline coded
by the distance to the image plane.
Texture based visualizations with color-coding on 3D surface. Adding shading to the texture on the
surface helps to convey spatial cues about the object geometry.
14. EXERCISE 14
Consider a 2D vector field defined over a 2D square domain. At each point p, the vector field is v(p) =
p−c
||p−c||
R( π
2 )
. Here, c is the center of the square, and R(α) denotes a rotation by α degrees clockwise. We
visualize this vector field with a special kind of glyph: At chosen sample points p, we draw a square which
has two edges parallel to the vector (v)Rβ
, where β is a small angle of about 20 degrees. A visualization
using this technique is shown in the image below.
For this type of vector field and visualization, answer in detail the following questions:
21
• What are the streamlines of the vector field looking like?
• Looking at the figure below, what can you say about the vector field? Describe the vector field as you
see it in the figure in a few sentences. Does this visualization accurately convey the vector field? If
so, argue why. If not, argue what are the differences between the perceived vector field and the actual
one.
• Which design elements of the glyph (color, shape, size, orientation, other) influence the strongest the
perception of the vector field?
Figure 6: Vector field depicted by the square glyphs.
• Streamlines of such field are parralel to the radius and will follow outwards direction from the center
of the domain.
• I see a vector field of constant magnitude |v| = 1 pointing in the direction of p from the center of the
domain along its radius, after it was rotated by 20 degrees clockwise. Instead of unit 1 squares lined
up in the direction of their radius, we see each of them rotated by 20 degrees now. Constant size of
the square tells us that magnitude of a vector field is constant (equals to 1) over entire domain.
• Color of the glyph makes me think of clockwise and counterclockwise spin, but it is not the case here.
It is unclear first why domain is being sampled in circles. Placement of sample points combined with
black and white colors creates an effect of rotating rings, which distracts alot of attention. Shape of
the square tells us that our field is invariant in terms of 90 degrees rotation along the direction of its
radius.
15. EXERCISE 15
Visualizing time-dependent vector fields (either in the 2D or 3D case) is highly challenging. The main
problem here is that, apart from the difficulty of showing the direction and magnitude of a vector field, we
22
have to somehow show how these quantities change in time. One possible way to do this is to highlight
spatial regions where these quantities significantly change at each time moment - that is, to compute a
derivative of the vector field over time, and to overlay this information atop of an instantaneous vector
field visualization generated by classical methods, such as e.g. vector glyphs, streamlines, or image-based
techniques. In this context, propose a metric that would intuitively measure the change in time of the
direction and/or magnitude of a vector field. Describe your metric analytically, and argue why it would be
a good solution for the above goal of highlighting regions of rapid change.
We can compute gradient v of our vector field and normal n. Gradient points in the direction of the
maximal slope. Length of the gradient vector || v|| is a measure of rate of the rate of change in that
direction. We can split our domain into 2 by drawing isoline 2D contours or 3D isosurfaces for value of
gradient v ≥ V ar closes to some threshold value V ar. Then vector field limited to our isosurface can be
displayed with greater luminance, and lower luminance can be used for visualizing same vector field over
remaining parts of the domain, where rate of variation is lower (or less significant).
16. EXERCISE 16
Simplified visualizations for vector fields reduce the problem of showing the vector data at each sample
point in the field’s domain to the problem of partitioning the domain into a set of regions, so that the field’s
variation over any such region can be easily represented by classical techniques such as vector glyphs or
streamlines. For this to work, we need to know how to represent the ‘average’ vector field over some given
spatial region R of a domain, where we know that our vector field has limited variation. Describe two visual
representation techniques that can achieve this type of representation.
Hints:
• First, define what is the constraint of the vector field variation over a given region R
• Next, propose a way to represent the ‘average’ vector field over R, as well as the variation (deviation
from the average) of the field over R
Feature detection methods reduce the vector field to a set of features of interest, described as set of
parameters, such as feature type, position, extent and strength.
Multiscale Image Based Flow Visualization (MIBFV) uses a tool called algebraic multigrid (AMG), where
coupling n × n matrix M (stiffness matrix) encodes the similarity metric f. It describes the finite element
discretization of an anisotropic diffusion operator using piece-wise linear basis functions. It provides vector
field decompositions on different levels. Then IBFV technique advects a spatial noise signal, whose luminance
changes periodically in a given vector field, crating effect of thin, contrasting animated streamlines that move
with the flow. It emphasizes the vector field features at a user chosen scale k, and can combine several scales
into single visualization. AMG allows identifying few critical points of interest and MIBFV presents high
detail field visualization around those critical points, and shows a lower amount of detail in the surrounding
regions.
The average vector field over a cell can be computed as the average of the cell’s vertex attributes:
fi =
pj ∈ points(ci) fj
C
,
where C = |points(ci)| is the number of vertices of cell ci.
23

More Related Content

What's hot

Graph Coloring : Greedy Algorithm & Welsh Powell Algorithm
Graph Coloring : Greedy Algorithm & Welsh Powell AlgorithmGraph Coloring : Greedy Algorithm & Welsh Powell Algorithm
Graph Coloring : Greedy Algorithm & Welsh Powell AlgorithmPriyank Jain
 
Features image processing and Extaction
Features image processing and ExtactionFeatures image processing and Extaction
Features image processing and ExtactionAli A Jalil
 
Medians and order statistics
Medians and order statisticsMedians and order statistics
Medians and order statisticsRajendran
 
Image representation
Image representationImage representation
Image representationRahul Dadwal
 
Computer graphics basic transformation
Computer graphics basic transformationComputer graphics basic transformation
Computer graphics basic transformationSelvakumar Gna
 
Over fitting underfitting
Over fitting underfittingOver fitting underfitting
Over fitting underfittingSivapriyaS12
 
Smoothing in Digital Image Processing
Smoothing in Digital Image ProcessingSmoothing in Digital Image Processing
Smoothing in Digital Image ProcessingPallavi Agarwal
 
Interpixel redundancy
Interpixel redundancyInterpixel redundancy
Interpixel redundancyNaveen Kumar
 
Data Science - Part III - EDA & Model Selection
Data Science - Part III - EDA & Model SelectionData Science - Part III - EDA & Model Selection
Data Science - Part III - EDA & Model SelectionDerek Kane
 
Handling Missing Values for Machine Learning.pptx
Handling Missing Values for Machine Learning.pptxHandling Missing Values for Machine Learning.pptx
Handling Missing Values for Machine Learning.pptxShamimBhuiyan8
 
Big Data: Its Characteristics And Architecture Capabilities
Big Data: Its Characteristics And Architecture CapabilitiesBig Data: Its Characteristics And Architecture Capabilities
Big Data: Its Characteristics And Architecture CapabilitiesAshraf Uddin
 
Data Stream Management
Data Stream ManagementData Stream Management
Data Stream Managementk_tauhid
 
Unit 3
Unit 3Unit 3
Unit 3ypnrao
 
Content Based Image Retrieval
Content Based Image Retrieval Content Based Image Retrieval
Content Based Image Retrieval Swati Chauhan
 

What's hot (20)

Graph Coloring : Greedy Algorithm & Welsh Powell Algorithm
Graph Coloring : Greedy Algorithm & Welsh Powell AlgorithmGraph Coloring : Greedy Algorithm & Welsh Powell Algorithm
Graph Coloring : Greedy Algorithm & Welsh Powell Algorithm
 
Graph coloring problem
Graph coloring problemGraph coloring problem
Graph coloring problem
 
Features image processing and Extaction
Features image processing and ExtactionFeatures image processing and Extaction
Features image processing and Extaction
 
Medians and order statistics
Medians and order statisticsMedians and order statistics
Medians and order statistics
 
Data Preprocessing
Data PreprocessingData Preprocessing
Data Preprocessing
 
Image representation
Image representationImage representation
Image representation
 
Computer graphics basic transformation
Computer graphics basic transformationComputer graphics basic transformation
Computer graphics basic transformation
 
Over fitting underfitting
Over fitting underfittingOver fitting underfitting
Over fitting underfitting
 
Chapter 1
Chapter 1Chapter 1
Chapter 1
 
Smoothing in Digital Image Processing
Smoothing in Digital Image ProcessingSmoothing in Digital Image Processing
Smoothing in Digital Image Processing
 
Interpixel redundancy
Interpixel redundancyInterpixel redundancy
Interpixel redundancy
 
Data Science - Part III - EDA & Model Selection
Data Science - Part III - EDA & Model SelectionData Science - Part III - EDA & Model Selection
Data Science - Part III - EDA & Model Selection
 
Handling Missing Values for Machine Learning.pptx
Handling Missing Values for Machine Learning.pptxHandling Missing Values for Machine Learning.pptx
Handling Missing Values for Machine Learning.pptx
 
Data Visualization With R
Data Visualization With RData Visualization With R
Data Visualization With R
 
Big Data: Its Characteristics And Architecture Capabilities
Big Data: Its Characteristics And Architecture CapabilitiesBig Data: Its Characteristics And Architecture Capabilities
Big Data: Its Characteristics And Architecture Capabilities
 
Computer graphics realism
Computer graphics realismComputer graphics realism
Computer graphics realism
 
Data Stream Management
Data Stream ManagementData Stream Management
Data Stream Management
 
Unit 3
Unit 3Unit 3
Unit 3
 
Point Processing
Point ProcessingPoint Processing
Point Processing
 
Content Based Image Retrieval
Content Based Image Retrieval Content Based Image Retrieval
Content Based Image Retrieval
 

Similar to 06 Vector Visualization

Lecture 5b graphs and hashing
Lecture 5b graphs and hashingLecture 5b graphs and hashing
Lecture 5b graphs and hashingVictor Palmar
 
Social network analysis
Social network analysisSocial network analysis
Social network analysisStefanie Zhao
 
Distributed coloring with O(sqrt. log n) bits
Distributed coloring with O(sqrt. log n) bitsDistributed coloring with O(sqrt. log n) bits
Distributed coloring with O(sqrt. log n) bitsSubhajit Sahu
 
Graph in data structure
Graph in data structureGraph in data structure
Graph in data structurePooja Bhojwani
 
NON-LINEAR DATA STRUCTURE-Graphs.pptx
NON-LINEAR DATA STRUCTURE-Graphs.pptxNON-LINEAR DATA STRUCTURE-Graphs.pptx
NON-LINEAR DATA STRUCTURE-Graphs.pptxRajitha Reddy Alugati
 
Fundamentals of Multimedia - Vector Graphics.pdf
Fundamentals of Multimedia - Vector Graphics.pdfFundamentals of Multimedia - Vector Graphics.pdf
Fundamentals of Multimedia - Vector Graphics.pdfFatihahIrra
 
Lecture 2.3.1 Graph.pptx
Lecture 2.3.1 Graph.pptxLecture 2.3.1 Graph.pptx
Lecture 2.3.1 Graph.pptxking779879
 
Applications of graphs
Applications of graphsApplications of graphs
Applications of graphsTech_MX
 
Slides Chapter10.1 10.2
Slides Chapter10.1 10.2Slides Chapter10.1 10.2
Slides Chapter10.1 10.2showslidedump
 
Create swath profiles in GRASS GIS
Create swath profiles in GRASS GISCreate swath profiles in GRASS GIS
Create swath profiles in GRASS GISSkyler Sorsby
 
geostatistics_for introduction and analysis
geostatistics_for introduction and analysisgeostatistics_for introduction and analysis
geostatistics_for introduction and analysisGadisaGeremewNegasa
 
study Diffusion Curves: A Vector Representation for Smooth-Shaded Images
study Diffusion Curves: A Vector Representation for Smooth-Shaded Imagesstudy Diffusion Curves: A Vector Representation for Smooth-Shaded Images
study Diffusion Curves: A Vector Representation for Smooth-Shaded ImagesChiamin Hsu
 
Activity 1 (Directional Derivative and Gradient with minimum 3 applications)....
Activity 1 (Directional Derivative and Gradient with minimum 3 applications)....Activity 1 (Directional Derivative and Gradient with minimum 3 applications)....
Activity 1 (Directional Derivative and Gradient with minimum 3 applications)....loniyakrishn
 
Dynamic time wrapping (dtw), vector quantization(vq), linear predictive codin...
Dynamic time wrapping (dtw), vector quantization(vq), linear predictive codin...Dynamic time wrapping (dtw), vector quantization(vq), linear predictive codin...
Dynamic time wrapping (dtw), vector quantization(vq), linear predictive codin...Tanjarul Islam Mishu
 

Similar to 06 Vector Visualization (20)

Lecture 5b graphs and hashing
Lecture 5b graphs and hashingLecture 5b graphs and hashing
Lecture 5b graphs and hashing
 
Social network analysis
Social network analysisSocial network analysis
Social network analysis
 
Distributed coloring with O(sqrt. log n) bits
Distributed coloring with O(sqrt. log n) bitsDistributed coloring with O(sqrt. log n) bits
Distributed coloring with O(sqrt. log n) bits
 
Graph in data structure
Graph in data structureGraph in data structure
Graph in data structure
 
NON-LINEAR DATA STRUCTURE-Graphs.pptx
NON-LINEAR DATA STRUCTURE-Graphs.pptxNON-LINEAR DATA STRUCTURE-Graphs.pptx
NON-LINEAR DATA STRUCTURE-Graphs.pptx
 
Spanningtreesppt
SpanningtreespptSpanningtreesppt
Spanningtreesppt
 
Fundamentals of Multimedia - Vector Graphics.pdf
Fundamentals of Multimedia - Vector Graphics.pdfFundamentals of Multimedia - Vector Graphics.pdf
Fundamentals of Multimedia - Vector Graphics.pdf
 
Lecture 2.3.1 Graph.pptx
Lecture 2.3.1 Graph.pptxLecture 2.3.1 Graph.pptx
Lecture 2.3.1 Graph.pptx
 
Applications of graphs
Applications of graphsApplications of graphs
Applications of graphs
 
Slides Chapter10.1 10.2
Slides Chapter10.1 10.2Slides Chapter10.1 10.2
Slides Chapter10.1 10.2
 
Create swath profiles in GRASS GIS
Create swath profiles in GRASS GISCreate swath profiles in GRASS GIS
Create swath profiles in GRASS GIS
 
geostatistics_for introduction and analysis
geostatistics_for introduction and analysisgeostatistics_for introduction and analysis
geostatistics_for introduction and analysis
 
study Diffusion Curves: A Vector Representation for Smooth-Shaded Images
study Diffusion Curves: A Vector Representation for Smooth-Shaded Imagesstudy Diffusion Curves: A Vector Representation for Smooth-Shaded Images
study Diffusion Curves: A Vector Representation for Smooth-Shaded Images
 
Activity 1 (Directional Derivative and Gradient with minimum 3 applications)....
Activity 1 (Directional Derivative and Gradient with minimum 3 applications)....Activity 1 (Directional Derivative and Gradient with minimum 3 applications)....
Activity 1 (Directional Derivative and Gradient with minimum 3 applications)....
 
graph ASS (1).ppt
graph ASS (1).pptgraph ASS (1).ppt
graph ASS (1).ppt
 
Graphs
GraphsGraphs
Graphs
 
Dynamic time wrapping (dtw), vector quantization(vq), linear predictive codin...
Dynamic time wrapping (dtw), vector quantization(vq), linear predictive codin...Dynamic time wrapping (dtw), vector quantization(vq), linear predictive codin...
Dynamic time wrapping (dtw), vector quantization(vq), linear predictive codin...
 
logic.pptx
logic.pptxlogic.pptx
logic.pptx
 
Deepwalk vs Node2vec
Deepwalk vs Node2vecDeepwalk vs Node2vec
Deepwalk vs Node2vec
 
Vector
VectorVector
Vector
 

More from Valerii Klymchuk

Sample presentation slides template
Sample presentation slides templateSample presentation slides template
Sample presentation slides templateValerii Klymchuk
 
05 Clustering in Data Mining
05 Clustering in Data Mining05 Clustering in Data Mining
05 Clustering in Data MiningValerii Klymchuk
 
01 Introduction to Data Mining
01 Introduction to Data Mining01 Introduction to Data Mining
01 Introduction to Data MiningValerii Klymchuk
 
04 Classification in Data Mining
04 Classification in Data Mining04 Classification in Data Mining
04 Classification in Data MiningValerii Klymchuk
 
Crime Analysis based on Historical and Transportation Data
Crime Analysis based on Historical and Transportation DataCrime Analysis based on Historical and Transportation Data
Crime Analysis based on Historical and Transportation DataValerii Klymchuk
 
Artificial Intelligence for Automated Decision Support Project
Artificial Intelligence for Automated Decision Support ProjectArtificial Intelligence for Automated Decision Support Project
Artificial Intelligence for Automated Decision Support ProjectValerii Klymchuk
 

More from Valerii Klymchuk (11)

Sample presentation slides template
Sample presentation slides templateSample presentation slides template
Sample presentation slides template
 
Toronto Capstone
Toronto CapstoneToronto Capstone
Toronto Capstone
 
05 Clustering in Data Mining
05 Clustering in Data Mining05 Clustering in Data Mining
05 Clustering in Data Mining
 
01 Introduction to Data Mining
01 Introduction to Data Mining01 Introduction to Data Mining
01 Introduction to Data Mining
 
02 Related Concepts
02 Related Concepts02 Related Concepts
02 Related Concepts
 
03 Data Mining Techniques
03 Data Mining Techniques03 Data Mining Techniques
03 Data Mining Techniques
 
04 Classification in Data Mining
04 Classification in Data Mining04 Classification in Data Mining
04 Classification in Data Mining
 
Crime Analysis based on Historical and Transportation Data
Crime Analysis based on Historical and Transportation DataCrime Analysis based on Historical and Transportation Data
Crime Analysis based on Historical and Transportation Data
 
Artificial Intelligence for Automated Decision Support Project
Artificial Intelligence for Automated Decision Support ProjectArtificial Intelligence for Automated Decision Support Project
Artificial Intelligence for Automated Decision Support Project
 
Data Warehouse Project
Data Warehouse ProjectData Warehouse Project
Data Warehouse Project
 
Database Project
Database ProjectDatabase Project
Database Project
 

Recently uploaded

Saket, (-DELHI )+91-9654467111-(=)CHEAP Call Girls in Escorts Service Saket C...
Saket, (-DELHI )+91-9654467111-(=)CHEAP Call Girls in Escorts Service Saket C...Saket, (-DELHI )+91-9654467111-(=)CHEAP Call Girls in Escorts Service Saket C...
Saket, (-DELHI )+91-9654467111-(=)CHEAP Call Girls in Escorts Service Saket C...Sapana Sha
 
INTERNSHIP ON PURBASHA COMPOSITE TEX LTD
INTERNSHIP ON PURBASHA COMPOSITE TEX LTDINTERNSHIP ON PURBASHA COMPOSITE TEX LTD
INTERNSHIP ON PURBASHA COMPOSITE TEX LTDRafezzaman
 
原版1:1定制南十字星大学毕业证(SCU毕业证)#文凭成绩单#真实留信学历认证永久存档
原版1:1定制南十字星大学毕业证(SCU毕业证)#文凭成绩单#真实留信学历认证永久存档原版1:1定制南十字星大学毕业证(SCU毕业证)#文凭成绩单#真实留信学历认证永久存档
原版1:1定制南十字星大学毕业证(SCU毕业证)#文凭成绩单#真实留信学历认证永久存档208367051
 
Beautiful Sapna Vip Call Girls Hauz Khas 9711199012 Call /Whatsapps
Beautiful Sapna Vip  Call Girls Hauz Khas 9711199012 Call /WhatsappsBeautiful Sapna Vip  Call Girls Hauz Khas 9711199012 Call /Whatsapps
Beautiful Sapna Vip Call Girls Hauz Khas 9711199012 Call /Whatsappssapnasaifi408
 
RadioAdProWritingCinderellabyButleri.pdf
RadioAdProWritingCinderellabyButleri.pdfRadioAdProWritingCinderellabyButleri.pdf
RadioAdProWritingCinderellabyButleri.pdfgstagge
 
How we prevented account sharing with MFA
How we prevented account sharing with MFAHow we prevented account sharing with MFA
How we prevented account sharing with MFAAndrei Kaleshka
 
ASML's Taxonomy Adventure by Daniel Canter
ASML's Taxonomy Adventure by Daniel CanterASML's Taxonomy Adventure by Daniel Canter
ASML's Taxonomy Adventure by Daniel Cantervoginip
 
GA4 Without Cookies [Measure Camp AMS]
GA4 Without Cookies [Measure Camp AMS]GA4 Without Cookies [Measure Camp AMS]
GA4 Without Cookies [Measure Camp AMS]📊 Markus Baersch
 
RS 9000 Call In girls Dwarka Mor (DELHI)⇛9711147426🔝Delhi
RS 9000 Call In girls Dwarka Mor (DELHI)⇛9711147426🔝DelhiRS 9000 Call In girls Dwarka Mor (DELHI)⇛9711147426🔝Delhi
RS 9000 Call In girls Dwarka Mor (DELHI)⇛9711147426🔝Delhijennyeacort
 
From idea to production in a day – Leveraging Azure ML and Streamlit to build...
From idea to production in a day – Leveraging Azure ML and Streamlit to build...From idea to production in a day – Leveraging Azure ML and Streamlit to build...
From idea to production in a day – Leveraging Azure ML and Streamlit to build...Florian Roscheck
 
Top 5 Best Data Analytics Courses In Queens
Top 5 Best Data Analytics Courses In QueensTop 5 Best Data Analytics Courses In Queens
Top 5 Best Data Analytics Courses In Queensdataanalyticsqueen03
 
Building on a FAIRly Strong Foundation to Connect Academic Research to Transl...
Building on a FAIRly Strong Foundation to Connect Academic Research to Transl...Building on a FAIRly Strong Foundation to Connect Academic Research to Transl...
Building on a FAIRly Strong Foundation to Connect Academic Research to Transl...Jack DiGiovanna
 
Advanced Machine Learning for Business Professionals
Advanced Machine Learning for Business ProfessionalsAdvanced Machine Learning for Business Professionals
Advanced Machine Learning for Business ProfessionalsVICTOR MAESTRE RAMIREZ
 
NLP Data Science Project Presentation:Predicting Heart Disease with NLP Data ...
NLP Data Science Project Presentation:Predicting Heart Disease with NLP Data ...NLP Data Science Project Presentation:Predicting Heart Disease with NLP Data ...
NLP Data Science Project Presentation:Predicting Heart Disease with NLP Data ...Boston Institute of Analytics
 
EMERCE - 2024 - AMSTERDAM - CROSS-PLATFORM TRACKING WITH GOOGLE ANALYTICS.pptx
EMERCE - 2024 - AMSTERDAM - CROSS-PLATFORM  TRACKING WITH GOOGLE ANALYTICS.pptxEMERCE - 2024 - AMSTERDAM - CROSS-PLATFORM  TRACKING WITH GOOGLE ANALYTICS.pptx
EMERCE - 2024 - AMSTERDAM - CROSS-PLATFORM TRACKING WITH GOOGLE ANALYTICS.pptxthyngster
 
Heart Disease Classification Report: A Data Analysis Project
Heart Disease Classification Report: A Data Analysis ProjectHeart Disease Classification Report: A Data Analysis Project
Heart Disease Classification Report: A Data Analysis ProjectBoston Institute of Analytics
 
Defining Constituents, Data Vizzes and Telling a Data Story
Defining Constituents, Data Vizzes and Telling a Data StoryDefining Constituents, Data Vizzes and Telling a Data Story
Defining Constituents, Data Vizzes and Telling a Data StoryJeremy Anderson
 

Recently uploaded (20)

E-Commerce Order PredictionShraddha Kamble.pptx
E-Commerce Order PredictionShraddha Kamble.pptxE-Commerce Order PredictionShraddha Kamble.pptx
E-Commerce Order PredictionShraddha Kamble.pptx
 
Saket, (-DELHI )+91-9654467111-(=)CHEAP Call Girls in Escorts Service Saket C...
Saket, (-DELHI )+91-9654467111-(=)CHEAP Call Girls in Escorts Service Saket C...Saket, (-DELHI )+91-9654467111-(=)CHEAP Call Girls in Escorts Service Saket C...
Saket, (-DELHI )+91-9654467111-(=)CHEAP Call Girls in Escorts Service Saket C...
 
INTERNSHIP ON PURBASHA COMPOSITE TEX LTD
INTERNSHIP ON PURBASHA COMPOSITE TEX LTDINTERNSHIP ON PURBASHA COMPOSITE TEX LTD
INTERNSHIP ON PURBASHA COMPOSITE TEX LTD
 
原版1:1定制南十字星大学毕业证(SCU毕业证)#文凭成绩单#真实留信学历认证永久存档
原版1:1定制南十字星大学毕业证(SCU毕业证)#文凭成绩单#真实留信学历认证永久存档原版1:1定制南十字星大学毕业证(SCU毕业证)#文凭成绩单#真实留信学历认证永久存档
原版1:1定制南十字星大学毕业证(SCU毕业证)#文凭成绩单#真实留信学历认证永久存档
 
Beautiful Sapna Vip Call Girls Hauz Khas 9711199012 Call /Whatsapps
Beautiful Sapna Vip  Call Girls Hauz Khas 9711199012 Call /WhatsappsBeautiful Sapna Vip  Call Girls Hauz Khas 9711199012 Call /Whatsapps
Beautiful Sapna Vip Call Girls Hauz Khas 9711199012 Call /Whatsapps
 
RadioAdProWritingCinderellabyButleri.pdf
RadioAdProWritingCinderellabyButleri.pdfRadioAdProWritingCinderellabyButleri.pdf
RadioAdProWritingCinderellabyButleri.pdf
 
How we prevented account sharing with MFA
How we prevented account sharing with MFAHow we prevented account sharing with MFA
How we prevented account sharing with MFA
 
ASML's Taxonomy Adventure by Daniel Canter
ASML's Taxonomy Adventure by Daniel CanterASML's Taxonomy Adventure by Daniel Canter
ASML's Taxonomy Adventure by Daniel Canter
 
GA4 Without Cookies [Measure Camp AMS]
GA4 Without Cookies [Measure Camp AMS]GA4 Without Cookies [Measure Camp AMS]
GA4 Without Cookies [Measure Camp AMS]
 
RS 9000 Call In girls Dwarka Mor (DELHI)⇛9711147426🔝Delhi
RS 9000 Call In girls Dwarka Mor (DELHI)⇛9711147426🔝DelhiRS 9000 Call In girls Dwarka Mor (DELHI)⇛9711147426🔝Delhi
RS 9000 Call In girls Dwarka Mor (DELHI)⇛9711147426🔝Delhi
 
From idea to production in a day – Leveraging Azure ML and Streamlit to build...
From idea to production in a day – Leveraging Azure ML and Streamlit to build...From idea to production in a day – Leveraging Azure ML and Streamlit to build...
From idea to production in a day – Leveraging Azure ML and Streamlit to build...
 
Top 5 Best Data Analytics Courses In Queens
Top 5 Best Data Analytics Courses In QueensTop 5 Best Data Analytics Courses In Queens
Top 5 Best Data Analytics Courses In Queens
 
Building on a FAIRly Strong Foundation to Connect Academic Research to Transl...
Building on a FAIRly Strong Foundation to Connect Academic Research to Transl...Building on a FAIRly Strong Foundation to Connect Academic Research to Transl...
Building on a FAIRly Strong Foundation to Connect Academic Research to Transl...
 
Deep Generative Learning for All - The Gen AI Hype (Spring 2024)
Deep Generative Learning for All - The Gen AI Hype (Spring 2024)Deep Generative Learning for All - The Gen AI Hype (Spring 2024)
Deep Generative Learning for All - The Gen AI Hype (Spring 2024)
 
Call Girls in Saket 99530🔝 56974 Escort Service
Call Girls in Saket 99530🔝 56974 Escort ServiceCall Girls in Saket 99530🔝 56974 Escort Service
Call Girls in Saket 99530🔝 56974 Escort Service
 
Advanced Machine Learning for Business Professionals
Advanced Machine Learning for Business ProfessionalsAdvanced Machine Learning for Business Professionals
Advanced Machine Learning for Business Professionals
 
NLP Data Science Project Presentation:Predicting Heart Disease with NLP Data ...
NLP Data Science Project Presentation:Predicting Heart Disease with NLP Data ...NLP Data Science Project Presentation:Predicting Heart Disease with NLP Data ...
NLP Data Science Project Presentation:Predicting Heart Disease with NLP Data ...
 
EMERCE - 2024 - AMSTERDAM - CROSS-PLATFORM TRACKING WITH GOOGLE ANALYTICS.pptx
EMERCE - 2024 - AMSTERDAM - CROSS-PLATFORM  TRACKING WITH GOOGLE ANALYTICS.pptxEMERCE - 2024 - AMSTERDAM - CROSS-PLATFORM  TRACKING WITH GOOGLE ANALYTICS.pptx
EMERCE - 2024 - AMSTERDAM - CROSS-PLATFORM TRACKING WITH GOOGLE ANALYTICS.pptx
 
Heart Disease Classification Report: A Data Analysis Project
Heart Disease Classification Report: A Data Analysis ProjectHeart Disease Classification Report: A Data Analysis Project
Heart Disease Classification Report: A Data Analysis Project
 
Defining Constituents, Data Vizzes and Telling a Data Story
Defining Constituents, Data Vizzes and Telling a Data StoryDefining Constituents, Data Vizzes and Telling a Data Story
Defining Constituents, Data Vizzes and Telling a Data Story
 

06 Vector Visualization

  • 1. DS-620 Data Visualization Chapter 6. Summary Valerii Klymchuk July 29, 2015 0. EXERCISE 0 6 Vector Visualization A vector is a tuple of n scalar components v = (v1, ..., vn), vi ∈ R. An n− dimensional vector describes, for example, a position, direction, rate of change, or force in R . Most visualization software defines all vectors to have three components. 2D vectors are modeled as 3D vectors with the third (z) component equal to null. Vector fields are functions f : D → R , where D is a subset of R2 or R3 . Vector datasets are samplings of vector fields over discrete spatial domains. Computational fluid dynamics (CFD) solutions of a simulation consists of several datasets, each for s different time step. For each time step, several attributes are computed and stored into the solution dataset, such as velocity, pressure, density, flow divergence, and vorticity. 6.1 Divergence and Vorticity Given a vector field v :R3 → R3 , the divergence of v = (vx, vy, vz)1 is the scalar quantity div v = ∂vx ∂x + ∂vy ∂y + ∂vz ∂z . If v is a flow field that transports mass, div v characterizes the increase or loss of mass at a given point p in the vector field in unit time. • A positive divergence at p denotes that mass would spread from p outward. Positive divergence points are called sources. • A negative divergence at p denotes that mass gets sucked into p (sinks.) • A zero divergence at p denotes that mass is transported without getting spread or sucked, i.e., without compression or expansion. An equivalent definition of the divergence if v at a point p is div v(p) = lim Γ→p 1 |Γ| Γ (v · nΓ) ds. Here, Γ is a closed hypersurface (a curve for 2D vector fields and a surface for 3D vector fields) around the current point p, |Γ| is the area (2D) or volume (3D) of the space enclosed by Γ, and nΓ is the outward normal of Γ (see Figure 6.1(a)). Vorticity rot v of vector field v is a vector quantity rot v = ∂vz ∂y − ∂vy ∂z , ∂vx ∂z − ∂vz ∂x , ∂vy ∂x − ∂vx ∂y . 1
  • 2. Vorticity, also called the curl or rotor of v2 is a vector field that is locally perpendicular to the plane of rotation of v and whose magnitude expresses the speed of angular rotation of v around rot v. Hence, it characterizes the speed and direction of rotation of a given vector field at every point. Vorticity signals the presence of vortices - regions where the vector field locally circles around a point called the vortex center. High vorticity and high divergence are typically complimentary. When combining divergence and curl metrics in the construction of a visualization, it is useful to recall that div rot v = 0 for any vector field v. Phenomena called turbulent flow exhibits a pattern as high number of vortices and the alternation of their spinning directions. Streamwise vorticity Ω of a field v is the scalar quantity equal to the projection of rot v along v itself: Ω = v · rot v ||v|| . It describes, how quickly v turns around itself. Helicity is defined as one-half the scalar product of the velocity and vorticity vectors. It describes the extend to which the vector field exhibits a corkscrew-like local motion. Helicity is a conserved quantity if the flow is inviscid and homogeneous in density. In tornadoes the velocity and vorticity vectors tend to be aligned. To compute divergence and vorticity and related quantities we need the partial derivatives of the vector field, which on a discrete dataset can be approximated using the formulas specific for every grid cell type given in Section 3.7. However, derivatives, are sensitive to noise. 6.2 Vector Glyphs The vector glyph mapping technique associates a vector glyph (or icon), with every sample point of the vector dataset. Various properties of the icon, such as location, direction, orientation, size, and color are adjusted to reflect the value of the vector attribute it represents (direction, orientation and magnitude). Line glyphs. Lines show the position, direction, and magnitude of a set of vectors. Oriented line glyphs sometimes also called hedgehogs. On a sample domain D, we associate a line l = (x, x + kv(x)) with every sample point x ∈ D, that has a vector attribute v(x). The parameter k represents the scaling factor used to map the vector magnitudes to the geometric domain. High-resolution vector datasets must be subsampled in order to be visualized with hedgehogs. Ideally, a glyph should be as large as possible, since larger glyphs have an easier perceivable direction. , but not too large, so it would not intersect neighboring glyphs. If we scale all glyphs to the same size, this constraint is easy to obey by scaling each glyph to the average cell size at its origin - this removes clutter. Cone and arrow glyphs. Such glyphs are able to convey a signed direction. However, these glyphs also take more space to draw, so they increase the clutter or require lower-resolution datasets. An interesting effect of arrow is achieved by shading the line glyph from full color (or full opacity) at the origin to the background color (or full transparency) at the line tip. 6.2.1 Vector Glyph Discussion We say that the color mapping produces a dense visualization, where every pixel represents an interpolated data value. In contrast, most glyph-based visualizations cannot draw one glyph at every pixel, since a glyph takes more space, than just a pixel. All glyph visualizations share this discreteness. This affects the inverse image-to-data mapping. Vector glyphs in 2D Scalar color-mapping techniques produce a piecewise linear visualizations. Glyph techniques produce a purely discrete visualizations. In the first case, we do not have to mentally interpolate between drawn pixels, as graphics has done this task for us. In the second case, we only have visual indication at the sample points (i.e., cell vertices), so we must do this interpolation ourselves. Another problem of vector glyph visualization is caused by the regular pattern of the sample points present in uniform and rectilinear grids. The regular subsampling problem is present also when the subsampling 2
  • 3. grid is not aligned with the original grid. By subsampling the dataset using a randomly distributed (instead of regularly arranged) set of points, the problem can be alleviated. Vector glyphs in 3D. Besides the known problems of glyphs in 2D, an additional problem of 3D glyph visualization becomes apparent: occlusion. Using arrow instead of line glyphs only increases the occlusion problem, as arrows have a larger screen area than lines. We can alleviate the occlusion problem by further subsampling the dataset. A different way to tackle the occlusion problem is to draw the glyphs transparently. Closer glyphs now cause less occlusion, allowing us to see deeper inside the dataset. An interesting effect is achieved by using monochrome instead of color mapped, transparent line glyphs. The high velocity flow core located at the center of the fluid flow is now easily visible as a dark region. Vector glyphs on 3D surfaces. Glyph based visualization can be used also on 3D surfaces embedded in volumetric dataset. First, we select a surface of interest from a given 3D dataset (i.e., velocity magnitude isosurface of the vector field itself). Next, we draw vector glyphs at the sample points of the surface. The interpretation difficulties caused by these problems can be partially overcome by techniques such as random subsampling, carefully setting glyph length, etc. 6.3 Vector Color Coding Similar to scalar color mapping, vector color coding associates a color with every point of a given surface on which we have defined a vector dataset. The color is used to encode the vector orientation and direction attributes. Vector color coding is easier to understand if we present colors in the hue-saturation-value (HSV) system using color wheel. Every distinct hue corresponds to a different angle of the color wheel, saturation is presented as a distance from the wheel center to a given color point. Value is usually represented as a separate one-dimensional luminance parameter. Color coding on 2D surfaces. The vector orientation is encoded in the hue and the vector length in the value. The saturation parameter is set to one (we use only fully saturated colors). The color-coding process is applied for every point of the dataset, similarly to the scalar color coding, either via texture or polygon color interpolation. Besides the directional color-coding, we can also directly encode the vector components vx, vy, vz into colors. In this setting, a 3D vector is visualized by three separate scalar color-mapped fields. Although this method is the simplest, it has limited effectiveness. Color coding on 3D surfaces. Performing the inverse mapping from hue to 3D orientation visually is generally a very challenging task. For example, we can be interested in seeing how much the actual flow direction differs from the isosurface normal or, in other words, how far this isosurface is from a stream surface tangent to the flow. For this we can color-code the angle between the surface normal (n) and the vector data v, computed as : α = arcos n · v ||v|| . The result is a scalar field that can be visualized with color mapping. On top of the colored isosurface, the vector field itself is visualized with semitransparent glyphs. 6.4 Displacement Plots Displacement plots show only the end points of a trajectory (vector glyphs show both points and a line in-between.) Given a surface S ∈ D inside the domain D of a vector field, a displacement plot of S is a new surface S given by the set of sample points pi = pi + kv (pi), where v is a vector field that controls the displacement of the surface and k is the displacement factor. In the simplest example we can set v = v and displace the surface in the direction of the actual vector field itself. Displacement plots are sometimes called warped plots. Displacements plots produce a visually continuous results. We can set s to ||v|| to show the magnitude of v, or respectively to v = sn to show the magnitude in the direction orthogonal to our surface S. 3
  • 4. Parameter settings. First, the displacement parameter k must be carefully set. Large numbers can displace the displayed surface far away from its actual location. A second important parameter is the shape and position of the surface to be warped. Planar surfaces are often a popular choice. However, , the worst case takes place when the surface is almost tangent to the vector field to be visualized. In this case, the warped surface stays in the same plane, as the original surface. 6.5 Stream Objects Rather than a single visualization technique, stream objects are more of a family of such techniques, related by the idea of visualizing the trajectory of some input object in a vector field over a given interval. 6.5.1 Streamlines and Their Variations Time-dependent vector fields v : D × T are defined over some spatial domain D and time interval T. That is at the same spatial position x ∈ D, the vector field v(x, t) can have different values at different time moments t ∈ T. Time-independent, or stationary, vector fields v : D are defined over a spatial domain D and do not change the value in time. For time-independent vector fields, a streamline is a curved path starting from a given point x0 which is tangent at v. Streamlines are defined for time-independent vector fields. If concept of time is mentioned, it refers to the parameters τ and s, which can be thought of as integration time, and should not be confounded with the physical time of a time-dependent dataset. If we model a streamline as a parametric function Sstream(τ) = x(τ), where τ represents the arc-length coordinate along the curve, then a streamline obeys the equation: dx(τ) dτ × v(x(τ)) = 0. This says, that the streamline point at position x is tangent to the vector field v(x) at the same position. This can also be expressed in terms of the ordinary differential equation dx(τ) dτ = v(x(τ)) = 0 with initial condition x(τ = 0) = x0 and with the constraint τ ∈ [0, Smax]. If we integrate over τ, we obtain the streamline Sstream = {x(τ), τ ∈ [0, Smax]}, x(τ) = x(0) + τ s=0 v(x(s)) ds, with x(τ = 0) = x0. In case of time-dependent vector fields v(x, t), several types of curves can be integrated in the vector field. First and simplest, can be computed by freezing the physical time t to a desired value tfixed and using Equation 6.10 to compute the curves that a particle would follow in v(x, tfixed). A second option is to compute the actual path x(t) of a particle in the time-dependent vector field, given by dx(t) dt = v(x(t), t) = 0 starting from a given point x(t0) = x0 This is nothing but applying Equation 6.9 while making the integration time τ run in sync with the physical time t. The emerging curves Spath = x(t) are called particle traces, or pathlines. They describe the actual trajectory, over physical time, that a particle released at x0 follows in the time-dependent vector field. Streaklines. For time-dependent vector fields, we can define a different type of curve besides pathlines. Imagine, ink being continuously released from x0, being advected in the vector field v(x, t) yielding a time- dependent curve, moved with the flow. Streakline as a time-dependent curve Sstreak = x(τ, t), where τ is the arc length coordinate along the streakline for a fixed time t. Then we have: dx(τ, t) dt = v(x(τ, t)) 4
  • 5. x(τ = t, t) = Spath(τ), x(0, 0) = x0 The end point (for τ = t) of a streakline coincides with the end point of the pathline starting at the same seed point x0 and running for time t. Note that, for stationary vector fields, all above concepts (streamlines, pathlines, and streaklines) are identical, i.e., they lead to the same curves. Computing streamlines. Several numerical methods solve Equation 6.10 approximately by discretizing the time t and replacing the integral with a finite sum. The simplest, but also least accurate, method is the Euler integration, given by T t=0 v(x(t)) dt N=T/∆t i=0 v(xi)∆t, where xi = xi−1 + vi−1∆t. The points xi sample the streamline starting from the seed point x0. The Euler integration considers the vector field v to be spatially constant and equal to v(xi) between every sample point xi and the next one xi+1. Hence, the streamline will be approximated bya a piecewise-linear curve, or polyline (x0, ..., xN ). The streamline is saved as as a polyline into an unstructured grid s. The tails of long streamlines tend to deviate from the actual correct location. A frequently used replacement for the Euler integration is the Runge-Kutta method. This method approximates the vector v between two sample points xi and xi+1 along a stream object with the average value v(xi)+v(xi+1) 2 . This method produces more accurate streamlines than the Euler method for the same step ∆t. Finding optimal values for ∆t is, in general, a difficult problem. A simple way to alleviate the problem is to adapt ∆t locally to the vector field magnitude so that the spatial integration step ||v||∆t has constant length. Setting ∆t so that this length is smaller than the current cell size ensures that no vector samples are skipped during the integration. In practice, spatial integration steps of around one-third of a cell size should yield good results for most vector fields. Stop criterion. An intuitive stop criterion for integration is to set a maximal length for the streamline, e.g., as a fraction of the domain size. Separately, the integration process should be stopped when the vector field magnitude ||v becomes zero (drops under some small ), since the trajectory comes to an end there. Geometry. When using small ∆t values (for precision), this would generate too densely sampled stream- lines that take large storage space. An optional solution is to use distance travelled so far along the integration path (variable l) to determine the addition of new sample points: given a user specified minimal distance ∆l, we add a new streamline point whenever l has increased with ∆l from the last added point. This way, the time sampling ∆t and spatial sampling ∆l can be controlled independently. Streamline seeding.A crucial issue foe the effectiveness is the choice of the location and number of seed points. A variant of a question is: “show all points on the trajectory ending here”. This can be achieved by using negative ∆t values, i.e., tracing the streamline upstream. By tracing both upstream and downstream streamlines, we can answer another question: “show all points on the trajectory passing through here.” A different strategy for the seed point distribution is to densely sample the complete dataset instead of only some given area (seed area). The aim of this strategy is to produce visualization that answer the question: “show the complete dataset with streamlines.” The resulting visualization should have several properties, as follows: • Coverage: Every dataset point should be at a minimal (small) distance from some streamline, stream- line should cover all important flow features (features of the vector field that are of interest for a given user in a given application context), so that relevant features are reflected in visualization. • Uniformity: The density of the streamlines in the final image should be confined between some minimal and maximal values. If we have too many streamlines over a given area, cluttering will occur. If we have too few, then undersampling occurs. • Continuity: Longer streamlines are preferred over short ones, as they produce less discontinuous, easier to interpret, visualizations. Several sampling strategies are possible to create dense streamline visualizations. The simplest solution is to distribute the seed points regularly or randomly in the domain and trace streamlines of some minimal length. This solution gives good coverage but can lead to cluttering. A better solution is to trace a streamline 5
  • 6. untill it gets closer to any of the already traced streamlines or itself than a user specified distance, minimizing cluttering and combine it with maximizing the streamline average length. A simple to implement method was proposed by Jobard and Lefer. This method produces all streamlines in a single pass, but has tendency of favoring short streamlines instead of potentially longer ones, and also does not guarantee a uniform coverage of the domain. Turk and Banks method generates on average longer streamlines, but is more complex to implement and is slower. It starts with small streamline fragments which are iteratively merged, shortened, lengthened, or new created, until the desired uniform coverage is obtained. A different method for creating evenly distributed streamlines for 2D vector fields is the farthest point streamline seeding (FPSS). It starts iterating new streamlines as far away as possible from the existing ones. Such streamlines have the greatest chance of achieving maximal length before getting too close to existing ones, since they start far away from the latter. FPSS computes a Delaunay triangulation of all sample points of already added streamlines. The center of the largest circumscribed circle of all these triangles is a good estimate for the center of the largest existing cavity and is a good estimate for the next streamline seed point to place. The method is simple to implement and generates densely seeded streamlines images for large 2D vector fields in a matter of seconds. As an additional display enhancement, streamlines can be rendered using tapering, i.e., thicker close to their midpoints and thinner close to their start and end points. This creates a visually more uniform coverage of the data domain with ink. One approach for 3D vector fields is to generate seeds on a curved surface embedded in 3D, backproject these seeds into 3D, and trace streamlines from these 3D seed points. Streamlines are next selected for rendering if their screen-space projections are evenly spaced. A simpler, and visually more effective solution is to work entirely in image space. Given a 3D seed surface S3D, we project the vector field, restricted to S, to the 2D image plane. Next, we apply the 2D evenly-spaced stream generation (of Jobard and Lefer) to the projected vector field over the 2D projection S2D of S3D. Additional care needed to prevent that the generated 2D streamlines stop at the points of S2D where the depth to the image plane exhibits discontinuities, so that streamlines do not jump between parts of the surface which are close on S2D but far away on S3D. 6.5.2 Stream Tubes We can use other shapes i.e., stream tubes to visualize the integral trajectories. These can be constructed by sweeping a circular section along the streamline curve computed as described previously. At every streamline point, the cross section is kept orthogonal to the streamline tangent vector. The thickness, or radius, parameter of stream tubes can be also used to convey some extra information, i.e., to modulate the tube radius to map a scalar value along the stream tubes, such as temperature, density, viscosity, or pressure, but also flow-related quantities, such as vorticity. An interesting effect can be obtained by modulating both the tube radius and color as functions of the normalized tube length. For every seed point we trace a stream tube whose radius varies linearly from some maximum value Rmax to 0 and whose luminance varies from black to white. The luminance and radius visual cues enhance each other to convey an arguably better insight, than the plain streamlines. 6.5.3 Streamlines and Tubes in 3D Datasets The streamlines get colored by the velocity magnitude using blue-to-red colormap. We undersample first at a certain rate and use a maximal streamline length of 100, which is close to the size of the domain’s length. Increasing streamline density makes flow structure easier to follow. Occlusion problem can be solved by lowering the transparency of the streamlines to 0.1. Finally, we can trace streamlines until a maximal time of 100 is reached. We now obtain many very short streamlines in the low speed areas. This lets better visualize the flow’s high-speed inner core. Being 3D objects, stream tubes have the extra advantage of providing some shading and occlusion cues, which allow us to better determine their actual relative position and orientation in 3D vector visualizations, as compared to plain streamlines drawn as 1D curves. 6
  • 7. 6.5.4 Stream Ribbons The visual cues we look for are stream tubes that twist around each other, yet stay close to each other. We can use a visualization technique called stream ribbons. A ribbon is created by launching two streamlines from two seed points close to each other. The surface created by the lines of minimal length with end points on the two streamlines is called a stream ribbon. If the two streamlines stay relatively close to each other then the stream ribbon’s twisting around its center curve gives a measure of the twisting of the vector field around the direction of advection. We can color ribbons with the streamwise vorticity using blue-to-red colormap, and two streamlines that form the edge of each ribbon are visualized with stream tubes. 6.5.5 Stream Surfaces We saw how stream ribbons, densely seeded on a given curve, can be used to visualize how that curve would be advected in the vector field. Given a seed curve Γ, a stream surface SΓ is a surface that contains Γ and is everywhere tangent to the vector field. For stream tubes, the seed curve is a short closed curve such as a circle. For the stream ribbons - short line segment. The flow described by the vector field is always tangent to the surface, i.e., cannot cross it. Hence, stream surfaces whose seed curves intersect the flow domain boundary or are closed curves can be used to segment the flow domain into disjoint regions that exhibit noninterfering flow patterns. A simple approach to construct a stream surface by tracing densely seeded streamlines from the seed curve. Next, the traced streamlines are connected to generate the stream surface. Points on all streamlines that have the same traveled distance value are next connected. A different approach that avoids the mesh construction challenges is to define the stream surface im- plicitly. Given a 3D vector field domain Ω ⊂ R3 , we first define a scalar function f∂Ω : ∂Ω → R on the boundary ∂Ω of Ω. f should be defined so that one or several isolines over ∂Ω correspond to our seed curve(s) of interest Γ. Next, from each point x of the discretization of Ω, a streamline S is traced backwards in the vector field. If S hits ∂Ω at some point y after a given amount of time, the value f(y) is assigned to all points along it in Ω. After all points of Ω have been thus visited, we obtain a scalar field fΩ : Ω → R. Next, the desired stream surface corresponding to Γ can be easily extracted as an isosurface of fΩ corresponding to the value that Γ takes over ∂Ω, using for example the marching cubes algorithm. This method cannot extract stream surfaces, which do not pass through the boundary of the dataset. 6.5.6 Streak Surfaces Given a seed curve Γ, a streak surface SΓ is a surface that contains all massless particles that pass through Γ, a streak surface Γ at different time moments, or, in other words, the (time-dependent) locus of dye advected in the flow that originates at Γ. Streaklines are traced in the flow starting from a densely sampled representation of the seed curve Γ. The streak surface is then constructed by connecting streaklines for adjacent seeds to yield a quad mesh. Apart from the additional challenges posed by highly divergent and/or convergent flow regions already outlined for stream surfaces, streak surfaces are computationally much more dependent. 6.6 Texture-Based Vector Visualization By their very nature, discrete visualizations cannot convey information about every point of a given dataset domain. Texture-based visualizations present a user with a (piece-wise) continuous signal that can be easier to interpret. The idea is to create a texture signal that encodes the direction and magnitude of a vector field in the various texture parameters such as luminance, graininess, color, and pattern structure. Using texture graininess for encoding vector direction into the texture parameters is a good idea. Line integral convolution. For each pixel p of the domain, we trace a streamline S(p, s) upstream and downstream through p for some maximal distance L. We set the value T(p) of the output texture T at the current location p to be the weighted sum of the values of the input noise texture N measured along the streamlines S(p) that passes through every pixel p. As a weighting function k(s) : R → R+, we can use a Gaussian k(s) = e−s2 , or other functions that are 1 at the origin and decay smoothly and symmetrically 7
  • 8. from the origin until they reach near-zero values at the maximal distance L. The obtained value T(p) is T(p) = L −L N(S(p, s))k(s) ds L −L k(s) ds . We can think of this process as blurring, or filtering, the noise image along the streamlines with a set of filters k(s) that are aligned with the streamlines. The filtering operation can be seen as a convolution of the noise and filter functions N and k. This process is known as line integral convolution (LIC). Using smaller values for L creates textures increasingly similar to the input noise. Using larger values for L increases the length of the perceived snake-like texture patterns. 6.6.1 IBFV Method Image Based Flow Visualization method (IBFV) produce not just static, but animated, flow textures in real time, can handle both stationary and instationary fields defined on domains ranging from planar 2D to volumetric ones. Consider a time-dependent scalar property, such as the image intensity. The value I(x, t) → [0, 1] describes our property at a given point x ∈ D of the flow domain D at a time moment t. The advection in time of the property I in a vector field v : D × R+ → R2 is given by I(x + v(x, t)∆t, t + ∆t) = I(x, t). This process is sometimes called forward advection, as it states that the property I at a location x + v(x, t)∆t downstream and at a future moment t + ∆t is equal to the current property I(x, t) at the current moment t. We would like to advect a noise texture so that we obtain an image with low contrasts along a pathline and high contrasts across neighboring streamlines. We can add an injection term, which can be seen as ink or dye that is injected into the flow domain at every point x in space and moment t in time. I(x + v(x, t)∆t, t + ∆t) = (1 − α)I(x, t) + αN(x + v(x, t)∆t, t + ∆t). Here, N(x, t) describes the injected property, which is also a function of space and time. Setting α to a value between 0 and 1 yields an image that exhibits both local variations (due to injected noise) and also coherence along pathlines (due to advection). A value of α = 0 states that there is no injection. Good values in practice are α ∈ [0, 0.2]. Let us consider a time independent signal N(x), consisting of black and white dots, the size d of the dots should be correlated with the velocity magnitude. In practice, using a dot size d ∈ [2, 10] pixels gives a good result. Let us take a time-dependent noise texture N (x, t) that is obtained from our original stationary noise texture N(x) as N (x, t) = f((t + N(x) mod 1) The intensity of every pixel x of the time-dependent texture N(x, t) oscillates in time controlled by the periodic function f, but all pixels have different (random) initial phases controlled by the static noise N(x). Using N instead of N produces an animated texture that seems to move with the flow, an effect that is especially suited for visualizing time-dependent vector fields v(x, t). 6.6.2 IBFV Implementation 6.6.3 IBFV Examples Streamlines are often used in exact engineering applications where one wants accurately determine the trajectory of a point starting from a precisely specified seed location. Ink advection is useful in getting insight into how the flow from a given seed area spreads out over a larger domain. Placing differently colored ink sources at the sources of a flow field, i.e., the points of high positive divergence and letting them get advected until the process visually converges will produce an image showing the flow domain decomposed 8
  • 9. into several spatial components colored differently as a function of their corresponding source. The curves that separate these areas are called separatrices and are important advanced concept in the study of vector fields. To be able to see through 3D dense flow texture, the injection step is modified in the 3D case by adding alpha, or transparency, noise to the grayscale noise. The alpha noise plays the role of “erasers” injected in the flow domain, yielding a sparsely filled visualization that lets one see through the flow domain. 6.7 Simplified Representation of Vector Fields Regions that exhibit important characteristics for an application area, such as vortices, speed extrema, or separation lines between regions of laminar flow, should be visualized in different ways as compared to the less-important regions, in order to help users detect their presence in a dataset. Such regions are also called features of the vector field. Dense visualizations can suffer from occlusion, therefore using simplified version of the vector field is beneficial for large datasets if simplification emphasizes the features and removes a large amount of uninterested data. 6.7.1 Vector Field Topology Which are the regions of the 2D flow domain from where the flow is gathered by a sink, respectively which are the regions reached by flow from a source? Consider the vector field defined by a function v : D ⊂ R2 → R2 . First, we define all so-called critical points of the field, i.e., points where the vector field magnitude ||v|| is zero. Assuming that the vector field is continuous, these will include all sources, sinks, and a number of additional point types. To discriminate between the different types of critical points, we compute the Jacobian matrix of the field v defined as J = ∂vx ∂x ∂vx ∂y ∂vy ∂x ∂vy ∂y J is computed at each point x ∈ D. Next, we evaluate the eigenvalues and eigenvectors of J. It can be shown that a vector field has the six types of critical points, which can be discriminated from each other based on the signs of the real and imaginary parts of λ1 and λ2. We see that negative values of Re describe attraction, while positive values of Re describe repulsion, while nonzero values for Im describe rotation. After having classified critical points, we consider now the small region surrounding such a critical point c. Such a region can be divided into several compact sectors Si of three types, based on behavior of streamlines which pass through that sector: • Parabolic sectors: Streamlines in Si have one end at c • Elliptic sectors: Streamlines have both ends at c • Hyperbolic sectors: Streamlines in Si do not pass through c. The streamlines that separate such sectors, or constitute sector borders, are called separatrices. To compute separatrices we first observe that saddle points are a special case, where exactly four separatrices meet. The algorithms for computing separatrices from a given 2D field can proceed by linking saddle points to other streamline endpoints, as follows: 1. Compute and classify all critical points 2. For all saddle points s, start tracing two streamlines in the directions of their eigenvectors having positive Re values. 3. Stop tracing when the streamline hits the boundary of D or another critical point where ||v|| = 0. 4. Merge curves that start and end between the same endpoints. The output of this algorithm is a graph whose nodes are critical points or points where streamlines leave the computational domain, and edges are the respective separatrices. 9
  • 10. Since all our computations are done using interpolated data, the conditions on the real and imaginary components of eigenvalues of the Jacobian are naturally subject to numerical errors. In practice these conditions are relaxed to compare Re and Im with finite-size, nonzero, threshold values. A way to simplify a visualization is to cluster or merge critical points which are close to each other within a small spatial distance. 6.7.2 Feature Detection Methods Feature detection methods reduce the vector field to a set of features of interest, described as a set of parameters, such as feature type, position, extent, and strength. It is hard to define precise numerical criteria to detect such features, like it is hard to quantify the presence and/or absence of a vortex. Second, features appear at different spatial scales in vector fields. Finally, there is often no clear spatial separation between a feature and a non-feature area or between several features of the same or different types. 6.7.3 Field Decomposition Methods The third class of methods is formed by field decomposition methods. Such methods partition the vector dataset into regions of strong intraregional (internal) similarity and weak interregional similarity. At the core of such methods is a similarity metric f that defines how similar two regions are. A frequently used similarity metric compares the direction and magnitude of the vector data. Two regions are considered highly similar, if the vector field has the same orientation and magnitude on both regions, and dissimilar otherwise. After choosing the metric, decomposition method usually perform a top-down partitioning or bottom-up agglomerative clustering of the dataset. In the top-down case, the dataset is recursively split in regions that have the least similarity. In the bottom-up case, we start with each sample point (or equivalent small area) being a different region and iteratively cluster the most similar regions. Both methods produce a multi-scale representation of the vector dataset that can be seen as a tree with the smallest regions, or data samples, as leaves and the whole dataset as the root region. Top-down decomposition subdivides one original cluster containing all the points using a weighted best-fit plane so that variance of an error metric over its two children is minimized. For each cluster, a representative vector is computed as the average of the vector samples in that cluster. Bottom-up decomposition. We begin clustering by defining, for every point pj of the dataset, a region Rj = (pj, v(pj), pi) containing the point and its vector attribute that has the origin at the point itself. The complete region R = {Ri} is next simplified iteratively by clustering, at every step, the two most similar regions Ra ∈ R, Rb ∈ R to form a new region Rab. This new region contains the union of all points in Ra and Rb and a vector v(Rab) that should best reflect merging of Ra and Rb. A simple way to compute v(Rab) is as the average of v(Ra) and v(Rb). weighted by the number of points |P(a)| and |P(b)| in the merged regions. The origin O(Rab) of v(Rab) can be computed similarly by weighted averaging. Finally, we set Ra and Rb as children of Rab, so that a binary region tree, or dendrogram, gets constructed during the clustering. From initial R”, the clustering creates region sets R1 , ..., RF until reaching a final region set RF that contains a user-specified number of N regions. These regions are roots of several region trees that encode the clustering. We can use these trees to obtain several types of simplified representations of our vector field. A simplified representation, or s-rep, is a region set R = {R1, ..., Rk} of k disjoint regions where each Ri is a node in a different region tree described earlier and whose union ∪k i−1Ri covers the complete dataset. Multiscale decomposition is a more sophisticated clustering technique, which employs mathematical tool called the algebraic multigrid (AMG). Given a vector dataset that has an underlying grid with n sample points p1, ..., pn, we define a so-called coupling matrix M = {mij}1<i,j<n. Given two points pi and pj, the entry mij essentially encodes the similarity metric f between the vector values v(pi) and v(pj) as follows: mij =    f(pi, pj), pi, pj are grid neighbors, 1 − k∈neighbors(i) mik, i = j, 0, otherwise. The diagonal entries mij describe the so-called self-coupling, which is set so that the sum of couplings of a point with all other points is 1. 10
  • 11. The preceding matrix M describes the finite element discretization of an anisotropic diffusion operator using piecewise linear basis functions. Given some domain D ∈ Rn , the equation ∂tu − div (A u) = 0 describes the diffusion in time of a scalar function u : D × [0, ∞) → R starting from an initial value u(t = 0). The discretization of the operator div(A u) produces our matrix M. In finite element terminology, M is called a stiffness matrix, a term that suggests the metaphor of coupling of the grid points. IT encodes the vector field structure on the finest level given by the dataset grid. Given a matrix M, AMG constructs a sequence of matrices M0 = M, M1 , ..., Mk , starting with the size S of the matrix M0 until the final matrix Mk , which has size 1, i.e., is a scalar value. This reduction in size is done by eliminating matrix entries involved in weak couplings and merging neighboring entries involved in similar strong couplings. This process is similar to the bottom-up agglomerative clustering described above. Multiscale IBFV. Consider again the original fine-scale IBFV noise N(x, y, t) that was sampled on a n × n image. Every pixel of this image can be seen as being represented by a constant basis function ψi which is 1 over that pixel and zero elsewhere. Hence, the noize term from equation (6.16) can be rewritten as N(x, y, t) = n2 i=1 ψi(x, y) f ((t + 1) mod 1) . Here, f(t) is exactly the same periodical function as in equation 6.17, Ni is the noise phase of the i th region corresponding to ψi, which is equivalent to the per-pixel noise phase N(x). We can generalize and define a multi-scale noise signal N(x, y, t) = sj i=1 ψj i (x, y) p (t + ri) . Here we use the basis functions on any level 1 < j < k of the AMG decomposition. By replacing the initial fine-scale noise N(x, y, t) with any of the multiscale noise signals Nj (x, y, t) defined by equation 6.23, we obtain a multiscale image-based flow visualization, or MIBFV method. MIBFV keeps all the strong points of its predecessor (dense field representation, real-time animation, intuitive representation, simple implementation) and adds a spatial multiscale aspect that emphasizes the vector field features at a user-chosen scale k. MIBFV is less suited to visualize time-dependent vector fields than IBFV. If the vector field changes, we must re-run the AMG decomposition and noise texture computation after every time step. 6.8 Illustrative Vector Field Rendering Illustrative vector visualizations use simple, well understood, visual metaphors for depicting vector fields. On the other hand, they use various rendering effects to simplify the perceived complexity of the final image, thereby making it easier to grasp. Depth-dependent halos.Given a set of streamlines, represented as curves, the method creates polygon strips of small constant width ∆, centered around the individual streamlines. These streams are similar to stream ribbons. However, in contrast to ribbons, they are oriented parallel to the viewing plane, using technique, known as billboarding. Also, their depth is modulated linearly from being equal to the depth coordinates of the visualized streamlines to a slightly lower value. Additionally strips are textured with a one-dimensional monochrome texture that assigns a fixed base color (black) to a narrow band δ around the center (streamline location) and white to the rest. When rendering these strips, the strips which are closer to each other than the value δ get visually merged and appear as a single compact shape rendered in the base color. Strips which are farther away from each other that δ in terms of depth, however, will show a distinct “halo”, as strips closer to the viewer visibly obscure further strips and get delineated by a white border. Depth-dependent halos can show a much larger amount of streamlines, with limited clutter and good depth perception, even if the rendering is monochrome. Also, streamlines which are close to each other get locally merged into thick black “bundles”, thereby creating an effective image-space simplification and clutter reduction of the rendering. 11
  • 12. 6.9 Conclusion Methods range from simple (vector glyphs) up to multiscale textures animated in real time (MIBFV. In recent years, new families of vector field visualizations techniques were created that exploit animation and dense visual representations, such as textures, as opposed to the “classical” vector field visualizations that use sparse geometric primitives, such as glyphs, streamlines, and stream surfaces. Two-dimensional surfaces permit a straightforward mapping to the 2D graphics viewpoint, which simpli- fies visualization problem. Three-dimensional volumetric vector fields pose a much more challenging problem due to the inherent occlusion of the visualization primitives, especially in case of dense visualizations. Ani- mation is an intuitive means of representing the time-dependent aspect. What have you learned in this chapter? In this chapter author discusses a number of popular visualization methods for vector datasets: vector glyphs, vector color-coding, displacement plots, stream objects, texture-based vector visualization, and the simplified representation of vector fields. Section 6.5 presents stream objects, which use integral techniques to construct paths in vector fields. Section 6.7 discusses a number of strategies for simplified representation of vector datasets. Section 6.8 presents a number of illustrative visualization techniques for vector fields, which offer an alternative mech- anism for simplified representation to the techniques discussed in Section 6.7 Chapter presents also feature detection methods, algorithm for computing separatrices on field’s topology, and top-down and bottom-up field decomposition methods. What surprised you the most? • That a very important domain for vector visualization is computational fluid dynamics (CFD). • That besides planes, other geometric objects can also be used to create displacement plots: like sphere and box for example. • That Multiscale IBFV (MIBFV) visualizations of a field can vary depending on its coarse-scale. What applications not mentioned in the book you could imagine for the techniques ex- plained in this chapter? Lowering opacity (increasing transparency) of streamlines or tubes alleviates occlusion problem in 3D Datasets. Imagine a rendering technique, which computes transparency for each pixel of a 3D scene based on the viewpoint, so that streamlines or tubes closer to the front viewing plane get higher transparency (since they are already in front of our eye - relatively easy to see); and parts or pixels farthest from the viewpoint get rendered with the lowest transparency levels (far corners are harder to see since they get blocked with items from the front of the scene). Using translucent elements (of depth-dependent opacity for the scene observed) might improve our ability to see through volumetric data. In order to visualize “multidimensional” information we can use glyphs with multiple (10 or more) degrees of freedom, as a multidimensional animated textures. By subsampling the dataset using a randomly distributed (instead of regularly arranged) set of points we can alleviate the subsampling problem, when subsampling grid is not aligned with the original grid. 1. EXERCISE 1 Consider a scalar field f(x, y) → R. The gradient f is a vector field, so we can compute its vorticity, v = rot( f). What is the value of v? Hints: Use the definitions of the gradient and vorticity based on partial derivatives of f. Gradient f is a 2-component vector: v = (vx = ∂f ∂x , vy = ∂f ∂y ). Our 2-component gradient vector field can be seen as a 3D vector: v = (vx, vy, vz = 0), which exists only on a plane vz = 0, where vx, vy are independent from z, meaning ∂vy ∂z = ∂vx ∂z = 0. The vorticity is a 3D vector quantity rot(v) = rot( f) = ∂vz ∂y − ∂vy ∂z , ∂vx ∂z − ∂vz ∂x , ∂vy ∂x − ∂vx ∂y There fore in our case we get the following value: rot(v) = 0, 0, ∂vy ∂x − ∂vx ∂y = 0, 0, ∂2 f ∂y∂x − ∂2 f ∂x∂y = (0, 0, 0) = 0. 12
  • 13. In other words, rot (grad v) = 0 for any vector field v. 2. EXERCISE 2 Consider now a 2D vector field v(x, y), and its vorticity rot v(x, y). We now compute the divergence field d = div(rot v). What is the value of d? Hints: Use the definitions of divergence and vorticity based on partial derivatives of a function of two variables. Let’s look at our field in 3D: v(x, y) = (vx, vy, vz = 0) rot v(x, y) = (sx, sy, sz) = ∂vz ∂y − ∂vy ∂z , ∂vx ∂z − ∂vz ∂x , ∂vy ∂x − ∂vx ∂y . d = div (rot v) = ∂sx ∂x + ∂sy ∂y + ∂sz ∂z In our case : d = ∂vz ∂y∂x − ∂vy ∂z∂x + ∂vx ∂z∂y − ∂vz ∂x∂y + ∂vy ∂x∂z − ∂vx ∂y∂z = 0. In other words, div (rot v) = 0 for any vector field v. 3. EXERCISE 3 Consider the following three 3D vector fields: v1(x, y, z) = (−y, x, 0) (4.1) v2(x, y, z) = (y, x, 0) (4.2) v3(x, y, z) = (3x, 3y, 0) (4.3) Plot these three vector fields using hedgehog glyphs (oriented arrows) for a square domain centered at the origin and embedded in the x y plane. 13
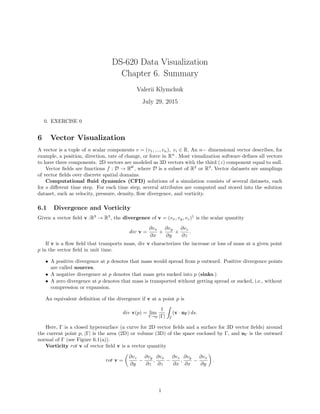
  • 14. Figure 1: Glyph visualization of a 2D vector field v1(x, y, z) = (−y, x, 0) on [−10, 10] × [−10, 10] domain with scaling factor 0.1. 14
  • 15. Figure 2: Glyph visualization of a 2D vector field v2(x, y, z) = (y, x, 0) on [−10, 10] × [−10, 10] domain with scaling factor 0.1. 15
  • 16. Figure 3: Glyph visualization of a 2D vector field v3(x, y, z) = (3x, 3y, 0) on [−10, 10] × [−10, 10] domain with scaling factor 0.035. 4. EXERCISE 4 Consider the following three 3D vector fields (the same ones as for Exercise 3): v1(x, y, z) = (−y, x, 0) (4.1) v2(x, y, z) = (y, x, 0) (4.2) v3(x, y, z) = (3x, 3y, 0) (4.3) Which of these three fields has a zero curl? Which has a zero divergence? Argue your answer by computing the actual divergence and curl values. 16
  • 17. div v1 = ∂(−y) ∂x + ∂(x) ∂y + ∂(0) ∂z = 0 + 0 + 0 = 0 div v2 = ∂(y) ∂x + ∂(x) ∂y + ∂(0) ∂z = 0 + 0 + 0 = 0 div v3 = ∂(3x) ∂x + ∂(3y) ∂y + ∂(0) ∂z = 3 + 3 + 0 = 6 rot v1 = 0, 0, ∂(x) ∂x − ∂(−y) ∂y = (0, 0, 2) = 2 rot v2 = 0, 0, ∂(x) ∂x − ∂(y) ∂y = (0, 0, 0) = 0 rot v3 = 0, 0, ∂(3y) ∂x − ∂(3x) ∂y = (0, 0, 0) = 0 5. EXERCISE 5 Vector field visualization is considered to be, in general, a more challenging problem than scalar visual- ization. Indeed, intuitively speaking, for a sampled dataset of, say, N points, a scalar field would have N values, whereas a (3D) vector field would have 3N values to show. Consider now the case of visualizing a scalar field with N samples vs visualizing a 3D vector field with N/3 samples. Both fields need to store the same amount of data values, i.e., N. Which of the following assertions do you support for this situation: • Visualizing both fields is, in general, equally challenging • Visualizing the vector field is, in general, more challenging than visualizing the vector field. Support your answer with a detailed explanation. Visualizing a scalar field with N samples is relatively easy, and can be implemented with height plots, and number of samples provides a good sampling rate. Visualizing vector fields is a harder task, since 3D signal can have more complex topography, it usually requires a higher sampling rate as well, which in our example is going to be compromised by lowering number of samples. This can compromise the effectiveness of 3D visualization, since computing normals, derivatives, isolines, and streamlines can be sensitive to errors due to interpolation. 6. EXERCISE 6 Consider a smooth 2D scalar field f(x, y), and its gradient f, which is a 2D vector field. Consider now that we are densely seeding the domain of f and trace streamlines in f, upstream and downstream. Where do such streamlines meet? Can you give an analytic definition of these meeting points in terms of values of the scalar field f? Hints: Consider the direction in which the gradient of a scalar field points. They can meet in critical points, such as sinks, sources, where ||v|| = 0 and values of f are close to maxima or minima. 7. EXERCISE 7 Consider a smooth 2D scalar field f(x, y), and its gradient f, which is a 2D vector field. Consider now the divergence d = div ( f), also called the Laplacian of f. What is the relation between the local extrema (minima and maxima) of f and those of d ? In local extrema of f 2D gradient f = 0 equals to zero and changes its sign. Divergence d = div( f) is a scalar ∂( fx) ∂x + ∂( fy) ∂y = ∂2 f ∂x2 + ∂2 f ∂y2 . None of the above statements is true. Extrema of gradient field and extrema of scalar field do not have to coexist. They do share the same location, in case if following condition holds: ∂3 f ∂x3 + ∂3 f ∂y3 + ∂3 f ∂y2∂x + ∂3 f ∂x2∂y = ∂2 f ∂x2 + ∂2 f ∂y2 = 0. 17
  • 18. 8. EXERCISE 8 Can any 2D vector field v(x, y) be seen as the gradient of some scalar field f(x, y)? That is: Given any vector field v, can we find a scalar field f, so that v(x, y) = f(x, y), for all points (x, y)? If so, argue why, and show how we construct f from v. If not, show and discuss a counter-example. Hints: Consider the vector calculus identities involving curl and gradient. Yes, for our vector field v(x, y) = (vx, vy) we can assign our scalar f to be f = vxx + vyy, so that f = (∂f ∂x , ∂f ∂y ) = (vx, vy) 9. EXERCISE 9 Intuitively, we can think of the (mean) curvature of an oriented 3D surface as a scalar function, defined on the surface, which takes large positive values where the surface is convex, large negative values where the surface is concave, and is zero where the surface is locally flat. How can we compute such a scalar curvature function using just the vector-field defined by the surface normals? We can compute such curvature by calculating gradient n (derivative) of the vector normal n = (nx, ny, nz), which defines our field v(x, y, z). Gradient n can describe the variation of surface normal at each point z = f(x, y), and clearly can be used as a measure of curvature. We can use cross product n× n to compute the rate of change of the surface normal, or acceleration, measured by the derivative of the tangent vector (the second derivative) as k = ||f (u)×f (u)|| ||f (u)||3 . where f (u) = −(nx, ny). Note: 1/||f (u)||3 = n3 z and ||f (u) × f (u)|| = ||n(u)×n (u)|| n3 z , so that k = ||n(u) × n (u)||. By the definition of cross product: u × v = i j k u1 u2 u3 v1 v2 v3 =   s1 s2 s3   =   u2v3 − u3v2 u3v1 − u1v3 u1v2 − u2v1   . We get: n × n =   s1 s2 s3   = i j k nx ny nz ∂ n ∂x ∂ n ∂y ∂ n ∂z =   ny ∂ n ∂z − nz ∂ n ∂y nz ∂ n ∂x − nx ∂ n ∂z nx ∂ n ∂y − ny ∂ n ∂x   , so we can now compute a measure of curavture k = ||n × n|| = s2 1 + s2 2 + s2 3 10. EXERCISE 10 Vector glyphs are one of the simplest, and most used, methods for visualizing vector fields. However, careless use of vector glyphs can lead to either visual clutter (too many glyphs drawn over the same small screen space) or visual subsampling (large areas in the field’s domain which do not contain any vector glyph). Given a 3D vector field, which we want to visualize with vector glyphs, describe all parameters that one can control, and how these should be controlled, to reduce both visual clutter and visual subsampling. Using higher scaling factor values that provides larger glyphs and better perceivable direction can elim- inate clutter. We can scale all the line glyphs into same length or to the average cell size at its origin to eliminate clutter, but it eliminates the use of glyph size as a visual cue. We can also color glyphs by the vector magnitude blue-to-red in order to strengthen length cues. By shading the line glyph from full color (or full opacity) at the glyph origin to the background color (or full transparency) at the line tip, a visual effect similar to a thin arrow can be obtained without the need of extra screen space. Drawing glyphs transparently helps fight occlusion in 3D, as well as using support isosurface does, when glyphs are rendered on top of some surface. 11. EXERCISE 11 18
  • 19. Consider the rectangular areas shown in the figure below. All areas have the same aspect ratio (2l, 1.5l). For each case, we define four 2D vector values v1, ..., v4 at the area’s vertices, and visualize these by the blue vector glyphs. Now, for each area, look at its center (indicated by a black point). What is the value of the vector field that you perceive there, based on the surrounding four blue glyphs? Draw a vector glyph at the central point to indicate the direction and magnitude of your perceived vector. Figure 4: Vector values perceived at the center of the area given vertex values. 12. EXERCISE 12 Consider the figure from the previous exercise (shown again below). For each area, compute the value of the vector field at the central black point, assuming that we are using bilinear interpolation of the four vertex values. Next, draw the resulting interpolated vectors using vector glyphs at the respective central points. Finally, compare the result with the one of the previous exercise. Do you see any differences? If so, which ones, and how do you explain them? 19
  • 20. Figure 5: Vector values perceived at the center of the area given vertex values. T−1 rect = (r, s) = (p − p1) · (p2 − p1) p2 − p1 2 , (p − p1) · (p4 − p1) p4 − p1 2 , where : p =(1, 0.75), p1 =(0, 0), p2 =(2, 0), p3 =(2, 1.5), p4 =(0, 1.5). (p − p1) =(1 − 0, 0.75 − 0) = (1, 0.75), (p2 − p1) =(2 − 0, 0 − 0) = (2, 0), (p4 − p1) =(0 − 0, 1.5 − 0) = (0, 1.5), p2 − p1 2 =(2 − 0)2 = 4, p4 − p1 2 =(1.5 − 0)2 = 1.52 . (r, s) = T−1 rect = (1, 0.75) · (2, 0) 4 , (1, 0.75) · (0, 1.5) 1.52 = 2 4 , 0.75 · 1.5 1.52 = 1 2 , 1 2 . Calculating 4 basis functions as follows: Φi(T−1 rect) =    Φ1 1(r, s) = (1 − r)(1 − s) = (1 − 1/2)(1 − 1/2) = 1/4, Φ1 2(r, s) = r(1 − s) = (1/2) · (1 − 1/2) = 1/2 × 1/2 = 1/4, Φ1 3(r, s) = rs = 1/2 × 1/2 = 1/4 = 1/4, Φ1 4(r, s) = (1 − r)s = (1 − 1/2) · (1/2) × 1 = 1/4. Finally, we calculate value for: v(p) = ˆp(x, y) = 4 i=1 viΦ1 i = 1 4 4 i=1 vi 20
  • 21. v(p) = 1 4 ((1, 0) + (−1, 1) + (1, 0) + (1, −1)) = 1 4 (1 + (−1) + 1 + 1, 0 + 1 + 0 − 1) = 1 4 (2, 0) = (1/2, 0); v(p) = 1 4 ((1, 0) + (0, 1) + (1, 1) + (2, 1)) = 1 4 · (1 + 0 + 1 + 2, 0 + 1 + 1 + 1) = 1 4 (4, 3) = (−1/4, 0); v(p) = 1 4 ((−1, 2) + (−1, −1) + (0, −2) + (1, 1)) = 1 4 (−1 − 1 + 0 + 1, 2 − 1 − 2 + 1) = 1 4 (−1, 0) = (−1/4, 0); v(p) = 1 4 ((0, 2) · +(0, 1) + (1, 1) + (2, 1)) = 1 4 · (0 + 0 + 1 + 2, 2 + 1 + 1 + 1) = 1 4 · (3, 5) = (3/4, 5/4). Answer: a) v(p) = (1/2, 0), b) v(p) = (1, 3/4), c) v(p) = (−1/4, 0), d) v(p) = (3/4, 5/4). 13. EXERCISE 13 Consider the use of a 3D vector-glyph plot for the visualization of a 3D vector field. Each glyph is drawn as an arrow oriented and scaled by the vector field’s direction and magnitude respectively. Without any additional cues such as interactively changing the viewpoint, it is clearly very hard to perceive the correct orientation of the resulting arrow glyphs in 3D. Propose and describe two visual enhancements (not using interaction) that would make the perception of 3D orientation of the resulting vector glyphs easier from a given viewpoint. Our perception of orientation in 3D will become easier if we use semitransparent glyphs. Closer glyphs now case lee occlusion allowing us to see deeper inside the dataset. We can alleviate the occlusion problem by randomly subsampling our dataset. An interesting effect can be achieved by using monochrome, instead of color mapped, transparent line glyphs (arrows have larger screen size). The high velocity flow core is now more visible as a dark region. Glyph visualization of stream surfaces, where vectors are tangent to the surface, are easier to understand, since the glyphs tend to stay on the surface, rather than on surfaces, which the field is not tangent, where the glyphs get visually entangled and cause more visual clutter. Evenly-spaced streamline seeding is applicable to 3D datasets. Streamlines and glyphs evenly spaced in 3D space can be generated by methods, similar to FPSS (Farthest Point Streamline Seeding method). However this does not guarantee that the rendered streamlines will be evenly spaced in screen space. One approach is to generate seeds on a curved surface embedded in 3D, backproject these seeds into 3D, and trace streamlines from these 3D seed points. Streamlines are next selected for rendering, if their screen-space projections are evenly spaced. We can use slice planes, isosurfaces of various flow quantities (such as vector magnitude), or stream surfaces can be used. We can also take a given seed surface S3D and project vector field, restricted to S, to the 2D (screen) image plane. Next, we apply the 2D evenly-spaced streamline generation to the projected vector field over the 2D projection S2D. We can also use tapered streamlines, by having the thickness of a streamline coded by the distance to the image plane. Texture based visualizations with color-coding on 3D surface. Adding shading to the texture on the surface helps to convey spatial cues about the object geometry. 14. EXERCISE 14 Consider a 2D vector field defined over a 2D square domain. At each point p, the vector field is v(p) = p−c ||p−c|| R( π 2 ) . Here, c is the center of the square, and R(α) denotes a rotation by α degrees clockwise. We visualize this vector field with a special kind of glyph: At chosen sample points p, we draw a square which has two edges parallel to the vector (v)Rβ , where β is a small angle of about 20 degrees. A visualization using this technique is shown in the image below. For this type of vector field and visualization, answer in detail the following questions: 21
  • 22. • What are the streamlines of the vector field looking like? • Looking at the figure below, what can you say about the vector field? Describe the vector field as you see it in the figure in a few sentences. Does this visualization accurately convey the vector field? If so, argue why. If not, argue what are the differences between the perceived vector field and the actual one. • Which design elements of the glyph (color, shape, size, orientation, other) influence the strongest the perception of the vector field? Figure 6: Vector field depicted by the square glyphs. • Streamlines of such field are parralel to the radius and will follow outwards direction from the center of the domain. • I see a vector field of constant magnitude |v| = 1 pointing in the direction of p from the center of the domain along its radius, after it was rotated by 20 degrees clockwise. Instead of unit 1 squares lined up in the direction of their radius, we see each of them rotated by 20 degrees now. Constant size of the square tells us that magnitude of a vector field is constant (equals to 1) over entire domain. • Color of the glyph makes me think of clockwise and counterclockwise spin, but it is not the case here. It is unclear first why domain is being sampled in circles. Placement of sample points combined with black and white colors creates an effect of rotating rings, which distracts alot of attention. Shape of the square tells us that our field is invariant in terms of 90 degrees rotation along the direction of its radius. 15. EXERCISE 15 Visualizing time-dependent vector fields (either in the 2D or 3D case) is highly challenging. The main problem here is that, apart from the difficulty of showing the direction and magnitude of a vector field, we 22
  • 23. have to somehow show how these quantities change in time. One possible way to do this is to highlight spatial regions where these quantities significantly change at each time moment - that is, to compute a derivative of the vector field over time, and to overlay this information atop of an instantaneous vector field visualization generated by classical methods, such as e.g. vector glyphs, streamlines, or image-based techniques. In this context, propose a metric that would intuitively measure the change in time of the direction and/or magnitude of a vector field. Describe your metric analytically, and argue why it would be a good solution for the above goal of highlighting regions of rapid change. We can compute gradient v of our vector field and normal n. Gradient points in the direction of the maximal slope. Length of the gradient vector || v|| is a measure of rate of the rate of change in that direction. We can split our domain into 2 by drawing isoline 2D contours or 3D isosurfaces for value of gradient v ≥ V ar closes to some threshold value V ar. Then vector field limited to our isosurface can be displayed with greater luminance, and lower luminance can be used for visualizing same vector field over remaining parts of the domain, where rate of variation is lower (or less significant). 16. EXERCISE 16 Simplified visualizations for vector fields reduce the problem of showing the vector data at each sample point in the field’s domain to the problem of partitioning the domain into a set of regions, so that the field’s variation over any such region can be easily represented by classical techniques such as vector glyphs or streamlines. For this to work, we need to know how to represent the ‘average’ vector field over some given spatial region R of a domain, where we know that our vector field has limited variation. Describe two visual representation techniques that can achieve this type of representation. Hints: • First, define what is the constraint of the vector field variation over a given region R • Next, propose a way to represent the ‘average’ vector field over R, as well as the variation (deviation from the average) of the field over R Feature detection methods reduce the vector field to a set of features of interest, described as set of parameters, such as feature type, position, extent and strength. Multiscale Image Based Flow Visualization (MIBFV) uses a tool called algebraic multigrid (AMG), where coupling n × n matrix M (stiffness matrix) encodes the similarity metric f. It describes the finite element discretization of an anisotropic diffusion operator using piece-wise linear basis functions. It provides vector field decompositions on different levels. Then IBFV technique advects a spatial noise signal, whose luminance changes periodically in a given vector field, crating effect of thin, contrasting animated streamlines that move with the flow. It emphasizes the vector field features at a user chosen scale k, and can combine several scales into single visualization. AMG allows identifying few critical points of interest and MIBFV presents high detail field visualization around those critical points, and shows a lower amount of detail in the surrounding regions. The average vector field over a cell can be computed as the average of the cell’s vertex attributes: fi = pj ∈ points(ci) fj C , where C = |points(ci)| is the number of vertices of cell ci. 23