👉Chandigarh Call Girls 📞Book Now📞👉 9878799926 👉Zirakpur Call Girl Service No ...
QlikView Solutions Title Boosts Retail Decision Making
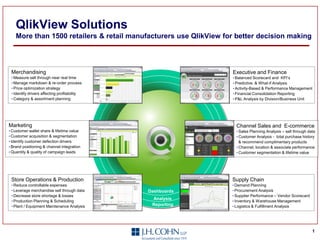
1. QlikView Solutions
More than 1500 retailers & retail manufacturers use QlikView for better decision making
Merchandising Executive and Finance
• Measure sell through near real time • Balanced Scorecard and KPI’s
• Manage markdown & re-order process • Predictive & What-if Analysis
• Price optimization strategy • Activity-Based & Performance Management
• Identify drivers affecting profitability • Financial Consolidation Reporting
• Category & assortment planning • P&L Analysis by Division/Business Unit
Marketing Channel Sales and E-commerce
• Customer wallet share & lifetime value • Sales Planning Analysis – sell through data
• Customer acquisition & segmentation • Customer Analysis - total purchase history
• Identify customer defection drivers & recommend complimentary products
• Brand positioning & channel integration • Channel, location & associate performance
• Quantity & quality of campaign leads • Customer segmentation & lifetime value
Store Operations & Production Supply Chain
• Reduce controllable expenses • Demand Planning
• Leverage merchandise sell through data Dashboards • Procurement Analysis
• Decrease store shortage & losses • Supplier Performance – Vendor Scorecard
Analysis
• Production Planning & Scheduling • Inventory & Warehouse Management
• Plant / Equipment Maintenance Analysis Reporting • Logistics & Fulfillment Analysis
1
2. QlikView: Number One in Ease of Use
is #1 in:
Ease of use
Scorekeeping to KPIs
Dashboard Satisfaction
and Usage
*Gartner: BI Platforms User Survey, 2010
For more information call Dave DeBonis at 973-871-4011 or email ddebonis@jhcohn.com
2
3. QlikView: Number One in BI Customer Loyalty
is #1 in:
Customer loyalty
Intention to buy more licenses
Query performance
*BARC: BI Survey 9, September 2010
For more information call Dave DeBonis at 973-871-4011 or email ddebonis@jhcohn.com
3
4. What would it mean to your bottom line if you…
Could quickly integrate disparate data sources and assess the present and historical
performance of your loan originators and loan portfolio?
Make changes to your critical reports in minutes, hours and days vs. weeks and months?
Could quickly offer visibility and analytical capability directly to decision makers,
empowering them to make better decisions regarding your markdown optimization
process, inventory management and cross channel performance?
QlikView
The Power of Simplicity
Next Generation Business Intelligence
4
5. QlikView: Powerful, Intuitive, Easy-to-Use
QlikView creates value in organizations through data driven
decisions:
Access & consolidates disparate data
Search data associatively
Summarize, visualize and analyze the data
Associative
Consolidate Visualize
Search
5
6. Associative Search Puts Users in Control
Traditional Associative
Region Region
State
Sales
State Person
Product
Sales
Person
Product
IT Driven User Driven
• Linear, pre-defined thinking • Follows the user
• Insights missed in hidden data • All data, always visible
• Months to change • Insight driven
• Data-centric • Minutes to change
6
7. A Traditional Reporting Solution looks like this...
1. Data sources pre-determined by IT
2. Data goes through ETL (Extract, Transform, Load) process
3. Data loaded into data warehouse and modeled into cubes
4. Data loaded into Business Intelligence / Reporting Solution Application
5. Every time data changes, it goes back and forth through this process
7
8. Now let’s look at QlikView’s Patented Approach…
1. Easily consolidates multiple data sources
2. Loads all data into memory
3. Enables real-time associative search and analysis
8
9. QlikView Bypasses the Traditional BI Stack
Challenges
Traditional BI Stack
User Interface, Dashboards, • User Interface
Scorecards, and Reports
• Lots of tools • One tool
• Chart and Report
• Multiple vendors • One vendor Engine
OLAP, Query, and
Reporting Tools
• IT driven • End-user driven • Analysis Engine
Data Marts • Months to change • Minutes to change • Data Compression
• High cost • Low cost • Integration
Data Warehouse
Integration Layer (ETL)
Unstructured Data Unstructured
ERP CRM ERP CRM
Data Warehouse Data
9
10. QlikView Delivers A Consumer Approach
for Business Software
People Love Consumer App People Love Using QlikView
Experiences
• Instant results
• Easy to use
• Intuitive interface
• Simplifies complex analysis
• Self service with minimal training
10
11. The QlikView Customer Experience
Findings from IDC/QlikTech Joint Survey
BI Initiative Success and Satisfaction
• 96% of customers are satisfied with QlikView
ROI (Return On Investment)
• 186% Return On Investment
• 6.5 month payback period
Time to Value
44% deployed QlikView in 1 Month
77% deployed QlikView in 3 Months
50% reduction in information access and analysis time
-100 0 100
11
12. Aberdeen: QlikView Dashboards
Outperform Best-in-Class
QlikView rates above Best-in-Class in dashboard accuracy
Yearly Dashboard Cost Per User % Driven by Line of Business User
$22.41 62%
$28.53 48%
$35.58 41%
*Aberdeen: QlikView Customers Outperform the Best-in-Class with Dashboards, August 2010
12
13. Migration Complexity score
Source: Gartner, BI Platform
Magic Quadrant Customer
Survey conducted November
2009
In the BI Platform Magic Quadrant
customer survey conducted
among 897 participants,
respondents were asked to rate
their migration experience on a
scale of 1 to 4; with 1 being simple
and 4 complex. The weighted
average score was calculated
based on the sum of multiplying
the score by the percentage of
respondents that selected each
score for each vendor.
13
14. For more information call me at 973-871-4011
or email me at ddebonis@jhcohn.com
14