Sasakawa Africa Association, Chris Dowswell
•
2 likes•798 views

Chris Dowswell, Executive Director Sasakawa Africa Association, spoke during the Thursday (12 November) WILD9 plenary on Wilderness and People - A new agriculture for wilderness and climate change.

Recommended
Recommended
More Related Content
What's hot
What's hot (20)
Viewers also liked
Viewers also liked (18)
Similar to Sasakawa Africa Association, Chris Dowswell
Similar to Sasakawa Africa Association, Chris Dowswell (20)
More from WILD Foundation
More from WILD Foundation (20)
Recently uploaded
Recently uploaded (20)
Sasakawa Africa Association, Chris Dowswell
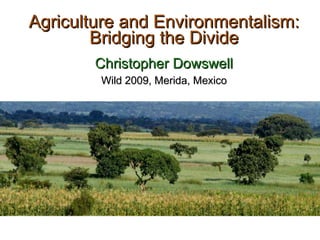
- 1. Agriculture and Environmentalism: Bridging the Divide Christopher Dowswell Wild 2009, Merida, Mexico
- 2. World Population Growth and Food & Environmental Implications 12 10 8 6 4 2 0 10000 BC 8000 BC 6000 BC 1000 AC 1000 BC 2000 AC 2100 2050 2150 Beginning of Christian Era Billions 8 billion 4 billion 6 billion 2 billion 2030 1975 2000 1935 1850 1650 Beginning of Modern Medicine Beginning of Agriculture Discovery of Modern Drugs (Sulfa & Antibiotics) Developing Countries Industrialized Countries 10 billion
- 3. South Asia Pre-Green Revolution 1965 population = 400 million 60% of population poor and hungry; growing social instability 1965 cereal imports = 10 million mt and rising rapidly; dependency on U.S. PL 480 imports Geopolitics—Indira Gandhi & LBJ 40 million ha irrigation & good transport Wheat yields under 1 t/ha; Rice yields around 1.5 t/ha Unresponsive, inward-looking public agriculture sector
- 4. The Green Revolution Testing of HYV wheat in Asia during 1963-65 Production campaigns launched in Pakistan and India in 1965-66 Massive imports of HYV wheat seed and fertilizers Minimum floor price; subsidized seed and fertilizers Wheat self-sufficiency in Pakistan in 1968 and in India in 1972
- 5. Green Revolution: Changes in Factors of Production in Developing Countries of Asia Adoption of Modern varieties Source: FAOSTAT and CIMMYT and IRRI estimates Wheat M ha/% area Rice M ha/% area Irrigation 000 ha Fertilizer Use, 000 nutrient t Tractors, 000 Production, million t 1965 0/0% 0/0% 87 2 0.2 309 1970 14/20% 15/12% 106 10 0.5 463 1980 39/49% 55/43% 129 29 2.0 618 1990 60/70% 85/65% 158 54 3.4 858 2000 70/84% 100/74% 175 70 4.8 962 2005 72/87% 102/76% 178 77 6.4 1,017
- 6. Profiles in Courage Malik Khuda Baskh Bucha Minister of Agriculture, Pakistan C. Subramaniam Minister of Agriculture, India
- 7. World Cereal* Production–Areas Saved Through Improved Technology, 1950-2000 CEREAL PRODUCTION 1950 650 million tonnes 2000 1,900 million tonnes 1,800 1,400 1,000 600 1950 1960 1970 1980 1990 2000 LAND SPARED 1.1 billion ha LAND USED 660 million ha Million hectares 200 * Uses milled rice equivalents Source: FAO Production Yearbooks and AGROSTAT
- 10. World Food Supply: We will have to double it by 2050 80% of future growth must come from lands already in use. Most of the production growth must occur in countries where food is consumed. Limited potential for land expansions, except in the Americas and Sub-Saharan Africa. Irrigation expansion crucial to meeting food demand.
- 12. GM Crops for 21 st Century Insect and Disease Resistance Nutritional Quality Climatic Stresses Herbicide Resistance Genetic Yield Potential
- 14. Netherlands Vietnam Japan United Kingdom China France Brazil United States India Mexico South Africa Cuba Benin Malawi Ethiopia Malí Burkina Faso Nigeria Tanzania Mozambique Guinea Ghana Uganda Kg/ha Source: FAOSTAT, July 2006 0 100 200 300 400 500 600 Consumption of fertilizer nutrients per hectare of arable land in selected countries, 2004
- 15. Promote Nitrogen-fixing Green Manure/Cover Crops Sesbania spp. Mucuna spp. Calliandra spp.
- 17. Improve Efficiency of Irrigated Agriculture 70% of global water withdrawals 17% of cultivated land (275 million ha, 200 million in developing countries) 40% of world food harvest (57% of cereal production) By 2030, FAO expects world’s irrigated area to increase by 50 million ha.
- 18. “ You Cannot Build Peace on Empty Stomachs.” John Boyd Orr Nobel Peace Laureate First FAO Director General