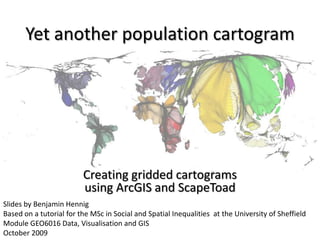
Creating gridded cartograms using ArcGIS and ScapeToad
•
5 j'aime•3,532 vues

Slides by Benjamin Hennig, Based on a tutorial for the MSc in Social and Spatial Inequalities at the University of Sheffield, Module GEO6016 Data, Visualisation and GIS, October 2009

Recommandé
Recommandé
Contenu connexe
Tendances
Tendances (20)
Similaire à Creating gridded cartograms using ArcGIS and ScapeToad
Similaire à Creating gridded cartograms using ArcGIS and ScapeToad (20)
Plus de Benjamin Hennig
Plus de Benjamin Hennig (20)
Dernier
Dernier (20)
Creating gridded cartograms using ArcGIS and ScapeToad
- 1. Yet another population cartogram Creating gridded cartograms using ArcGIS and ScapeToad Slides by Benjamin Hennig Based on a tutorial for the MSc in Social and Spatial Inequalities at the University of Sheffield Module GEO6016 Data, Visualisation and GIS October 2009
- 2. Data • Population – Gridded Population of the World (GPWv3, http://sedac.ciesin.columbia.edu/gpw/) • Country Shapes – ESRI Sample Data or – Global Administrative Boundaries (http://gadm.org/)
- 3. GIS works I • Preparing the grid: Creating a 1° fishnet ArcToolbox: Data Management Tools Feature Class Create Fishnet
- 4. GIS works I • Preparing the grid: Creating a 1° fishnet ArcToolbox: Data Management Tools Feature Class Create Fishnet
- 5. GIS works II Intermediate steps: • Coverting grid to polygons (ArcToolbox Data Management Tools Features Feature to Polygon) • Adding basedata: – population raster (gpw_1deg.bil) – country shapes (countries2007.shp)
- 6. GIS works IV • Converting the population raster: ArcToolbox: Conversion Tools From Raster Raster to Point
- 7. GIS works IV • Converting the population raster: ArcToolbox: Conversion Tools From Raster Raster to Point
- 8. GIS works V • Assigning population values to grid: ArcToolbox: Analysis Tools Overlay Spatial Join
- 9. GIS works V • Assigning population values to grid: ArcToolbox: Analysis Tools Overlay Spatial Join
- 10. GIS works VI • Cutting out the continents: ArcToolbox: Analysis Tools Overlay Intersect
- 11. GIS works VI • Cutting out the continents: ArcToolbox: Analysis Tools Overlay Intersect