2. 88
P. Duelli, M.K. Obrist / Agriculture, Ecosystems and Environment 98 (2003) 87–98
Fig. 1. Provisional domain tree of biodiversity based on the survey of 125 text documents in English (Kaennel, 1998). Concepts used by various authors to define biodiversity
are in square boxes, related concepts in rounded boxes. Type and direction of conceptual relationships are indicated by arrows. Synonyms and quasi-synonyms are in italics.
3. P. Duelli, M.K. Obrist / Agriculture, Ecosystems and Environment 98 (2003) 87–98 89
2. Why is it so difficult to reach a consensus on biodiversity has sometimes been used to allude to or
the use of biodiversity indicators? indicate some aspect of environmental quality.
If a species or a group of species is a good indicator
The complexity of all the aspects of the term bio- for lead contamination, it may not indicate biodiver-
diversity is illustrated in Fig. 1. It is obvious that sity, i.e. there may not be a linear correlate to biodi-
no single indicator for biodiversity can be devised. versity. It is fundamentally a contamination indicator,
Each aspect of biodiversity requires its own indicator. or an environmental indicator (McGeoch, 1998) rather
The difficulties for reaching a consensus on the use than a biodiversity indicator.
of biodiversity indicators are manifold. They imply However, “real” biodiversity indicators may be
differing choices for values and measures, which will needed to measure the impact of e.g. lead contami-
be discussed here more in detail. nation on biodiversity itself (indicator FOR biodiver-
Terms such as biodiversity, indicator or index are sity). Such an assessment is different from measuring
not well defined and their use varies between different the impact of lead on a selected taxonomic group,
countries and disciplines. Dismissing research findings which had been chosen because it is especially sensi-
or scientific reports simply on the grounds of differing tive to lead poisoning (indicator FROM biodiversity).
views on the use of particular terms (semantic discrim-
ination) would be counterproductive, but study reports
must clearly state what is meant by the terms used. A 4. Alpha-diversity, or contribution to higher
helpful review on indicator categories for bioindica- scale biodiversity?
tion is given by McGeoch (1998).
In this paper, the term indicator is used in the sense A second major dichotomy in the value system for
of any measurable correlate to the entity to be as- biodiversity indicators is the question of whether the
sessed: a particular aspect of biodiversity. species (or allele, or higher taxon unit) diversity of a
The most promising and convincing indicators of given area is to be indicated (local, regional or national
biodiversity are measurable portions of the entity level), or if the contribution of the biodiversity of that
that we consider to represent a target aspect of bio- area to a higher scale surface area (regional, national,
diversity. The term index is used here in the sense global) is important.
of a scaled measure for one or several concordant In the first case (alpha-diversity, e.g. species rich-
indicators. ness of an ecological compensation area), an indicator
ideally has to be a linear correlate to the biodiversity
aspect or entity of the surface area in question. Each
3. Indicator FOR or FROM biodiversity? species has the same value.
In the second case, the value of the measurable units
A first major source of misunderstanding is, whether of biodiversity (alleles, species, ecosystems) depends
biodiversity itself is to be indicated, or whether cer- on their rarity or uniqueness with regard to a higher
tain components of biodiversity are used as indica- level area. A nationally rare or threatened species in
tors for something else. Until 1990, the search for a local assessment has a higher conservation value
bioindicators had focussed on indicators of “envi- than a common species, because it contributes more
ronmental health” or ecological processes such as to regional or national biodiversity than the ubiqui-
disturbance, human impact, environmental or global tous species. Thus a biodiversity indicator in the latter
change (Hellawell, 1986; Spellerberg, 1991; Meffe case not only has to count the units (alleles, species,
and Carroll, 1994; Dufrene and Legendre, 1997). ecosystems), but it has to value them differently and
After the world-wide launch of the term biodiversity add the values.
at the Rio Convention in 1992, there was a sudden The best known examples are red list species. For
and drastic shift in the published literature towards measuring alpha-diversity, they are not given a value
the search for indicators of biodiversity itself (Noss, that is greater than any other species in a plot or trap
1990; Gaston and Williams, 1993; Gaston, 1996a; sample, but for measuring the conservation value of a
Prendergast, 1997). Since then, however, the term plot, their higher contribution to regional, national, or
4. 90 P. Duelli, M.K. Obrist / Agriculture, Ecosystems and Environment 98 (2003) 87–98
even global biodiversity has to be recognised. Raised dex, the Simpson index and Fisher’s alpha (Magurran,
bogs are notorious for their poor species richness, 1988). Recent observations (Duelli, unpubl.) have
but if only a few raised bogs are left within a coun- shown that when undergraduate biodiversity students
try, the few characteristic species present in a “good in entomology lectures have to choose which of the
bog” are of very high national importance. The prob- two communities shown in Fig. 2 (without seeing the
lems of estimating complementarity or distinctness text below them) they consider to be more diverse,
are addressed e.g. by Colwell and Coddington (1994) more than half of them decide for the left popula-
and Vane-Wright et al. (1991), endemism and spatial tion, because they consider evenness to be of greater
turnover by Harte and Kinzig (1997). importance than species numbers. When individuals
This dichotomy between “species richness” and from other disciplines were asked during lectures and
“conservation value” is the most fervently debated seminars, particularly conservationists and extension
issue among applied biologists concerned with biodi- workers in agriculture and forestry, species numbers
versity indicators, and a recurrent source of misunder- are decisive. In recent years, indices involving even-
standings. It will be elaborated further in the chapter ness have essentially fallen out of favour, mostly
on value systems. because they are difficult to interpret (Gaston, 1996c).
Particularly in agriculture or forestry, single species
are often collected in huge numbers with standardised
5. Indicator for what aspect of biodiversity? methods, which results in a drastic drop of evenness
and hence yields low diversity values, in spite of
After agreement on indicators FOR biodiversity, comparatively high species richness.
and a decision between “alpha-diversity” and “con- The definition of biodiversity given in the interna-
tribution to higher scale biodiversity”, there is still tional Convention on Biological Diversity (Johnson,
potential for disagreement on “what is biodiversity?” 1993) encompasses the genetic diversity within
(Gaston, 1996c). In practice, in a majority of cases, species, between species, and of ecosystems. Fur-
species are “the units of biodiversity” (Claridge et al., thermore, Noss (1990) distinguished three sets of
1997). However, species diversity can be measured as attributes: compositional, structural and functional
simple number of species, usually of selected groups biodiversity (see also Fig. 1). The most common ap-
of organisms, or species richness may be combined proach is to measure compositional biodiversity. Pre-
with the evenness of the abundance distribution of the sumably, both structural and functional biodiversity
species. The best known indices are the Shannon in- are either based on or lead to higher compositional
Fig. 2. “Which of the two populations do you consider to have a higher biodiversity?” A choice test for biodiversity evaluation regularly
offered by the first author to students and at public lectures. For the vote, only the upper part without text is shown.
5. P. Duelli, M.K. Obrist / Agriculture, Ecosystems and Environment 98 (2003) 87–98 91
diversity. We are convinced that ecosystem diver- better quantifiable measures of biodiversity, such
sity, as well as structural and functional diversity, is as species richness (Gaston, 1996b; Claridge et al.,
somehow reflected in the number of species present. 1997).
If they are not correlated with species richness, they The aspect of intraspecific diversity is a different
must be special cases and not representative as biodi- case. To our knowledge there is no published example
versity indicators. More trophic levels will normally of a tested correlation between inter- and intraspecific
include more species, and a higher structural diversity diversity.
will harbour more ecological niches. In fact, there is
increasing evidence that at least for some taxonomic
groups, species numbers are correlated with habitat 6. Value systems
heterogeneity (Moser et al., 2002), but not in others
(Rykken and Capen, 1997). People involved in developing or using biodiversity
For all these hierarchical separations or entities indicators are influenced by their personal and/or pro-
within the huge concept of biodiversity, separate fessional goals. They all may want to measure or mon-
comprehensible indicators can be researched and de- itor biodiversity, but they address different aspects of
veloped. In many cases, however, a rigorous scientific it. Their focus depends on their motivation for deal-
test may show that the conceptual entities are difficult ing with biodiversity. In an agricultural context, and
to quantify (Prendergast, 1997; Lindenmayer, 1999; in an industrialised country in Europe, the three most
Noss, 1999), or they are basically reflected in other, important motivations to enhance biodiversity are
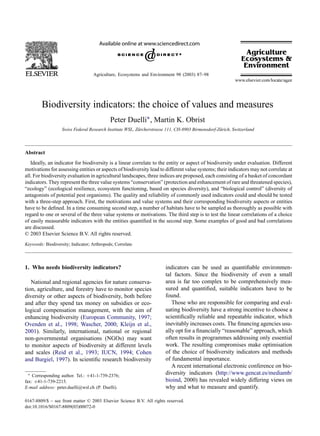
Fig. 3. Illustration of the hypothesis that abundant species usually are of higher ecological but lower conservation value, in contrast to
rare and threatened species. Stars indicate red list species collected with pitfall traps, yellow water pans and window interception traps in
a semidry meadow (Duelli and Obrist, 1998). Number of individuals (N Ind(log)) are plotted versus number of species (N species).
6. 92 P. Duelli, M.K. Obrist / Agriculture, Ecosystems and Environment 98 (2003) 87–98
1. Species conservation (focus on rare and endangered of “species conservation” and “ecological resilience”
species). is illustrated in Fig. 3.
2. Ecological resilience (focus on genetic or species Prendergast et al. (1993) found low coincidence of
diversity). species-rich areas and areas harbouring rare species
3. Biological control of potential pest organisms (fo- for either plants, birds, butterflies or dragonflies. An
cus on predatory and parasitoid arthropods). investigation of carabid beetles in Scotland (Foster
et al., 1997) showed that neither the number of red
There are additional motivations, of course, but list species nor the number of stenotopic (faunistically
either they are closely related to the ones mentioned interesting) species are correlated with the mean total
here, or their causal link to biodiversity is less clear number of carabid species in a variety of habitats such
(e.g. sustainability, landscape protection, cultural as moorland, grassland, heathland, peat, saltmarsh,
heritage). bracken and swamps (Fig. 4). In an intense investiga-
Each of these three aspects of biodiversity requires tion with 51 trap stations and standardised sampling
its own indicators. They often do not correlate with methods in field and forest habitats in Switzerland,
each other or even show a negative correlation. Con- the number of red list species of all identified arthro-
sequently, simply adding up different indicators may pod groups was not significantly correlated to overall
lead to misinterpretations, as long as they do not ad- species richness per trap station (Fig. 5), while e.g.
dress the same aspect of biodiversity. Species con- the numbers of aculeate Hymenoptera species corre-
servation focusses on rare and threatened species and lated well (R2 = 0.88; Fig. 6). In an assessment of
often regards more common species in a derogatory the effects of ecological compensation measures in
way as ubiquists of little interest. Ecologists, on the Swiss crop fields and grassland, the number of but-
other hand, focus more on abundant species, because a terfly species did not show any correlation with the
species on the verge of extinction is likely to have less species numbers of spiders (Jeanneret, pers. comm.).
significant ecological influence. The hypothesis of an In an effort to test the suitability of Collembola as
almost vicarious relationship between the motivations indicators of the conservation value of Australian
Fig. 4. Neither red list carabid species nor stenotopic carabid species are correlated significantly with the average number of carabid species
collected in 18 types of habitats using pitfall traps. Data from Foster et al. (1997).
7. P. Duelli, M.K. Obrist / Agriculture, Ecosystems and Environment 98 (2003) 87–98 93
Fig. 5. No significant correlation exists between the number of red list species (from numerous arthropod taxa) and the “overall” number of
arthropods collected with flight traps, pitfall traps and yellow water pans at the same 51 locations (Araneae, Coleoptera, Diplopoda, Diptera
(Syrphidae only), Heteroptera, Hymenoptera (Aculeata only), Isopoda, Mecoptera, Megaloptera, Neuroptera, Raphidioptera, Thysanoptera).
Data from agricultural areas (Duelli and Obrist, 1998) and forest edges (Flückiger, 1999).
grasslands, Greenslade (1997) found no correlation Jones index for the stock exchange. The measured
with species numbers of ants and carabid beetles. indicators within one basket have to be fairly con-
The optimal approach is to select a “basket” of cordant and are pooled to form an index. The re-
indicators for each motivation, similar to the Dow sult is a set of three separate indices for the three
Fig. 6. Species numbers of aculeate Hymenoptera (bees, wasps and ants) show excellent correlation with the overall number of arthropod
species at 51 locations (for details of data sources see Fig. 5).
8. 94 P. Duelli, M.K. Obrist / Agriculture, Ecosystems and Environment 98 (2003) 87–98
basic motivations “conservation”, “ecology” and “pest species (Duelli, 1994). Inevitably, the choice of the
control”. groups of organisms used for an inventory depends
strongly on the red lists available, and on the avail-
ability of specialists to identify the listed organisms.
7. How to select indicators for the three main Lacking the information on the second step (full
motivations account of the conservation value of an area), it is
not currently possible to come up with a scientifically
7.1. Several steps are necessary tested indicator for that value. Nevertheless, a correla-
tion between the cumulated conservation values of all
The most accurate indicators of biodiversity are presently available red listed species per habitat with
proven linear correlates of the entity or aspect of biodi- the conservation values of single taxonomic groups,
versity being evaluated. McGeoch (1998) proposed a such as birds, butterflies or carabids, would at least
nine-step approach for selecting bioindicators among give greater credibility to the red list species approach.
terrestrial insects. Basically, the whole procedure can In addition to red list status (degree of threat of ex-
be separated into three steps. The first step is to de- tinction), species values have been calculated on the
fine the aspect or entity in as quantifiable a way as bases of national or global rarity (Mossakowski and
possible. The second step is to actually quantify that Paje, 1985) or endemism. The rationale in the context
aspect or entity in a statistically reliable number of of habitat evaluation is that the presence of a nation-
cases. The third step is a rigorous test for linear cor- ally or globally rare species increases the biodiversity
relation in a set of proposed indicators. The urgent value of that habitat, because it contributes more to
need to perform a scientifically solid test has been ad- the conservation of national or global biodiversity than
vocated repeatedly (Balmford et al., 1996; McGeoch, the presence of a ubiquitous species.
1998; Niemelä, 2000). Only after a reliable basket of indicators for con-
Starting with the first step, the three mayor motiva- servation value has been established, are further steps
tions for protecting or enhancing biodiversity in agri- possible to test the correlative power of potential in-
cultural landscapes are differentiated. dicators such as length of hedgerows, amount of dead
wood, or the surface of ecological compensation ar-
7.2. Conservation (an index based on the motivation eas per unit area. Environmental diversity (ED) as a
to protect or enhance threatened species) surrogate measure of the conservation value was pro-
posed by Faith and Walker (1996), but so far there are
For assessing the value of a given habitat, e.g. no empirical data to test their proposal.
an ecological compensation area, for species con-
servation, the entity to indicate is the accumulated 7.3. An index for the motivation “pest control”
conservation values (e.g. red list status) of all species
present in that area. The highest values are contributed For the biodiversity aspect of biological control of
by species of national or even global importance, potential pest organisms, the first step may be to de-
while the so-called ubiquists are of little value. The fine the measurable entity as the species diversity of
second step thus is a comprehensive measurement of all predators or parasites of potential pest organisms.
the conservation values in a number of ecosystems or For short-term interests, the number of individuals of
habitat types. beneficial organisms may appear more important than
The third step would be to find and test the best species richness, because prey and hosts are reduced
linear correlate to that otherwise elusive entity “con- by the number of antagonistic individuals rather than
servation value”. The standard indicators for the by species numbers (Kromp et al., 1995; Wratten
conservation basket are numbers of red list species of and Van Emden, 1995). However, with a longer-term
selected taxa, weighed according to their category of perspective on maintaining a high diversity of antag-
threat. However, only very few of the tens of thou- onist species of potential pest organisms is certainly
sands of species present in a country are listed; in more important. While the species richness of preda-
Switzerland they are a mere 7% of all known animal tors in a small area can be assessed with reasonable
9. P. Duelli, M.K. Obrist / Agriculture, Ecosystems and Environment 98 (2003) 87–98 95
accuracy and effort, the diversities of parasitoids are et al., 1996; Balmford et al., 1996; Cranston and
much harder to quantify. Trueman, 1997; Duelli and Obrist, 1998).
The second step is therefore to test inventory meth-
ods, and selected taxa for their correlation with the
above biodiversity aspect of biological control. At 8. Effort and costs, the limiting factors for the
present species numbers of carabid and staphylinid choice of measures
beetles, as well as spiders, are often used as indica-
tors because of established standardised collecting 8.1. The dilemma of indicating complexity with
methods (Duffey, 1974; Desender and Pollet, 1988; simple measures
Halsall and Wratten, 1988) and readily available keys
for identification and interpretation. Specialised aphi- Large environmental monitoring programmes usu-
dophaga among the syrphid flies, coccinellids and ally avoid using invertebrates for their indicators,
Neuroptera are another option, but so far the meth- although these constitute by far the largest portion of
ods are not fully standardised. Parasitoid wasps and measurable biodiversity. To cut down on effort and
flies are promising, but so far there is no easy way to costs, measurement of the immense richness and quan-
identify them to the species level. Other possibilities tity of invertebrates has to be reduced to an optimised
for indicators to test are ratios between herbivores selection of taxa. The proposed three-step approach
and predators, or parasitoids and a range of other allows for testing all kinds of indicators for their cor-
arthropods (see e.g. Denys and Tscharntke, 2002). relation with aspects of biodiversity. The search for
linear correlates of quantified entities or aspects of
7.4. An index for ecological resilience biodiversity is not limited to taxonomic units. Instead
of choosing birds or grasshoppers as indicators, the
For the basket of indicators for the motivation eco- spectrum of taxa considered can be determined by an
logical resilience (“Balance of Nature”, Pimm, 1991), inventory method such as Berlese soil samples or flight
the entire genetic and taxonomic spectrum of biodi- interception traps. The broader the taxonomic spec-
versity is the entity to be indicated. The assumption is trum of the samples, the higher the chance of obtain-
that the higher the number of alleles and species, the ing a good correlation with the entity to be assessed.
higher is the ecological potential of an ecosystem to Furthermore, indicators, which are not part of the or-
react adequately to environmental change. ganismic spectrum, can also be tested in the three-step
Here again, a first step requires quantification of approach: habitat diversity and heterogeneity, distur-
a measurable proportion of local organismic diver- bance by traffic, neighbourhood or percentage of pro-
sity, which can be trusted to represent total species tected areas, etc. At present, various indicators are in
richness of animals and plants (alpha-diversity). Re- use, but few of them have been tested for their correla-
alistically, only few and small areas will ever be tion with aspects of biodiversity. At least in Neotropi-
fully assessed. For the second and third steps, ap- cal butterflies, a positive correlation of species richness
proximations with large, measurable proportions was found with composite environmental indices of
of alpha-diversity have to be used to test potential heterogeneity and natural disturbance (Brown, 1997).
indicators.
These “ecological” indicators can be seen as indica- 8.2. Plots and transects
tors for ecosystem functioning (Schläpfer et al., 1999)
and are representing a very basic notion of wholesale Plots (for plants) and transects (for birds and in-
biodiversity. Most studies claiming to measure or in- sects such as butterflies, dragonflies and grasshoppers)
dicate biodiversity assume that the group of organisms are widely used relative assessment methods for the
they investigate is somehow representative of biodi- species richness of a selected group of organisms (e.g.
versity. However, in only very few cases has the cor- Pollard and Yates, 1993; Wagner et al., 2000). The
relation between a group or several groups of species main advantages are that the specimens survive the in-
with a more or less representative sample of all organ- ventory (important for indicating conservation value),
isms been measured and published (Abensperg-Traun and that large areas can be searched in a relatively
10. 96 P. Duelli, M.K. Obrist / Agriculture, Ecosystems and Environment 98 (2003) 87–98
short time. Scientifically, the drawback is that usually 9. Conclusions
there are no voucher specimens kept for verifying the
identification. Also, these popular groups (except for There is no single indicator for biodiversity. The
vascular plants) have only few species in agricultural choice of indicators depends on the aspect or entity of
habitats, so their species richness, even if cumulated, biodiversity to be evaluated and is guided by a value
never reaches 1% of the local species diversity of all system based on personal and/or professional moti-
organisms. Their correlation power with local species vation. Each biodiversity index for a particular value
diversity has never been tested. Vascular plants, on system should consist of a basket of methods with one
the other hand, seem to correlate reasonably well with or several concordant indicators. In order to achieve
overall organismic diversity (Duelli and Obrist, 1998). greater reliability and a broader acceptance, indicators
Plots and transects are low budget measures and worth have to be tested for their linear correlation with a sub-
testing for their correlation power in the conservation stantial and quantifiable portion of the entity to assess.
and ecology baskets of indicators. The challenge now is to assign all the presently used or
proposed indicators to a basket with a declared value
8.3. Standardised trapping methods for arthropods system—and to test them with empirical measures.
Pitfall traps for surface dwelling arthropods and var-
ious kinds of flight traps for insects are often used References
for biodiversity assessment in agricultural areas. Ei-
ther one or a few taxonomic groups are collected over Abensperg-Traun, M., Arnold, G.W., Steven, D.E., Smith, G.T.,
Atkins, L., Viveen, J.J., Gutter, M., 1996. Biodiversity indicators
longer periods, or a larger number of taxa are sampled in semiarid, agricultural Western Australia. Pacific Conserv.
within a shorter collecting period. In both cases, suit- Biol. 2, 375–389.
able correlates have been found for the indicator bas- Balmford, A., Green, M.J.B., Murray, M.G., 1996. Using
ket of ecological resilience (Duelli and Obrist, 1998). higher-taxon richness as a surrogate for species richness. I.
Bugs (Heteroptera), and wild bees and wasps (ac- Regional tests. Proc. R. Soc. Lond. B 263, 1267–1274.
Brown, K.S., 1997. Diversity, disturbance and sustainable use
uleate Hymenoptera; see also Fig. 6) collected during of Neotropical forests: insects as indicators for conservation
an entire vegetation period, where highly correlated monitoring. J. Insect Conserv. 1, 25–42.
with overall species richness, while carabids and spi- Claridge, M.F., Dawah, H.A., Wilson, M.R. (Eds.), 1997. Species:
ders in pitfall traps were not. Reducing the collecting The Units of Biodiversity. Chapman & Hall, London.
time to five carefully selected weeks, but extending Cohen, S., Burgiel, S.W. (Eds.), 1997. Exploring Biodiversity
Indicators and Targets under the Convention on Biological
the spectrum of identified taxa (Duelli et al., 1999), Diversity. BIONET and IUCN, Washington, DC and Gland.
yielded correlation values comparable to those of sea- Colwell, R.K., Coddington, J.A., 1994. Estimating terrestrial
sonal collections of bugs or bees. Tests are under way biodiversity through extrapolation. Phil. Trans. R. Soc. Lond.
to further reduce the effort required for collecting and B 345, 101–118.
identifying through an adaptation of the Australian Cranston, P.S., Hillman, T., 1992. Rapid assessment of biodiversity
using biological diversity technicians. Aust. Biol. 5, 144–154.
method of Rapid Biodiversity Assessment (Cranston Cranston, P.S., Trueman, J.W.H., 1997. Indicator taxa in
and Hillman, 1992; Oliver and Beattie, 1996). With invertebrate biodiversity assessment. Mem. Mus. Victoria 56,
that method, the whole taxonomic spectrum collected 267–274.
within a few selected weeks in a standardised trap Denys, C., Tscharntke, T., 2002. Plant–insect communities and
combination is considered, but only at the level of predator–prey ratios in field margin strips, adjacent crop fields,
and fallows. Oecologia 130, 315–324.
morphospecies, i.e. without identifying the catches Desender, K., Pollet, M., 1988. Sampling pasture carabids with
to the species level (Duelli et al., unpubl.). Obvi- pitfalls: evaluation of species richness and precision. Med. Fac.
ously, the resulting indicator will not be useful for Landbouww. Rijksuniv. Gent 53, 1109–1117.
the indicator baskets of conservation or pest control, Duelli, P., 1994. Rote Listen der gefährdeten Tierarten der Schweiz.
where identification of the species is essential. How- Bundesamt für Umwelt Wald und Landschaft. BUWAL-Reihe
Rote Listen. EDMZ, Bern.
ever, it is a promising monitoring device for the indi- Duelli, P., Obrist, M.K., 1998. In search of the best correlates
cation of alpha-diversity—or the ecological resilience for local organismal biodiversity in cultivated areas. Biodivers.
basket. Conserv. 7, 297–309.
11. P. Duelli, M.K. Obrist / Agriculture, Ecosystems and Environment 98 (2003) 87–98 97
Duelli, P., Obrist, M.K., Schmatz, D.R., 1999. Biodiversity Austria). In: Toft, S., Riedel, W. (Eds.), Arthropod Natural
evaluation in agricultural landscapes: above-ground insects. Enemies in Arable Land, vol. 70. Acta Jutlandica, Aarhus
Agric. Ecosyst. Environ. 74, 33–64. University Press, Denmark, Aarhus, Denmark, pp. 87–100.
Duffey, E., 1974. Comparative sampling methods for grassland Lindenmayer, D.B., 1999. Future directions for biodiversity
spiders. Bull. Br. Arach. Soc. 3, 34–37. conservation in managed forests: indicator species, impact
Dufrene, M., Legendre, P., 1997. Species assemblages and indicator studies and monitoring programs. For. Ecol. Manage. 115, 277–
species: the need for a flexible asymmetrical approach. Ecol. 287.
Monogr. 67, 345–366. Magurran, A.E., 1988. Ecological Diversity and its Measurement.
European Community, 1997. Agenda 2000, vol. L, For a Stronger Croom Helm Limited, London.
and Wider EU. Office for Official Publications of the European McGeoch, M.A., 1998. The selection, testing and application of
Communities, Luxembourg. terrestrial insects as bioindicators. Biol. Rev. 73, 181–201.
Faith, D.P., Walker, P.A., 1996. Environmental diversity: on the Meffe, G.K., Carroll, C.R., 1994. Principles of Conservation
best-possible use of surrogate data for assessing the relative Biology. Sinauer, Sunderland.
biodiversity of sets of areas. Biodivers. Conserv. 5, 399–415. Moser, D., Zechmeister, H.G., Plutzar, C., Sauberer, N., Wrbka, T.,
Flückiger, P.F., 1999. Der Beitrag von Waldrandstrukturen Grabherr, G., 2002. Landscape patch shape complexity as an
zur regionalen Biodiversität. Doctoral Thesis. Philosophisch- effective measure for plant species richness in rural landscapes.
Naturwissenschaftliche Fakultät, Universität Basel, Basel. Landscape Ecol. 17, 657–669.
Foster, G.N., Blake, S., Downie, I.S., McCracken, D.I., Ribera, Mossakowski, D., Paje, F., 1985. Ein Bewertungsverfahren von
I., Eyere, M.D., Garside, A., 1997. Biodiversity in Agriculture. Raumeinheiten an Hand der Carabidenbestände. Verh. Ges.
Beetles in Adversity? BCPC Symposium Proceedings No. 69: Ökol. Bremen 13, 747–750.
Biodiversity and Conservation in Agriculture, pp. 53–63. Niemelä, J., 2000. Biodiversity monitoring for decision-making.
Gaston, K.J. (Ed.), 1996a. Biodiversity: A Biology of Numbers Ann. Zool. Fenn. 37, 307–317.
and Difference. Blackwell Scientific Publications, London. Noss, R.F., 1990. Indicators for monitoring biodiversity: a
Gaston, K.J. (Ed.), 1996b. Species Richness: Measure and hierarchical approach. Conserv. Biol. 4, 355–364.
Measurement. Biodiversity: A Biology of Numbers and Noss, R.F., 1999. Assessing and monitoring forest biodiversity: a
Difference. Blackwell Scientific Publications, London. suggested framework and indicators. For. Ecol. Manage. 115,
Gaston, K.J. (Ed.), 1996c. What is Biodiversity? Biodiversity: 135–146.
A Biology of Numbers and Difference. Blackwell Scientific Oliver, I., Beattie, A.J., 1996. Invertebrate morphospecies as
Publications, London. surrogates for species: a case study. Conserv. Biol. 10, 99–109.
Gaston, K.J., Williams, P.H., 1993. Mapping the world’s species— Ovenden, G.N., Swash, A.R.H., Smallshire, D., 1998. Agri-
the higher taxon approach. Biodiv. Lett. 1. environment schemes and their contribution to the conservation
Greenslade, P., 1997. Are Collembola useful as indicators of the of biodiversity in England. J. Appl. Ecol. 35, 955–960.
conservation value of native grassland? Pedobiologia 41, 215– Pimm, S.L., 1991. The balance of nature? Ecological Issues in
220. the Conservation of Species and Communities. University of
Halsall, N.B., Wratten, S.D., 1988. The efficiency of pitfall trapping Chicago Press, Chicago.
for polyphagous predatory Carabidae. Ecol. Entomol. 13, 293– Pollard, E., Yates, T.J., 1993. Monitoring Butterflies for Ecology
299. and Conservation. Chapman & Hall, London.
Harte, J., Kinzig, A., 1997. On the implications of species–area Prendergast, J.R., 1997. Species richness covariance in higher taxa:
relationships for endemism, spatial turnover, and food web empirical tests of the biodiversity indicator concept. Ecography
patterns. Oikos 80, 417–427. 20, 210–216.
Hellawell, J.M., 1986. Biological Indicators of Freshwater Prendergast, J.R., Quinn, R.M., Lawton, J.H., Eversham, B.C.,
Pollution and Environmental Management. Elsevier, London. Gibbons, D.W., 1993. Rare species, the coincidence of diversity
IUCN, 1994. IUCN Red List Categories. Prepared by IUCN hotspots and conservation strategies. Nature 365, 335–337.
Species Survival Commission. IUCN, Gland. Reid, W.V., McNeely, J.A., Tunstall, D.B., Bryant, D.A., Winograd,
Johnson, S.P., 1993. The Earth Summit: The United Nations M., 1993. Biodiversity Indicators for Policy-makers. WRI and
Conference on Environment and Development (UNCED). IUCN, Washington, DC and Gland.
Graham and Trotman, London. Rykken, J.J., Capen, D.E., Mahabir, S.P., 1997. Ground beetles
Kaennel, M., 1998. Biodiversity: a diversity in definition. In: as indicators of land type diversity in the Green Mountains of
Bachmann, P., Köhl, M., Päivinen, R. (Eds.), Assessment of Vermont. Conserv. Biol. 11, 522–530.
Biodiversity for Improved Forest Planning. Kluwer Academic Schläpfer, F., Schmid, B., Seidl, I., 1999. Expert estimates about
Publishers, Dordrecht. effects of biodiversity on ecosystem processes and services.
Kleijn, D., Berendse, F., Smit, R., Gilissen, N., 2001. Agri- Oikos 84, 346–352.
environment schemes do not effectively protect biodiversity in Spellerberg, I.F., 1991. Monitor Ecological Change. Cambridge
Dutch agricultural landscapes. Nature 413, 723–725. University Press, Cambridge.
Kromp, B., Pflügel, G., Hradetzky, R.I.J., 1995. Estimating Vane-Wright, R.I., Humphries, C.J., Williams, P.H., 1991. What to
beneficial arthropod densities using emergence traps, pitfall protect?—systematics and the agony of choice. Biol. Conserv.
traps and the flooding method in organic fields (Vienna, 55, 235–254.
12. 98 P. Duelli, M.K. Obrist / Agriculture, Ecosystems and Environment 98 (2003) 87–98
Wagner, H.H., Wildi, O., Ewald, K.C., 2000. Additive partitioning Wratten, S.D., Van Emden, H.F., 1995. Habitat management for
of plant species diversity in an agricultural mosaic landscape. enhanced activity of natural enemies of insect pests. In: Glen,
Landscape Ecol. 15, 219–227. D.M., Greaves, M.P., Anderson, H.M. (Eds.), Ecology and
Wascher, D.W., 2000. Agri-environmental indicators for Integrated Farming Systems. Wiley, Bristol.
sustainable agriculture in Europe. ECNC Technical Report
Series, Tilburg.