Hazardmon.com - Cloud-based hazard monitoring system - White Paper

View your Plant in Real Time on any Web-Enabled Device. HazardMon.com® is a secure cloud based hazard monitoring solution providing status notifications and data logging for bucket elevators and conveyors. Live system status, graphs and historical data can be viewed on any web-enabled device (smartphone, tablet PC, desktop or laptop computer). Emails can be sent to notify users whenever a change in the system's health is detected. An automated maintenance feature allows site operators to verify that all sensors on the system are operational and working correctly. Hazardmon.com works in conjunction with 4B's T500 Elite Hotbus™ control system for bucket elevators and conveyors. This multi-function system is specially designed to monitor equipment for belt misalignment, belt speed, continuous bearing temperature, pulley alignment, level and plug conditions. With automatic machine shutdown capability and PLC / PC compatibility, the T500 Elite Hotbus™ offers low cost installation, versatility and easy system expansion for any plant size.

Recommandé
Recommandé
Contenu connexe
En vedette
En vedette (13)
Plus de 4B Braime Components
Plus de 4B Braime Components (20)
Hazardmon.com - Cloud-based hazard monitoring system - White Paper
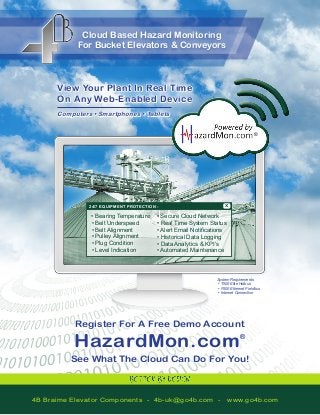
- 1. Cloud Based Hazard Monitoring For Bucket Elevators & Conveyors • Secure Cloud Network • Real Time System Status • Alert Email Notifications • Historical Data Logging • Data Analytics & KPI’s • Automated Maintenance • Bearing Temperature • Belt Underspeed • Belt Alignment • Pulley Alignment • Plug Condition • Level Indication 24/7 EQUIPMENT PROTECTION - X View Your Plant In Real Time On Any Web-Enabled Device Computers • Smartphones • Tablets System Requirements • T500 Elite Hotbus • F500 Ethernet Fieldbus • Internet Connection Register For A Free Demo Account HazardMon.com® See What The Cloud Can Do For You! ® 4B Braime Elevator Components - 4b-uk@go4b.com - www.go4b.com
- 2. Introduction It is well known that transporting certain dry dusty materials can create explosive atmospheres. Five conditions, known as the “Dust Explosion Pentagon”, have to exist in order for the explosive state to occur. First, there needs to be a high concentration of dust (fuel), followed by an ignition source (heat) and oxygen (oxidizer). If all of these appear in a confined space with dispersion, an explosion can occur. The most common ignition sources have long been identified as over-heated bearings, misaligned belts and belts that are slipping. The industry is saturated with various sensors and controllers that monitor these conditions to prevent explosions. Regardless how well these systems work there is one problem with all of them - human error. With the ever growing demands on site performance and efficiency at terminals and processing facilities, decisions to bypass safety equipment has become an ever increasing issue. With mounting pressures, site personnel may risk keeping a machine in operation even after an alarm has been detected, putting the plant and all personnel at risk. Without backend reporting systems and data logging, this dangerous practice can go on undetected by upper management. In order to combat this issue, 4B Components has developed a solution that will revolutionize the industry by introducing a greater level of transparency and record keeping. HazardMon. com is a secure cloud based industrial monitoring solution that allows any registered user to login and see all their facilities in real-time from anywhere in the world. This product offers seamless integration with 4B’s T500 Elite Hotbus™ hazard monitoring system. PAGE 2 Dust Explosion Pentagon Ignition Source (Heat) Confinement of the Dust Cloud Dispersion of Dust Particles Combustible Dust (Fuel) Oxygen in Air (Oxidizer) Figure 1 - Dust Explosion Pentagon
- 3. PAGE 3 HazardMon.com Features • Secure login and data transfer with standard 256-bit (SSL) encryption, or an optional virtual private network (VPN) connection can also be created. • No server or PLC is required, so there is no additional hardware to replace or backup, which also eliminates upkeep and upgrade costs. • Data is sent directly to 4B’s cloud server, and automatically backed up in multiple off- site locations making the data extremely safe and secure. This allows data to be easily recovered and analyzed in the case of an on-site event, such as an explosion. • Live system dashboard, historical data and customisable graphs can be viewed on any web enable device (smartphone, tablet PC, desktop or laptop computer). • Email alert notifications can be sent to notify specific users whenever a change in the system’s health is detected. • New features are constantly being developed to improve the end user experience, and with HazardMon.com’s cloud based technology, your facility will always be at the leading edge of technology. Figure 2 - HazardMon.com Running on Different Devices Live System Dashboard With HazardMon.com it is possible to view multiple sites from one system dashboard page (figure 3). This unique feature varies from other systems where you have to login into each site individually and view them one by one. HazardMon.com also indicates all active alarms from all facilities in one place as soon as you log in, allowing managers to see any problems in a matter of seconds. All sensor data can be viewed in real-time using any standard web browser such as Mozilla Firefox, Google Chrome or Internet Explorer (figure 4). The website is completely dynamic and the sensor status and value are updated automatically without the need to refresh the webpage. The website was designed to dynamically resize as the screen resolution changes and it is optimized for tablet and mobile phone platforms.
- 4. PAGE 4 Figure 3 - HazardMon.com System Dashboard Figure 4 - HazardMon.com Live System View
- 5. PAGE 5 Historical Data Analysis All data can be viewed as graphs. A unique drag-and-drop feature allows you to pick specific sensors of interest and compare them side-by-side in one graphical view (figure 5). Time windows can be selected, ranging from 1 hour up to 30 days. The graphs are interactive, allowing you to use your cursor to mouse over any event to show specific values and sensor statuses. All alarms are stored in a separate alarm log (figures 6 and 7). Using the website filtering options, it is very easy to generate a report and download it into a standard spreadsheet program. All the alarms are grouped into different alarm types, like “Alarm Detected”, “Alarm Cleared”, “Device Power Up”, etc. This allows information to be extracted in a few clicks and create a report in seconds. Figure 5 - HazardMon.com Graphing: Two Bearings Shown, One is in Alarm
- 6. PAGE 6 Figure 6 - HazardMon.com Alarm Log Filtered Figure 7 - HazardMon.com Alarm Log Unfiltered Email and Text (SMS) Notifications Engine A very flexible notification system allows any user to receive email or text message notifications. Notification can be sent when sensors go in and out of alarm; when the internet connection between the T500 Hotbus system and the server is lost or when an alarm has not been cleared for a number of minutes. It is also possible to receive notifications only when an alarm has not been cleared for a specified number of minutes.
- 7. PAGE 7 Report Generation Tool An advanced analytics tool allows reports to be generated that summarize the safety and efficiency of the factory. Currently it is possible to see which sensors caused the majority of alarms, which hours of the day had most alarms and the types of alarms. The start and end dates of reports can easily be altered and the report re-generated. Reports can be saved to the user’s PC in a single click. Figure 8 - HazardMon.com Types of Alarms Report Figure 9 - HazardMon.com Number of Detected Alarms
- 8. PAGE 8 Automated Maintenance and Testing Functionality It is important to periodically check that your monitoring system will detect an alarm when a dangerous condition occurs. The current standard in the industry is for technicians to walk around the site and manually test each sensor. A paper report is then generated and in some cases, converted into a digital format (Microsoft Excel for example). There is still absolutely no guarantee that the technician actually performed any of the testing. HazardMon’s sensor testing function ensures that test procedures are carried out, logged, and reported within the system. This feature provides managers documented evidence that each sensor has been tested to ensure it is working correctly. To initiate a system test, a user would go to the “Maintenance” tab within HazardMon. com and choose a sensor to test. During testing, HazardMon temporarily stops alarm notifications for this sensor, so that no nuisance alarm notifications are sent out. The user has 5 minutes to trigger an alarm and confirm the sensor is in proper working condition or needs to be replaced. The whole process is logged automatically, and a maintenance report can be generated after testing has been completed. Figure 10 - HazardMon.com Maintenance Feature
- 9. PAGE 9 Conclusion As more and more facilities install monitoring systems to ensure the site’s safety, the main safety concerns, human error and the lack of transparency still exist. HazardMon.com combined with 4B’s hazard monitoring systems gives management real time access to all critical monitoring data. This dramatically increases transparency, cuts down on human error and helps to verify that company safety policies are being adhered to. HazardMon.com was launched during the 2013 GEAPS Exchange in Louisville KY, USA. The product generated much excitement from industry leaders and plant managers as they could see how HazardMon.com would give them 24/7 monitoring data, making their plants safer and more reliable. To see all of the features available, sign up for a FREE demo account at www.hazardmon.com and see what the cloud can do you! ®
- 10. www.go4b.com 4B BRAIME ELEVATOR COMPONENTS Hunslet Road Leeds LS10 1JZ UK Tel: +44 (0) 113 246 1800 Fax: +44 (0) 113 243 5021 4B SETEM SARL 9 Route de Corbie 80800 Lamotte Warfusee France Tel: +33 (0) 3 22 42 32 26 Fax: +33 (0) 3 22 42 37 33 4B DEUTSCHLAND 9 Route de Corbie Lamotte Warfusee F-8080 France Tel: +49 (0) 700 2242 4091 Fax: +49 (0) 700 2242 3733 4B AFRICA PO Box 1489 Jukskei Park 2153 Johannesburg South Africa Tel: +27 (0) 11 708 6114 Fax: +27 (0) 11 708 1654 4B ASIA PACIFIC Build No.899/1 Moo 20, Soi Chongsiri, Bangplee-Tam Ru Road, Tanbon Bangpleeyai, Amphur Bangplee, Samutprakarn 10540 Thailand Tel: +66 (0) 2 173-4339 Fax: +66 (0) 2 173-4338 4B AUSTRALIA Unit 1-18 Overlord Place Acacia Ridge Queensland 4110 Australia Tel: +61 (0) 7 3711 2565 Fax: +61 (0) 7 3711 2574 4B COMPONENTS LTD. 625 Erie Ave. Morton, IL 61550 USA Tel: 309-698-5611 Fax: 309-698-5615 With subsidiaries in North America, Europe, Asia, Africa and Australia along with a worldwide network of distributors, 4B can provide practical solutions for all your applications no matter the location. 4B participates in GEAPS programs, see us at the next GEAPS Exchange Grain Elevator and Processing Society 4B is proud to be a member of the following organizations: Grain & Feed Association of Illinois Member ® NGFA NFPA ® MEMBER AFIA AMERICAN FEED INDUSTRY ASSOCIATION 4B® and HazardMon.com® are registered trademarks of 4B Components Ltd., a subsidiary of T.F. & J.H. BRAIME (HOLDINGS) P.L.C. Copyright 2014 © 4B Components Ltd. All rights reserved. Brochure information subject to change or correction. CRD010114