Analysis of food crop output volatility in agricultural policy programme regimes in nigeria
•
1 j'aime•609 vues


Recommandé
Recommandé
Contenu connexe
Tendances
Tendances (19)
Similaire à Analysis of food crop output volatility in agricultural policy programme regimes in nigeria
Similaire à Analysis of food crop output volatility in agricultural policy programme regimes in nigeria (20)
Plus de Alexander Decker
Plus de Alexander Decker (20)
Dernier
Dernier (20)
Analysis of food crop output volatility in agricultural policy programme regimes in nigeria
- 1. Developing Country Studies www.iiste.org ISSN 2224-607X (Paper) ISSN 2225-0565 (Online) Vol 2, No.1, 2012 Analysis of Food Crop Output Volatility in Agricultural Policy Programme Regimes in Nigeria Sunday Brownson Akpan Department of Agricultural Economics, Michael Okpara University of Agriculture, Umudike, Abia State, Nigeria. *Corresponding author: E-mail: sundayakpan10@yahoo.com Abstract The study analyzed food crop output volatility in different agricultural policy programme periods in Nigeria. Data from FAO and publications of Central Bank of Nigeria covering the period 1961 to 2009 was used in the study. Unit root test was conducted on the specified time series. The GARCH (1,1) model was used to generate the food crop output volatility. A combination of descriptive analysis and analysis of variance model (ANOVA) based on OLS estimation technique was used to analyze data. The results revealed that Pre-Operation Feed the Nation period (1961-1976) and Structural Adjustment Programme (1986-1993) period were the most volatile sub periods for most food crop outputs in the country. Whereas, food crop outputs were most stable during the Operation Feed the Nation period (1976-1979) and Green Revolution period (1980-1985). Also, the mean food crop outputs showed a progressive growth rate across the policy programme periods since 1961, and were best during Post Structural Adjustment period (1994-2009). The result of the ANOVA prove the fact that the agricultural policy programmes actually influenced key food crop outputs and their volatilities; but these influences were mixed and inconsistence across food crop enterprises and policy regimes in the country. Following the results of the study, we recommend that government should formulate appropriate specific food crop policy packages as part of the holistic agricultural policy programme. This kind of policy programme would ensure quick intervention and promote result oriented food crop policy programme in the country. Keywords: Food, Crop, Volatility, GARCH, Policy, Agriculture 1. Introduction In spite of the predominance of the petroleum sub sector in Nigeria’s economic development; agriculture still remains a major source of economic resilience (Ojo and Akanji, 1996). Agricultural sector in Nigeria is a major contributor to employment generation, poverty reduction, foreign exchange earnings and source of industrial resources (CBN, 2002). In 2001, agricultural sector contributed about 41 per cent to the country’s GDP. Despite this fit, the output of the sector had experience mounting deficits; food supply is outpaced by demand; agricultural land intensification has increase due to increasing urbanization and population pressure; and production per capita has been on the decline in most years since independence (FMA, 1984). Agricultural policy programme inconsistency had been identifies as one of the major causes of the decline in agricultural production in the country (Ukoha, 2007). In Nigeria, agricultural related policy programmes were initiated and implemented following the declining roles of agriculture to economic growth and development in the country. Some of the policy programmes instituted with an intention to stimulate agricultural development in Nigeria include; The Agricultural Development Project (ADP) conceptualized in 1975 and mandated to provide decentralized opportunities and resources in agriculture to small holder farmers; Operation Feed the Nation (OFN) set up in 1976 to provide sufficient food for all Nigerian; Green Revolution (GR) implemented in 1980 was meant to encourage the production of sufficient food and improved nutrition to all Nigerians; and Nigerian Agricultural Cooperative and Rural Development found in 2000 was to provide credit for production, processing and marketing of agricultural products among others (Udoh and Akpan 2007; Ukoha 2007; Akpan and Udoh 2009a; Akpan and Udoh, 2009b). Despite many attempts to upsurge domestic food crop production through agricultural policy programmes formulation and implementation by the federal government; Nigeria is still a net importer of many food commodities especially the grains (CBN, 2010). Also it is observed that several agricultural policy programme periods in the country accompany food crop output variability (CBN, 2010). For example, yam output volatility decreased from 35.6% in the period 1971– 1976, fluctuating over the years to 23.90% in 1980–1985, and then increased to 43.20% in 1986–1989 (Garba, 2000). Agénor et al., (2000) relates output volatility to policy inconsistency in many developing countries. Essang (1973) and Muroi (1989) also correlate food crop output 28
- 2. Developing Country Studies www.iiste.org ISSN 2224-607X (Paper) ISSN 2225-0565 (Online) Vol 2, No.1, 2012 volatility in Nigeria to poor policy on technology and land use Acts. Surprisingly, the direct impact of agricultural policies on food crop output volatility in Nigeria has receive limited attention in the empirical literature; in spite that increase output was among the primary goals of most past and present agricultural policy programmes (Ukoha 2007; Udoh and Akpan 2007, and Akpan and Udoh, 2009a and Akpan and Udoh, 2009b). The knowledge of output volatility relative to any agricultural policy programme under quasi market – oriented economy like Nigeria is imperative to agricultural policy makers and farmers especially on the pattern of decision making. Increase positive crop volatility could be an indication of the stimulating effect of the existing agricultural policy programme. But others argue that increase crop output volatility could increase farmers’ income risks and uncertainties due to anticipating price volatility (Young and Shields 1996, Ukoha 2007). Following the important of output volatility and the huge capital requirement needed to implement agricultural policy in the developing economy like Nigeria, there is need to identify the behavioral pattern of output and output volatility in each of the key agricultural policy programme in the country. Hence the study specifically analyses the output volatility of food crop in five key agricultural policy programme periods in Nigeria. Recommendations were also made that will stimulates the production of individual food crop in the current agricultural policy period in the country. 1.1 Measuring Food Crop Output Volatility The GARCH model of the form GARCH (ρ,q)t for which p, q = 1 was specified and used to generate volatility for the food crop outputs in Nigeria. It was found that simple GARCH (1,1) process as specify in equation (2) provided a good approximation of the data generating process for Sorghum, Cassava, Melon, Beans and Rice as well as Yam enterprises. However, Taylor and Schwert’s GARCH (1,1) as specify in equation (3) was appropriate for Maize, Millet and Okra enterprises. The annual food crop output was assumed to follow a primitive first-order autoregressive (AR) (1) process as follows, ∆ ∆ …………………………..…………….. 1 ~ 0,1 . Where (Yt) is the output of food crops (Yam, Cassava, Maize, Millet, Melon, Okra, Beans, Rice and Sorghum) and υ is the stochastic disturbance term. The general assumption is that disturbances from Equation (1) are not auto correlated. Therefore, equation 1 is the mean equation from which the GARCH process was derived as shown in equations (2) and (3). ! ∑ #$ %∑ ………………………………………..…………….. 2 Volt = ! ∑/# $ / % ∑ ………………………………………..……….…….. 3 Equation 2 shows that the conditional variance of the error term in equation 1 which is a proxy of output volatility (Volt) at period ‘t’ is explained by the past shocks or square of error term (ARCH term i.e. εt-1 as describe in equation (1) and past variance or volatility term (the GARCH term i.e.һt-1). For equation (2) and (3) to be stationary, δ > 0, α ≥ 0, β ≥ 0 and the persistent of volatility shocks (α +β) should be less than 1. As the sum of α and β becomes close to unity, shocks become much more persistent (Bollerslev, 1986). The inclusion of lagged conditional variances captures some sort of adaptive learning mechanism (Bollerslev 1986, Crain and Lee 1996 and Yang et al., 2001). The estimates of equation (2) and (3) were used to test the persistence of volatility in the selected food crop in the study period. 2.0 Methodology 2.1 Study area and data source: The study was conducted in Nigeria; the country is situated on the Gulf of Guinea in the sub Saharan Africa. Data used in the study were from FAO crop production database for Nigeria and publications of the Central Bank of Nigeria (CBN). The data covered the period 1961 to 2009. 2.2 Analytical Techniques To investigate the influence of agricultural policy programme regimes on food crop output volatility in Nigeria, we employ a combination of analytical tools including descriptive statistics and analysis of variance (ANOVA) model involving dummies (Gujarati, 2004). The gretl and PC-Give econometric softwares were used to analyze the data set. The ANOVA model was described as follows: Volt = δ0 + δ1(PREOFN)t + δ2(OFN)t +δ3Ln(GR)t + δ4(SAP)t +δ5(PSAP)t +Ut………………….….. (4) Where; 29
- 3. Developing Country Studies www.iiste.org ISSN 2224-607X (Paper) ISSN 2225-0565 (Online) Vol 2, No.1, 2012 Volt = food crop output volatility (sorghum, maize, rice, cassava, yam, millet, melon, okra and beans) PREOFNt = dummy variable which takes the value 1 during period of pre Operation Feed the Nation (1961-1975) and zero otherwise OFNt = dummy variable which takes the value 1 during period of Operation Feed the Nation (1976-1979) and zero otherwise GRt = dummy variable which takes the value 1 during period of Green Revolution (1980-1985) and zero otherwise SAPt = dummy variable which takes the value 1 during period of Structural Adjustment Programme (1986-1993) and zero otherwise PSAPt = dummy variable which takes the value 1 during period of Post Structural Adjustment Programme (1994-2009) and zero otherwise. Ut = stochastic error term and ? ~ 0, $ @ . Note: In order to avoid the dummy variable trap or the case of perfect collinearity among dummy variables specify in equation (4), we omitted the dummy variable PSAP during estimation of the equation for the respective crop enterprise. The PSAP dummy was used as a benchmark dummy from which the differential intercept slope coefficients were compared for each food crop equation. The choice of the PSAP era was based on the fact that, Nigeria’s agricultural sector is currently regulated by the PSAP agricultural policies; as such it is meaningful to compare the deviation impact of other policy periods from the PSAP as regards to food crop output volatility. 3.0 Results and Discussion The estimates of the GARCH models are presented in Table I. The time varying pattern of the output volatility was confirmed because at least one of the coefficients of the GARCH models was significant for all 9 food crop enterprises. The sum of α and β measures the persistence of food crop output volatility. In all 9 food crop enterprises the sum of α and β were close to but less than unity, thus implying the persistent volatility shocks on food crop output volatility in Nigeria. The GARCH parameters were significant at various levels of probability for the crop enterprises. Exception of rice and millet enterprises, the β coefficient was significant in cassava, sorghum, maize, melon, beans, and okra as well as yam enterprises. 3.1 Unit Root test for Variables used in the Analysis To ascertain the stationarity of the estimated food crop output volatility for each crop enterprise in the model, the standard Augmented Dickey–Fuller test for unit root was performed. Test statistic for each variable in level and first difference involving both trend and without trend equations are presented in Table II. The test result reveals that at levels, some variables used in the analysis were stationary and some were non-stationary. All variables were stationary at first difference. Since the regression model consist of only one quantitative variable, we therefore estimated equation (4) at the level of the specified dependent variable for each crop enterprise. 3.2 Descriptive Analysis of Food Crop Outputs and Output Coefficient of Variability in Various Agricultural Policy Programme periods in Nigeria Table III shows the computed mean output and the mean growth rate of output as well as the coefficient of variability of the 9 food crop outputs in various agricultural policy programme periods in Nigeria. In the PREOFN era (1961-1975), the result reveals that the outputs of most food crop had negative growth rates and high coefficient of variability. The output variability index of yam (33.8%), beans (34.7%), rice (37.2%) and melon (40.6%) were high, indicating that the outputs of these crops were relatively unstable during period of PREOFN in the country. However Cassava (10.8%) and Okra (11.9%) outputs witnessed minimal variability during PREOFN period. On the other hand, the growth rate of most food crops outputs during period of Operation Feed the Nation (OFN) (1976-1975) was negative. Only cassava and Okra outputs had positive growth rates. The production of beans (24.8%), maize (34.6%) and rice (46.9%) were filled with uncertainties manifested through increasing instability in their respective outputs. Cassava (5.02%) and okra (4.47%) enterprises had minimal variability in their output during OFN era in the country. 30
- 4. Developing Country Studies www.iiste.org ISSN 2224-607X (Paper) ISSN 2225-0565 (Online) Vol 2, No.1, 2012 Some food crop productions were boosted during Green Revolution period (1980-1985). For instance, outputs of sorghum, rice, maize, melon, millet and okra indicated positive growth rates. Contrary, cassava, yam and beans output growth rates deteriorated during this period. The output coefficient of variability of cassava (6.8%), rice (8.7%) and yam (6.2%) were relatively low, indicating that output of these food crops had less fluctuations during Green Revolution in Nigeria. During Structural Adjustment Programme (SAP) period (1986-1993), food crop production witnessed positive growth rate. Outputs of Yam (50.9%) and cassava (34.4%) were highly unstable during this period. However millet (9.9%) exhibited minimal instability compared to other food crop during this period. Also in the PSAP era (1994-2009) the outputs of sorghum, rice and millet had negative growth rates. The mean food crop output shows a general improvement compared to the previous policy regimes. Food crop output variability coefficients were double digits for all selected food crops. The overall result reveals that, the PREOFN and SAP sub periods were the most volatile sub periods for most food crop outputs in the country. On the other hand, food crop outputs were most stable during the OFN and GR sub periods. Also, the mean food crop outputs show a progressive improvement across the policy programme periods, and were best during PSAP period. Figure I and II show the graphical representation of selected food crop outputs and their respective GARCH (1, 1) volatility indices from 1961 to 2009. The result in figure 1 shows downward fluctuations in Rice and Maize enterprises especially during the SAP and PSAP period (1986-2009). There was a remarkable variability in output of Rice, Maize and Sorghum enterprises during pre-liberalization period (i.e. PREOFN, OFN and GR periods); whereas Yam and cassava enterprises exhibited minimal variability in output during pre-liberalization era in the country. On the other hand, Sorghum, Cassava and Yam enterprises show gradual decline in their output during pre-liberalization period. On average, volatility of Rice and Maize, sorghum and yam decreases during period of liberalization (i.e. SAP and SAP periods) and increases during period of pre-liberalization era. Figure II reveals that the output and output volatility of melon and millet during pre- liberalization policy period (PREOFN, OFN and GR periods) exhibited noticeable fluctuations. The fluctuations assume undulated patterns till 1985 when a new policy era was introduced in the country. The output of both crops witnessed a gradual upshot during liberalization period (SAP and PSAP periods). The output volatility of melon during liberalization period rather toke a declining shape from SAP period to early PSAP period. Millet output volatility assumes a rising trend during liberalization period. For beans and okra crops, their output volatility exhibited an average downward trend during pre-liberalization period. However both output and output volatility of okra and beans crop were upward trend in the period of liberalization. 3.3 Results from Analysis of Variance Model (ANOVA) for each Food Crop Enterprise Table IV presents the estimates of the ANOVA model for each food crop enterprise. The dependent variables were the food crop output volatility generated from the GARCH model for each crop enterprise. The diagnostic test (F-cal) and the information criteria for each food crop equation suggest the appropriateness of the Ordinary Least Squares technique and the significant of specify dummy variables in each food crop equation. In the analysis, the PSAP dummy was used as a benchmark or control variable from which all other differential intercept slope coefficients were compared. The value of the constant (δ0) in each food crop equation represents the mean output volatility of respective food crop enterprise in the PSAP policy period in the country. The coefficients of PREOFN, OFN, GR and SAP dummies in each of the equation represent the differential of the mean of output volatility in these policy periods from the benchmark dummy coefficient. The empirical results reveal that, statistically the mean output volatility of cassava during the period of PSAP was 1.352 and was statistically different from those from PREOFN, OFN, GR and SAP policy periods. The results implies that the cassava output volatility mean during PREOFN, OFN, GR and SAP periods was statistically and significantly lower than the mean in PSAP by 1.245, 1.347, 1.345 and 1.061units respectively. This result implies that the effect of each of aforemention policy period impact on cassava output volatility in the country differs significantly. For Sorghum enterprise, the mean output volatility in PREOFN and SAP periods was significantly different and lower than PSAP era. The result shows that the mean sorghum volatility in PREOFN and SAP periods was about 0.072 and 0.19 units statistically lower than 0.211units in PSAP period. However the mean sorghum volatility was statistically around the same during PSAP, OFN and GRA periods. The result implies that, the impact of PSAP, OFN and GRA on sorghum production in Nigeria was statistically similar but was statistically different during PSAP, PREOFN and SAP periods. Also the mean output volatility of rice in PSAP was statistically different from the mean volatility during PREOFN and OFN policy periods. The mean volatility was 31
- 5. Developing Country Studies www.iiste.org ISSN 2224-607X (Paper) ISSN 2225-0565 (Online) Vol 2, No.1, 2012 2.623units and 1.916units for PREOFN and OFN periods respectively compared to 0.633unit in PSAP periods. On the other hand, the rice output volatility during PSAP policy period was around the same in GR and SAP policy periods. The result means that the influence of PSAP, GR and SAP policy periods on rice output volatility was statistically similar, but holistically different from PREOFN and OFN policy periods. In addition, the output volatility of maize in PSAP period was not statistically significant. This implies that the volatility of maize in PSAP period was relatively low compared to other policy periods. The differential intercepts with respect to PREOFN, OFN and GR were positive and significant; meaning that volatility in these periods was statistically and significantly higher than PSAP period. The result denotes that agricultural policy during post structural Adjustment era (PSAP) did not cause significant fluctuation in output of maize in Nigeria. Furthermore, the yam output volatility was significantly different among the specify policy periods. The coefficient of PREOFN was 2.26units and was statistically less than 2.56uits in PSAP. Also, OFN, GR, and SAP policy period coefficients were 2.47units, 2.53units and 1.96units statistically lower respectively than 2.56units in PSAP policy period. The result reveals that each policy regime impacts on yam output volatility was significantly different. The mean volatility of melon was statistically significant and occurs around 0.26units in PSAP period. This was statistically different from the differential intercept coefficients with respect to PREOFN (0.529) and GR (0.099). This means that the impact of PSAP, PREOFN and GR policy periods on melon volatility was significantly different. On the other hand, the result reveals that volatility during PSAP was statistically similar to that of OFN and SAP policy periods. This implies that there were similarities in policy formulation and implementation as regards to increasing melon production in the country. For beans enterprise, the volatility during PREOFN, OFN, GR and SAP were statistically significant and lower by 1.027units, 0.963units, 1.248units and 1.095units respectively compared to 1.391 units in PSAP period. This result implies that each policy regime had a unique influence on beans output volatility in the country. The analysis further reveals that the mean output volatility for millet during PSAP significantly differs from SAP policy era. Hence, policy impact on millet production during PSAP and SAP periods differs significantly. Contrary, the millet output volatility during SAP was statistically similar with those from PREOFN, OFN and GR. Volatility in okra output in the country was statistically different during PSAP, PREOFN, OFN, GR and SAP policy periods. This means that the policy content of each of the specify policy period reacts differently on output volatility of okra. 4.0 SUMMARY AND RECOMMENDATIONS The study analyses food crop output volatility in different agricultural policy programme regimes in Nigeria. The major food crop consider were; cassava, sorghum, yam, rice, millet, beans, melon, okra and maize. Production data derive from FAO data base for Nigeria and publications of CBN covering the period 1961 to 2009 were used in the study. GARCH (1,1) model was used to generate output volatility for each food crop enterprise. Analysis of variance model (ANOVA) was employed to test the significance difference among means of food crop output volatility in each policy period in the country. Also descriptive analysis was used to estimate mean, growth rate and coefficient of variability of food crop output in each policy regime. The result of the descriptive analysis shows that the pre-OFN and SAP sub periods were the most volatile sub periods for most food crop outputs in the country. On the other hand, food crop outputs were most stable during the OFN and GR sub periods. In addition, the result of the ANOVA reveals that the mean food crop output volatility during PSAP period was significantly different from other policy periods for most food crop exception of maize. The result implies that the impact of the current agricultural policy (PSAP) on cassava, sorghum, rice, yam melon, beans, millet and okra crop output volatility in the country differs significantly from some previous agricultural policy regimes. Alternatively, the ANOVA model also reveals that the mean volatility of food crop during PSAP was similar to some agricultural policy programme periods. The result denotes that the impact of the current agricultural policy (PSAP) on some food crop output volatility in the country also shares some similarities with the previous policy programme. The result prove the fact that the agricultural policy programmes actually influenced key food crop outputs and their volatility; but these influences were mixed and inconsistence across food crop enterprises and policy regimes in the country. Following the results of the study, we recommend that government should formulate appropriate specific food crop policy packages as part of the holistic agricultural policy programme. This kind of policy programme would ensure quick intervention and promote result oriented food crop policy programme in the country. Also agricultural policy contents during PREOFN and SAP periods should be used as a basis for stimulating food crop output volatility in the country References [1] Agenor, P. R., C. J. McDermott, and E. S. Prasad. (2000): “Macroeconomic fluctuations in Developing 32
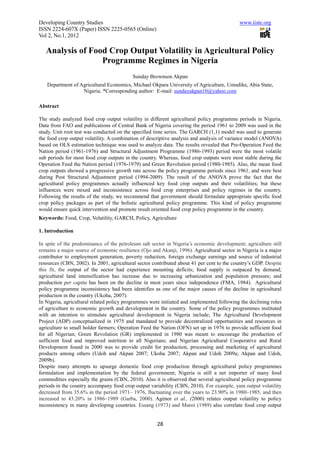
- 6. Developing Country Studies www.iiste.org ISSN 2224-607X (Paper) ISSN 2225-0565 (Online) Vol 2, No.1, 2012 countries: Some stylized facts,”World Bank Economic Review, 14(2), 251-285. [2] Akpan, S. B., and E. J. Udoh, (2009a): Relative Price Variability and Inflation in grain sub-sector in Nigeria. Global Journal of Agricultural Sciences Vol. 8, N0.2, Pp 147- 151 [3] Akpan, S. B., and E. J. Udoh, (2009b): Estimating Grain Relative Price Variability and Inflation Rate Movement in Different Agricultural Policy Regimes in Nigeria. Humanity and social sciences journal 4(2): 107 - 113. [4] Bollerslev, T. (1986): “Generalized Autoregressive Conditional Hetroscedasticity.”Journal of Econometrics. 31. 307-327. [5] Central Bank of Nigeria: Statistical Bulletin Central Bank of Nigeria, 2002 and 2010. [6] Crains, S. J. and Lee, J. H. (1996): Volatility in Wheat spot and future Markets, 1950-1993: government farm program, seasonality and causality. Journal of finance, 51, 325-343. [7] Essang, S. M. (1973): The ‘Land Surplus’ Notion and Nigerian agricultural development policy. [8] FMA, (1984): Information Bulletin on Nigeria Agriculture, Federal Ministry of Agriculture and Natural Resources, Lagos. [9] Garba, P. K. (2000): An analysis of the implementation and stability of Nigerian agricultural policies, 1970–1993. AERC Research Paper 101 African Economic Research Consortium, Nairobi [10] Gujarati, D. N. (2004): Basic Econometrics. Tata McGraw-Hill publishing company limited. New Delhi, India. [11] Muroi, Y. (1989): Economic crisis and development policies in African states in 1980s. Institute of Developing Economies (I.D. E.), Tokyo. [12] Ojo M. O, Akanji F. (1996): Responsiveness of selected Agricultural Export Commodities to Exchange rate Devaluation in Nigeria. An Econometric analysis. CBN Economic and Financial Review, 34(2): 511- 578. [13] Udoh, E. J. and S. B. Akpan. (2007): Estimating Exportable Tree Crop Relative Price Variability and Inflation Movement under Different Policy Regimes in Nigeria. European Journal of Social Science, 5(2): 17-26 [14] Ukoha, O. O. (2007): Relative Price Variability and Inflation: Evidence from the Agricultural Sector in Nigeria. AERC Research Paper 171 African Economic Research Consortiums, Nairobi. [15] Yang, J., Besslev, D. A. and Leatham, D. J. (2001): Asset storability and price discovery of commodity futures markets: a new look. Journal of Future Markets, Vol. 21, Pp 279-300. [16] Young, E. and Shields, D. A. (1996): OVERVIEW: FAIR Act frames farm policy for 7 years, Agricultural outlook (USDA), April 1-4 Figure 1: Trend in Food Crop Output and Output Volatility in Nigeria 10 SORGHUM VSORGHUM 5.0 RICE VRICE 5 2.5 1960 1970 1980 1990 2000 2010 1960 1970 1980 1990 2000 2010 Year Year 20 CASSAVA VCASSAVA 7.5 MAIZE VMAIZE 5.0 10 2.5 1960 1970 1980 1990 2000 2010 1960 1970 1980 1990 2000 2010 40 Year Year YAM VYAM 30 20 (Note: Output are measure in tonnes, for output axis, Sorghum = *107 tons; Rice = *106 tons; Cassava = *107 tons; Maize = *106 tons; and 6 -1 -1 10Yam = *10 tons. Volatility axis for Cassava = *10 and Yam = *10 . Also, VSorghum = Volatility of sorghum, VRice= volatility of rice; VCassava= volatility of cassava; VMaize = volatility of maize; VYam = volatility of yam) 1960 1970 1980 1990 2000 2010 33Year
- 7. Developing Country Studies www.iiste.org ISSN 2224-607X (Paper) ISSN 2225-0565 (Online) Vol 2, No.1, 2012 Figure II: Trend in Food Crop Output and Output Volatility in Nigeria 5 MELON VMELON 3 BEANS VBEANS 4 2 3 2 1 1 1960 1970 1980 1990 2000 2010 1960 1970 1980 1990 2000 2010 Year Year 1.00 MILLET VMILLET OKRA VOKRA 1.5 0.75 0.50 1.0 0.25 0.5 1960 1970 1980 1990 2000 2010 1960 1970 1980 1990 2000 2010 Year Year (Note: Output axis for Melon = *105 tons; Beans = *106 tons; Millet = *107 tons; Okra= *106 tons. Volatility axis) Table I: The GARCH model estimates for equation 2 and 3 Variable Cassava Sorghum Rice Maize Yam Melon Beans Millet Okra Mean Eq. λ 9.32 8.52 7.29 8.55 8.80 5.40 6.53 8.35 6.05 (5.21)*** (18.7)*** (5.91)*** (15.7)*** (9.40)*** (8.9)*** (7.31)*** (6.10)*** (6.64)*** Var. Eq. δ 0.003 0.009 0.02 0.06 0.06 0.002 0.06 0.04 0.0004 (1.24) (0.95) (0.90) (4.60)*** (1.57) (0.66) (1.29) (4.62)*** (1.41) α 0.99 0.60 0.96 0.59 0.76 0.66 0.71 0.98 0.57 (3.45)*** (2.21)** (2.90)** (9.82)*** (6.27)*** (3.36)*** (2.26)** (4.10)*** (4.50)*** β 0.00 0.31 0.01 0.33 0.19 0.33 0.29 0.00 0.053 (1.66)* (1.86)* (0.01) (2.96)*** (2.47)** (2.50)** (1.83)* (1.14) (2.91)*** Persistence 0.99 0.91 0.97 0.92 0.95 0.99 0.99 0.98 0.623 AIC 46.11 43.91 129.85 85.13 85.05 93.24 104 39.26 40.11 HQC 49.70 47.49 133.43 88.00 87.94 96.83 107 42.13 42.98 SBC 55.57 53.37 139.31 92.69 92.64 102.70 113.85 46.82 47.68 Loglik -18.06 -16.96 -59.92 -38.56 -38.54 -41.62 -47.19 -15.63 -16.06 Source: Asterisks *, ** and *** represent 10%, 5% and 1% significance levels respectively. Variables are as defined in equation (2) and (3). Table II: Result of the Unit Root test for Variables Used in the Analysis Augmented Dicker Fuller Test for unit root Logged With Trend Without Trend Variables Level 1st diff. OT Level 1st diff. OT VCassava 2.289 -6.08*** 1(1) -1.641 -5.65*** 1(1) VSorghum -2.389 -7.52*** 1(0) -2.220 -7.56*** 1(1) VRice -4.115** -16.5*** 1(0) -2.800 -16.2*** 1(1) VMaize -3.528** -12.5*** 1(0) -2.428 -12.7*** 1(1) VYam -3.925** -11.3*** 1(0) -0.088 -10.8*** 1(1) VMelon -3.781** -10.71*** 1(0) -3.247** -10.82*** 1(0) VBeans -3.587** -9.79*** 1(1) -1.818 -9.716*** 1(1) VMillet -4.099** -12.64*** 1(0) -4.166** -12.62*** 1(0) 34
- 8. Developing Country Studies www.iiste.org ISSN 2224-607X (Paper) ISSN 2225-0565 (Online) Vol 2, No.1, 2012 VOkra -1.990 -10.99*** 1(1) -1.255 -9.47*** 1(1) 1% -4.16 -4.16 -3.57 -3.57 5% -3.50 -3.51 -2.92 -2.92 Note: OT means order of integration. Critical values (CV) are defined at 1% and 5% significant levels and asterisks *** and ** represent 1% and 5% significance levels respectively. Variables are output volatility of respective crops. Table III: Mean Annual Food Crop Output (tons) and Growth rate of output in Various Agricultural policy Programme Regimes in Nigeria (1961 - 2009) PRE-OFN OFN GR SAP PSAP (1961-1975) (1976-1979) (1980-1985) (1986-1993) (1994-2009) Food Output GR % CV% Output GR % CV% Output GR % CV Output GR % CV% Output GR CV Crop % % % ‘000’ ‘000’ ‘000’ ‘000’ ‘000’ Sorghum 3719.1 -5.3 17.9 2860.5 -2.9 12.7 4001.2 8.2 15.3 5300.6 1.9 11.2 7763.9 -1.9 15.5 Rice 332.8 5.9 37.2 472.8 -8.1 46.9 1265.2 9.5 8.7 2578.9 7.0 28.9 3255.9 -0.4 13.3 Cassava 8817.7 2.2 10.8 11500 3.2 5.02 11340 -0.4 6.8 20433.3 10.5 34.4 36043.6 1.03 14.4 Maize 1058.2 -4.3 23.7 716.0 -30 34.6 1024.5 19.2 44 5268.3 13 16.6 5897.8 0.3 17.9 Yam 7115.1 4.6 33.8 5992.0 -13.7 9.88 5030.2 -1.85 6.2 12604 16 50.9 28223 1.5 15.8 Melon 104.8 -14.1 40.1 129.5 -19.5 23.1 113.3 2.35 31 209.8 3.5 20.8 384.6 4.4 20.7 Beans 607.5 -21.2 34.7 564.3 -14.5 24.8 559.5 -1.71 10 1142.8 11 31.0 2253.7 2.23 23.6 Millet 2886.4 7.04 22.6 2556.0 -10.9 9.56 2903.0 6.46 16 4385.4 4.1 9.9 6325.6 -1.3 18.4 Okra 2811 2.7 11.9 391.3 3.87 4.47 445.8 2.42 4.5 558.4 0.01 17.5 803.19 1.68 23.3 Note: CV means coefficient of variability of output; GR = growth rate of output. Output was measure in tonnes. Table IV: Estimates of ANOVA equation involving Dummies for each cash crop Enterprise Variable Cassava Sorghum Rice Maize Yam Melon Beans Millet Okra Constant 1.352 0.211 0.633 0.059 2.557 0.262 1.391 0.194 0.604 (21.11)*** (7.95)*** (2.98)*** (0.27) (21.2)*** (3.94)*** (11.46)*** (4.77)*** (8.09)*** PREOFN -1.245 -0.072 1.990 2.614 -2.259 0.529 -1.027 0.053 -0.293 (-13.53)*** (-1.89)* (6.53)*** (8.25)*** (-13.03)*** (5.49)*** (-5.89)*** (0.90) (-2.73)*** OFN -1.347 0.084 1.283 2.988 -2.472 0.099 -0.963 0.037 -0.579 (-9.40)*** (1.42) (2.70)*** (6.06)*** (-9.17)*** (0.67) (-3.55)*** (0.402) (-3.48)*** GR -1.345 -0.038 -0.508 3.389 -2.527 0.417 -1.248 0.040 -0.600 (-10.97)*** (-0.75) (-1.25) (8.03)*** (-10.94)*** (3.25)*** (-5.37)*** (0.52) (-4.20)*** SAP -1.061 -0.187 -0.328 0.066 -1.957 -0.173 -1.095 -0.167 -0.481 (-9.57)*** (-4.07)*** (-0.89) (0.17) (-9.37)*** (-1.49) (-5.21)*** (-2.37)** (-3.72)*** R2 0.85 0.35 0.62 0.75 0.84 0.54 0.55 0.19 0.39 F-cal 63.59*** 6.01*** 17.66*** 32.55*** 60.57*** 12.86 13.52*** 2.64** 7.16*** AIC 10.34 -76.09 127.69 131.49 72.36 14.77 72.95 -34.21 25.23 HQC 13.92 -72.51 131.28 135.08 75.95 18.36 76.53 -30.62 28.82 SBC 19.80 -66.64 137.15 140.95 81.82 24.23 82.41 -24.75 34.69 LogLik -0.17 43.05 -58.85 -60.75 -31.18 -2.38 -31.47 22.10 -7.61 Note: Asterisks *, **, and *** mean significant at 10%, 5% and 1% level respectively. Variables are as defined in equation 4. 35