A Multimedia Visualization Tool For Solving Mechanics Dynamics Problem
DMD
1. Dynamic Mathematical Display
Chelsie Zamelis (lead), Hamzeh Musleh, Ni Nguyen, Andrew Ruiz, Alexandra Serdyuk,
Matthew Ferro, Michael Madalina, San Min Liew, Christopher Dombroski, Jesslyn Budiman
Department of Physics, Edmonds Community College, Lynnwood WA 98036∗
(Dated: 16 May 2014)
It is often forgotten students are learning to build a better future. As a group of students, we
are looking to create a form of innovative technology that provides a learning experience through
two of the most important learning methods: visual and kinesthetic. To provide hands-on learning
experience, we have created the Dynamic Mathematical Display (DMD). The DMD is a device with
pins in a three by three grid. The pins are 150mm length, 12.5mm width, and each controlled by
individual motors and slide potentiometers. The dynamic movement of each pin is measured by the
potentiometer’s linear resistance, which is monitored electronically by a computer program. That
program will engage the pin to move to a given point projected from 3D graph. The main purpose
of the DMD project is to create a morphing table that will allow a user to visualize complicated 3D
graphs with all their components such as depths and peaks. These components will be represented
by light emitting diodes (RGB LEDs), which are attached to each pin. The LED’s are programmed
to provide color based on the physical location of the pin at the time according to the projected
graph. Both instructors and students will have the option to manipulate the brightness and color of
the LEDs. While the pins provide kinesthetic information to a graph, the LEDs provide additional
visual information similar to a topographic map, enhancing the learning experience of a student by
presenting more realistic and information-rich representations of physical models.
PACS numbers: 01.50.H-,01.40.gb,01.40.Ha,01.50.F-
Keywords: Computers in education,Teaching methods and strategies,Learning theory and science teach-
ing,Audio and Visual aids
I. INTRODUCTION
As students we all wish to seek a better way to learn,
and help others in our community. Technology is one
of the best ways to accomplish this. There are twelve
ways of learning that are known to society, this project
is made for the purpose of emphasising kinesthetic and
visual learning. Students at an advanced level of calculus
are often struggling with the visualization of complicated
mathematical graphs. Instructors are not always able
to provide good resources for better visualization of
mathematical problems. Being concerned with that,
the idea of making the Dynamic Mathematical Display
(DMD) that would be able to represent complicated
three dimensional shapes was brought up. An article
written by MIT (Massachusetts Institute of Technology)
brought to our attention. MITs researchers are able to
build an apparatus that is able to form shapes of various
complexities by using slide potentiometers. In order
to provide better visualization of shapes, a projector
is used to represent the height of the motorized pins
that were used as linear actuators with different colors
depending on their position in space. The DMD is
built in order to accomplish a similar task, but focus
more on the academic potential of the apparatus. The
∗ ni.nguyen107@gmail.com, aleeraalexia@gmail.com,
mattferro@siu.edu, andrew.ruiz@gmail.com,
j.budiman0777@edmail.edcc.edu, michaelmadalina@gmail.com,
hamzahmusle7@gmail.com, c.zamelis3011@edmail.edcc.edu,
s.liew2977@edmail.edcc.edu, dombroski.christopher@gmail.com
built apparatus should be able to represent different
mathematical equations in three dimensional space.
Thus, students in different educational institutions
would be able to visualize graphs in three dimensions.
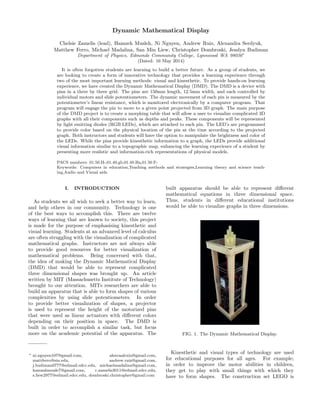
FIG. 1. The Dynamic Mathematical Display.
Kinesthetic and visual types of technology are used
for educational purposes for all ages. For example;
in order to improve the motor abilities in children,
they get to play with small things with which they
have to form shapes. The construction set LEGO is
2. 2
used for this purpose in many cases. Modeling clay is
also used to provide visual and kinesthetic learning for
individuals of all ages. Individuals can form various
shapes by using their hands. Even the process of three
dimensional printing would take a part in kinesthetic
learning where an individual can print a designed shape
in three dimensions and get a physical object.
This type of technology has a great academic po-
tential for students to support learning process and
to improve their cognitive and recognitional skills. It
can help students to learn; as the actuators can move
based on an equation to give a better, more descriptive
representation of a graph. Math will no longer just be
a drawing on the board, but an actual physical shape.
Topographers can even use this type of technology for
mapping the depth for various landscapes so it can be
more visible to a user. Math instructors would be able
to explain students material more effective and give
them better understanding of the subject.
This work explores the possibility to provide kines-
thetic and visual learning to society. The DMD was
built as a result of the research based on ways to improve
students learning. The purpose of DMD is to provide
the opportunity to visualize complicated mathematical
graphs in three dimensions. This purpose could be
achieved by not only motorized pins that represent a
point on the graph, but also, by tricolor light emitting
diodes (RGBs). Colors of RGBs represent the depth
and the height of each point on the graph in three
dimensions. Since several techniques were used for the
apparatus to improve its visualization, it adds more
stability to accomplishment of the purpose.
II. PHYSICAL CONSTRUCTION
The DMD uses a three-by-three grid of motorized
translucent acrylic pins to represent a mathematical
display. The acrylic pins are three dimensional printed
rectangular pins with height 150mm and width 12.5mm.
With its translucent material, the user is able to see
different varieties of color emitted from the LEDs which
are attached to the pins. Push-pull rods and the linkage
are used to connect the pins and the slide potentiometers
together. The linkage (Gold-N-Rods) transfers upward
and downward force from the motorized slide poten-
tiometer. All nine slide potentiometers are mounted
onto three Adafruit Motor Shield and an Arduino Uno.
The Adafruit Motor Shield is used to drive the DC
motor of the slide potentiometer that moves the pins in
a bi-directional motion. Also, the DMD uses Arduino
Uno to microcontrol the movement of the acrylic pins.
A program is written specifically for the arduino to
receive a serial input with target position data, and
move the pins to the desired target position smoothly
and efficiently.
In order to have a structure to hold all the materials
together, a wood table is created. The table is rectangu-
lar shaped with dimensions 609.6mm tall 45mm width
and length. In addition, plexiglass was used for mount-
ing all of the materials including slide potentiometers,
linkages, Acrylic 3D pins, LED control boards, Arduino
Uno, Motor Shield and Raspberry PI together acting as
a support. The transparent property of the plexiglass
displays the interior of our materials clearly, allowing
user to observe how DMD works internally.
III. THE BUILDING PROCESS
A. Prototype
In process of searching for the way to resolve students
frustrations with Multivariable calculus classes, the idea
of building the DMD that would be able to graph three
dimensional graphs was brought up. Once the idea of
the apparatus is introduced to the group, the concept of
the building process started to develope. First of all, the
group agreed on the purpose of the construction: had
to have ability of building three dimensional graphs for
better visualisation. During months of brainstorming,
several ideas of how to execute the purpose were brought
up. One of those ideas became the prototype for now
functioning device. Actual design of DMD was based
on less elegant prototype which had its own limitation
that were improved in actual design. Collaboration of
members of the group allowed to develop design of the
prototype from just a concept idea.
In the beginning, the DMD would have the same
overall structure but each pin would be driven by a
stepper motor. Pins themselves didnt have any linkages
but were fastened to the motor with the pinion that
would slide on cut rack for the pinion. Prototype pin
was three dimensional printed, thus, the pinion rack
placed inside pins frame was accurate enough for the
pinion to slide smoothly.
FIG. 2. First prototype included stepper motor and pinion
rack.
3. 3
The rack (pin) was controlled in depth by the stepper
motor with a pinion attached to it. The stepper motor
was controlled by arduino uno microcontroller and
allowed a user to have full control over the system
through a computer. Original pin is 32mm wide, 200mm
long and 4mm thick and it has LED slot for all wiring
required for LEDs inside. Dimensions of the original
pin added some complications to the design of three
project. Since it was massive the resolution of graphs
would be very poor. Due to the stepper motors large
individual size, the spacing between pins would be
disproportionately large. If the spacing between pins is
huge, the resolution of the final graph would go down.
Another obstacle that was overcome is overheating
of the stepper motor. The stepper motor was replaced
with a slide potentiometer. Such a change added several
advantages to the system. Overall dimensions of the
apparatus shrunk and more compact. Due to the fact
that slide potentiometers were put in use, the dimensions
of the pins were significantly changed. The whole pin
structure was redesigned. Pinion rack and pinion itself
were replaced by linkages. Linkages would attach to the
side of a pin and the other side of linkage would attach
to the potentiometer’s slider. Improvement in design of
the system allowed to overcome slipping problem that
occurred during the process of pinion sliding along the
pinion rack (See figure 2).
IV. RED-GREEN-BLUE LIGHT EMITTING
DIODES (RGB LED) DISPLAY
In addition to the movement of the pins, tricolor LEDs
are used to provide another dimension to the DMD. The
LEDs are mounted inside of each pin to appear inte-
grated with them. Having another dimension allows the
visibility of more data such as minima and maxima. The
tricolor nature of the LEDs allows the mixing of light
to form the entire color spectrum. LEDs help enhance
users experience when using the DMD. As mentioned in
the introduction, a topographer could potentially bene-
fit using LEDs to analyse differences in landscape shapes.
Another reason for having RGB LEDs in each pin is
to improve the definition of the graph that is going to be
represented. Having an apparatus capable of producing
an image characterized by fine details defined with LED
lights will enhance the picture of any given generic
equation. In order to accomplish the task of making
visualization of the display better, several parts had to
be designed and constructed according to specifications
of the apparatus.
The LED control board is a three-inch by four-inch
pre-drilled circuit board with 0.1inch hole spacing.
The board hosts three latching shift registers, nineteen
potentiometers, eighteen NPN transistors, a single
two-position terminal header, a single protection diode,
two 0.9 microfarad capacitors, one one-thousand ohm
resistor, one fifty-one ohm resistor, two insulated test
points, a nine-position header strip, a twenty-eight po-
sition dual-row header strip, and 30 gauge insulated wire.
FIG. 3. RGB LED control board.
A. Coding
There are three different programs running on a total
of two devices, an Arduino Uno and a Raspberry PI
computer. The devices are configured in a master-slave
setup. The PI acts as master and takes user input to
calculate all information needed to be displayed. The
Arduino acts as slave and directly controls each motor
for the data supplied to it.
To outline the program running on the PI, there are
3 parts, user input, serial communication, and data
processing. User input is a simple text-based interface
that runs from a console. Mathematics is an integral
facet of the DMDs operation so a way to take a function
and have the computer understand it was a challenge
overcome in this project. To use the function, it was
broken up into numbers, variables, functions, and oper-
ators (tokenized). Then the tokens were organized into
reverse polish notation (postfix) using the shunting-yard
algorithm. A short definition for tokenized postfix
notation is breaking up elements where postfix notation
is a mathematical notation for which operators follow
their operands. Once the data was transformed into
the more efficient notation, it was calculated using a
postfix interpreter. Because the variables change for
every pin, it was interpreted several times with new data
for each pin. Communication is done over usb serial
and is bi-directional. It is running at the default 9600
bytes per second. There are two types of data being
sent, the function for displaying on the screen, and the
data for the pin. To signify the different type going
over, a unique pattern was used as a start marker. For
data processing, a viewing window is defined and split
up for the different location of pins. For each value of
the pin, a different location of x and y axes is used and
the interpreter uses the new variable to generate a new
value. The parts are then fed into the interpreter with
4. 4
the new location variables. To make sure all parts of the
graph is visible within the window, the pin height data
is recorded for its maximum and minimum values. The
values are then transformed to be a percentage between
zero and one-hundred (normalized).
The program on the Arduino Uno is very simple, hav-
ing only serial input for pin height and a feedback loop
to make sure it gets there properly. The Arduino has
limited processing power so to make sure it runs as fast
as possible we limit the amount of data sent over serial
and directly send the pin height as the exact byte val-
ues rather than a text representation. Because the of the
slow refresh rate, the several ways of controlling the pin
were tested. Some of the implementations are blocking
and work one pin at a time, whereas others ended up
jittery and dont settle to the correct value. To prevent
jittering, a small dead-zone is in place where the program
accepts the pins actual height as close enough.
B. Programming and Control of Motors
The basic function of the arduino is to receive an
input with position data and to move the pins to
the desired target position. The arduino starts by
setting up communications with the serial port and
communicating with the motor shields. It then runs a
calibration function which calibrates the position of the
pins relative to the reference voltage received from the
slide potentiometers. The calibration function works by
driving the pins upward until they hit a hard stop, then
it reads the potentiometers’ position and records it as
the maximum value. After the value is recorded the pins
are driven downward until they hit a hard stop at the
bottom. It again reads the potentiometers’ position and
records it as the minimum value. Once the value is set,
the motors are released.
FIG. 4. Three dimensional drawing of Arduino Uno.
After the setup and calibration, the code enters the
main loop. The main loop constantly cycles through
updating the pins current position, checking for serial
data, checks target position limits, sets motor speed,
and checks or moves the pins.
The current position of each pin is checked and
recorded by reading the analog potentiometer values.
The pins are labeled as a grid with A, B and C in
a row, 1, 2 and 3 in a column. Potentiometer A1 is
read directly from pin A3 on the arduino, all other
potentiometers are connected to the 10 bit analog port
expander (MCP3008). All values are remapped from
the minimum value approximately and maximum value
approximately 1023 to a new range of 0 to 100.
When the serial data is available it is received in the
form of 18 bytes. The bytes are put into a buffer and
then deciphered into position data for each pin. Each pin
uses two bytes for its target position. A user feedback
is also given to send the values it received back through
the serial port. The code then checks to see if the input
data is within the valid range of pin travel. If its is not,
it will scale all values to fit the limitations of DMD table.
The speed of the pins are set by an external po-
tentiometer. The value is read from arduino pin A2
and is remapped from (0 to 1023) to (0 to 255), this
value is stored as Speed. The speed of the motors are
then set by using the set speed function called from
the adafruit library. Each motor is then controlled by
checking their current position and comparing it their
target position 1. This happens in two steps by utilizing
two if statements, one for forward movement and on for
backward movement.
FIG. 5. Three slide potentiometer mounted on an acrylic
piece.
V. RGB LED PROGRAMMING
Each tri-color LED displays different colors using the
Python programming language with the RPIO package.
The decision for Python as the programming language
is due to its rapid implementation and common use in
real-world applications. The RPIO package provides
Python both necessary access and tools for controlling
communication pins on the Raspberry PI.
The program may run from the terminal window and
requires nine three-byte hexadecimal numbers. Every
byte in the hexadecimal input corresponds to a red,
green, and blue value of the given LED. The program
5. 5
FIG. 6. Acrylic pins with RGB LED’s.
then scales the hexadecimal value to an integer ranging
from zero to one-hundred; this number determines how
many sub-cycles each color in every LED will illuminate.
The LED Control program sets up one-hundred
sub-cycles that repeat every twenty milliseconds. Thus,
the program sends values to the shift registers in data
bursts that occur every two-hundred microseconds.
The data bursts determine which LEDs are illuminated
until the next data burst is received. To maintain
stricter color representation the LEDs do not output
while data transmission occurs. This results in a one-
hundred-microsecond data transfer time, an approximate
duty cycle of fifty percent, and a refresh rate of fifty hertz.
Variations of the red, green, and blue brightness allow
the eye to perceive different colors. For instance, a fully
on blue and red light will appear purple; or fully on red
and green lights will appear yellow. If all three colors
are fully on, the light will appear white. The way the
eye perceives color is a combination of red, green, and
blue light due to its trichromatic nature; as a result, the
LEDs in the DMD can represent one million different
colors.
Early prototypes of the program involved using loops
to switch the LEDs on and off. Although the pulse-width
and frequency of the switching was easily adjustable,
visible stutter occurred while the programming loops
were running. The cause of the visible stutter is due
to loops using RPIO require high resource usage of the
Raspberry Pi; therefore, a certain command may not
run in real-time, causing the LED to toggle later than
desired. As a result, a new method for controlling the
pins was required.
The RPIO package comes included with PWM class
designed to control servomotors. The PWM class can
control any communication pins output by utilizing
DMA channels. The usage of DMA channels reduces
the need for simultaneously running loops while greatly
reducing computer resource usage. The PWM class
toggles pins at repeating intervals based upon conditions
set by the programmer. The variables for the PWM
output are the DMA channel, a pulse-length granularity,
and a repeat interval at which the programmed pulses
repeat. The pulse-length granularity, or time resolution,
and the repeat interval are set in microseconds. For
this project, the granularity of the pulse length is one
microsecond and then repeat interval is set to twenty-
thousand microseconds, or twenty milliseconds.
While the PWM class resolved the issue of high re-
source usage, it introduced a couple timing restrictions.
For instance, the PWM class does not allow one pin
to toggle on and another to toggle off within the same
pulse-length granularity window. In practice, this means
that no shift registers can accept different data simul-
taneously. Another issue with timing is the inability
to have a pulse window smaller than five microseconds
[experimentally]. Although pulses can toggle pins at a
timing resolution of one microsecond, if the pulse length
was smaller than five microseconds the Raspberry PI
would not provide any output. As of this writing, it is
unsure if the limitations are hardware or software based.
Due to the PWM classs inability to toggle multiple pins
within the same microsecond window, each pin uses pro-
grammed offsets for data transmission. Five data bits are
required every clock cycle; therefore, five different offsets
are required for each clock cycle. The program toggles
shift register pins in the following order: strobe signal,
red shift register data, green shift register data, blue shift
register data, and finally the clock signal. The final, or
ninth LED, receives three separate signals directly from
the Raspberry Pi near the ninety-five microsecond offset
in the data burst time section.
FIG. 7. RGB LED schematic.
VI. ANALYSIS
A. Apparatus Limitations
DMD was constructed to fully accomplish its purpose;
however, there are certain limitations to the apparatus
due to the design. One of the biggest limitations of the
apparatus was it lacks the number of pins that represents
specific points on the graph. The pins make up the reso-
lution of the graph to be represented. Thus, lack of pins
would make it harder for a user to visualize represented
graph. Improvements of the actual design would resolve
such limitations. Since the DMD was created strictly for
6. 6
academic purposes, the only limitation is it lacks resolu-
tion. With the current resolution of the apparatus it is
difficult to visualize the complexity of each graph. Thus,
there are certain improvements that need to be made
in order to thoroughly represent the concept of the DMD.
The DMD is able to represent graphs of various
shapes. However, graphs that can be represented cannot
have negative values and thus must be shifted in order
for the DMD to build them. The DMD uses slide
potentiometers that lift up the pins that are mounted
by linkages. The origin of the tabletop of the apparatus
is represented by pins with zero height. Since pins are
150mm long, maximum height that can be reached
is 100mm from the table top. Change of pins initial
height would allow a user to model graphs with negative
values as well as positive. DMDs design is developed
to represent only positive values of the graphs and thus
such limitation would be an obstacle for a user.
Both of the obstacles that are listed above are added to
the future work of the project. Therefore, further modi-
fications are going to be made in order to overcome spec-
ified limitations.
B. Graphial Equations
(-1,-1) (-1,0) (-1,1)
(0,-1) (0,0) (0,1)
(1,-1) (1,0) (1,1)
TABLE I. A table representation of pin location. The pins
create a 3 by 3 grid array with the center, represented by (0,0)
on this table, being the origin for our calculations.
Figures (8-15) represent the comparisons between the
generic mathematical equation to the actual equation
used, in addition the figures include plots of the sam-
pled points the table moves the individual pins to. Due
to pixel limitations the equations had to be shifted and
scaled. Essentially, the actual equation is sampled at 9
points and those values are scaled and shifted then dis-
played on the table. Beta represents the amplitude scal-
ing and alpha represents the shifting. Also, if beta is
negative the negative sign will cause an amplitude rever-
sal. The prefered graph had equation in which beta is
equal to 1 and alpha is equal to 0; however, due to the
limitations of the apparatus these equations had to be
changed as shown above. That is, the original equation
required a -z value, this meant the graph needed to be
shifted up in the z axis to avoid any negative values for
z. Finally, scaling z has been scaled from 0 to 100 which
represent the height of each pin.
FIG. 8. Generic equation: Z(m, n) = −β((x + m)2
+ (y +
n)2
)+α where −β is representing a scaled amplitude reversal
and α represents a shift. To accommodate the fact that the
table cannot display negative values we shift must utilize the
shift value α.
FIG. 9. Actual equation: z(m, n) = 99292(−(x + m)2
− (y +
n)2
) + 100. The amplitude has been scaled by 99292 and the
plot shifted upward by 100 units.
FIG. 10. Generic equation: Z(m, n) = β(x + m) + α. This
graph shows negative z values which cannot be fully repre-
sented with the apparatus due to the limitation of the pixels.
FIG. 11. Actual equation: Z(m, n) = 50(x + m) + 50. Am-
plitude scaled by 50 and shifted up by 50 units.
7. 7
FIG. 12. Generic equation: Z(m, n) = β(−|x+m||y+n|)+α.
This graph shows negative z values which cannot be fully
represented with the apparatus due to the limitation of the
pixels.
FIG. 13. Actual equation: Z(m, n) = 50(x + m) + 50. Am-
plitude scaled by 50 and shifted up by 50 units.
FIG. 14. Generic equation: Z(m, n) = β(sin((x + m)(y +
n))) + α. This graph shows negative z values which cannot
be fully represented with the apparatus due to the limitation
of the pixels.
FIG. 15. Actual equation: Z(m, n) = 50(x + m) + 50. Am-
plitude scaled by 50 and shifted up by 50 units.
VII. CONCLUSION
The Dynamic Mathematical Display was able to suc-
cessfully model several forms of multi-variable equations.
The RGB LEDs worked very well in enhancing the depth
perception of the graph. The motor system that drives
the pin yielded only 2 percent in error in positioning.
The apparatus provided sufficient examples of tangible
multivariable graphs. However, the three by three grid
is too low in resolution, the DMD can only graph simply
equations.
VIII. FUTURE WORK
Due to the lack of resolution it was required to test
the ability of the apparatus based on only a select
few equations. This also required manipulating the
equations to the convenience of the apparatus. If there
was, however, an increase in resolution more complex
graphs could be clearly represented within the project.
Due to limited number of pixels in the display,
implementing a type of flexible material over the pins
was needed to show a decent graph. In order to show a
smooth surface graph, it was desired to put a material
on top of the pins. However, due to the lack of a stop
point on the potentiometer (knows its position) most
materials that could be placed onto the pins would put
force onto the motors. This would cause the motors
to oscillate in attempt to go to the ordered position.
Eventually this would burn out the motor. In the future,
it would be best to have the ability to either have more
pixels (preferably 30×30) or have a motor to know its
position and yet handle small amounts of force.
Another limitation of the apparatus is, it currently
cannot show negative z values. As a result any generic
graph with such values, must be shifted by a term alpha.
In the future, it would be more desirable to have a
pin that could move more than 100mm. This however,
would require different motor with more torque to lift a
pin.
Lastly, with the current coding any equations to be
displayed must be hard coded in. In the future it would
be more desirable to have the ability to have a user
interface which would work similar to a search engine.
Liquid Crystal Display screen can be placed on the
surface area of the apparatus allowing a user to see the
type of the graph that is going to be represented.
ACKNOWLEDGMENTS
Dr. Tom Fleming, Jason Sawatzki and Patrick Burnett
has been a great help in this project. They have been ad-
8. 8
vising and supporting this projects members throughout the research.
[1] Tangible Media Group. Tangible Media Group, 2014.
Web. 05 January 2014.goo.gl/BSmWm1.
[2] Rack and Pinion — Www.robives.com. Rack and Pinion,
2014. Web. 05 January 2014.goo.gl/uGZ8mB.
[3] Wolfram—Alpha: Computational Knowledge Engine.
Experimental Feature, 2014. Web. 03 January 2014.goo.
gl/DkgbfB.
[4] N-D Test Functions R AMPGO 0.1.0 Documentation. ,
2014. Web. 05 January 2014.goo.gl/BsTZca.
[5] Wolfram—Alpha: Computational Knowledge Engine.
Experimental Feature, 2014. Web. 03 January 2014.goo.
gl/Xv4LEQ.
[6] Newswanger, Craig. Makezine. 21 Tooth Mod 1 Gear,
2014. Web. 04 January 2014.goo.gl/bvIls6.
[7] Adafruit.com.Stepper motor - 200 steps/rev, 12V
350mA, 2014. Web. 04 January 2014. bit.ly/1j0ynRQ.
[8] Adafruit.com.Adafruit Arduino Motor Shield, 2014. Web.
05 January 2014. http://www.adafruit.com/products/
1438.
[9] Dave, Dojo.Arduino - Potentiometer, 2014. Web. 15
March 2014. http://goo.gl/L7qLwI.
[10] Nussey, John.AHow to Control the Speed of a DC Motor
with the Arduino, 2014. Web. 15 March 2014. http://
goo.gl/AUWFF7.
[11] Adafruit Industries Blog RSS.Adafruit Mo-
tor/Stepper/Servo Shield for Arduino V2 Kit., 2014.
Web. 15 May 2014. http://goo.gl/csJduq.
[12] 500+ Named Colours with Rgb and Hex Values.500+
Colours, 2014. Web. 15 May 2014. http://goo.gl/
DL6904.
Appendix A: Materials
1. Acrylic sheet
2. Plexiglass
3. Wood
4. Slide potentiometer - Qty. 10
5. Linkages
6. Arduino Uno - Qty. 1
7. Adafruit Motor Shield - Qty. 3
8. Solder
9. ADC with SPI Interface (MCP3008) - Qty. 1
10. RGB LEDs - Qty. 9
11. Shift Registers (CD74HC4094E) - Qty. 3
12. Transistors (KSC1008YBU) - Qty. 19
13. 3×4 Perf. Board - Qty. 1
14. 2×2 Perf. Board - Qty. 1
15. Potentiometer (Spectrol 63P253) - Qty. 18
16. Potentiometer (Spectrol 64P103) - Qty. 1
17. Capacitors (0.9uF) - Qty. 2
18. Diode (1N4001) - Qty. 1
19. PCB Terminal Block - Qty. 1
20. 16 Pin Dip Sockets - Qty. 4
21. 10mm Standoffs - Qty. 4