1. Proceedings of the 8th Annual FEP Honors Research Symposium
Copyright, 2016, Mitchell, A., Smith, A., Pleasedo not usethematerials without expressed permission of theauthors.
Mitchell, A. and A. Smith 1
Evaluating Labs and Methods for Testing Nitrate Concentrations in
Surface Water
Aryana Mitchell
Department of Biological and Agricultural Engineering
April Smith
Department of Civil Engineering
Mentor: Brian E. Haggard, Ph.D.
Department of Biological and Agricultural Engineering
Abstract
Within the Arkansas Water Resources Center,there are two main water quality labs used for this purpose. Our goal was
to determine if there were significant differences between analytical methods and labs in the measurement of nitrate, and
whether one method or lab had any advantages over the others.
1. Introduction
The overall need forwater is immense, as we use it for practically every aspect of life. For example,
we consume it to stay hydrated, clean with it, and use it as an agent in many industrial processes.
Water is also necessary foragriculture and energy production. Everythingwe as humans do has
some impact on the quality of our water resources. As scientists and engineers, we develop, design,
and modify natural and manmade processes to treat water, but Dearmont et al. (1998) stated that
the cost of water treatment, however,increases with decreased water quality.
The water quality of streams, rivers, and reservoirs is influenced by a multitude of factors,including
land use and management within the watershed. Allan (2004) explained how the source water we
use may be polluted by the land surrounding it, and the typeof land determines which pollutants
might end up in the water. For example, cropland might be a potential source of fertilizers
(nutrients, like nitrogen and phosphorus) and pesticides, because these are applied to crops being
grown. When it rains on land intended forraising livestock,the manure may cause the runoff water
to contain nutrients, trace elements, and bacteria. On the other hand, runoff fromindustrial land
may transport oils, heavy metals, plastics, rubber, etc. to the downstream water bodies. Lawn
fertilizers and pet wastes in suburban areas are potential sources of nutrients and bacteria to the
water bodies. Also, Earnhart and Glicksman (2011) expressed that effluentdischarge from
municipal wastewater treatment plants, agricultural processing facilities, and or industrial plants
may contain a variety of pollutants.
Eachtype of land is a potential nonpoint source of pollution because runoff might transport
contaminants from the landscape into rivers and lakes. Nonpoint source pollution is the pollution of
bodies of water indirectly from sources surrounding it, and it represents a potential threat to
surface water. There are many nonpoint source pollutants, such as nutrients, sediment, and
bacteria. Twomajor nutrients that, in excess, cause potential environmental changes are nitrogen
and phosphorus. Eutrophicationresults fromnutrient enrichment leading to potential problems
like algal blooms that are harmful to humans, taste and odor problems in drinking water treatment,
and large diurnal swings in dissolved oxygen that can adversely affectaquatic life.
2. Mitchell, A. and A. Smith 2
Recently, studies have focused on thresholds in nitrogen and phosphorus concentrations which
result in shifts in community species and increases in algal biomass. Evans-Whiteet al. (2012)
reported a threshold range for benthic algal growthto be from0.270mg/L to 1.500 mg/L total
nitrogen (TN)and 0.007 mg/L to 0.100 mg/L total phosphorus (TP). These numbers are variable,
because the factors that controlalgal growth in one stream could be different than that of another
stream; these differences couldbe related to many things like sunlight availability, cloudiness of the
water, substrate type, frequency of floods, and even simply because of location and dissimilar
climates. Kratzer and Brezonik (1981) conductedtheir research on lakes in Florida, evaluating
when lakes shifted to eutrophic conditions and algal blooms. The range of TN concentrations in the
eutrophic level that they found was 0.92 mg/L to 1.47 mg/L and TP concentrations were 0.03 mg/L
to 0.048 mg/L. Whereas, Nürnberg (1996) found eutrophic limits of nitrogen concentrations to be
0.65 mg/L to 1.2 mg/L. For the sake of our research we are going to assume the widest range of
concentrations. This would mean that the range of concentrations for nitrogen is 0.27 mg/L to 1.5
mg/L and for phosphorus is 0.007 mg/L to 0.100 mg/L. In this specific project, wedecided to
narrow our studies to nitrogen, specifically nitrate (NO3) since TN is mostly made of nitrate.
1.1 Background
In Northwest Arkansas, many water samples are sent to be processed by water quality labs,
including twolabs at the University of Arkansas. Customers get their water tested for multiple
reasons, including an interest in safe drinking water, irrigation management, and general water
quality. The biggest threat to water quality is nutrients like nitrogen and phosphorus, whichcan
result in excess algal growth. The labs need to be able to accurately test samples with
concentrations around the nitrogen threshold to determine if excess nitrogen is a possible cause for
algal growth in the water. Each of these labs use different methods and equipment totest the
samples, so there couldbe a difference in their performances. Our hope was to discoverhow
precise and accurate each of the methods is overa range of concentrations of nitrogen.
The overall goal of this projectwas to evaluate methods and lab abilities to measure nitrogen, i.e.
nitrate. They need to be able to do this accurately within the nitrogen threshold range discussed
before, as wellas within common ranges of N concentrations found in streams and lakes. Stream
nitrate-N concentrations tend to range from less than 0.1 mg/L to more than 5 mg/L, whereas lakes
are usually lowerin the nitrate-N concentrations in the surface water. It is important that water
quality labs be able to measure N concentrations near thresholds important for algal growth. For
example, Grimm and Fisher (1986) found that when N concentrations were below 0.06 mg/L, any
added nitrogen resulted in algal growth shifting the algae toward P-limited growth. Therefore, the
labs might need to be able to accurately measure N concentrations below this level.
The two labs examined are both Arkansas Water Resources Center (AWRC) Water Quality Labs; one
is in the Biomass Research Center (BIOR) and the other is in the Biological and Agricultural
Engineering (BAEG)Research Center. Both labs are certified by the Arkansas Department of
Environmental Quality forwater analysis, including nitrate. The BIORlab is a fee-based production
lab that is designed to handle samples witha variety of concentrations due to blind analysis of the
water sample. The BAEG lab is a research lab which,unlike the BIOR lab, is designed to analyze
samples withsome information known about the water source and possible concentrations in the
water samples.
The production lab has two methods formeasuring the concentration of nitrate in water. When we
went to this lab to find out more information about the instruments, Mr. Keith Trost (personal
communication) was able to explain how they work. The first is by using a Dionex DX-120 ion
3. Mitchell, A. and A. Smith 3
chromatograph, whichuses a column to separate anions and then measures the concentration of
nitrate in a sample of water by reading the ions’ conductivity.Thesecond method is witha Lachat
Instruments Quick Chem 8500, which measures both nitrate and nitrite in the water samples. As
each sample is tested on the Lachet,it runs through a cadmium-copper column whichcauses the
nitrate to be reduced into nitrite. This solution is then analyzed colorimetrically,measuring the
concentration of nitrite and giving the concentrationof nitrate plus nitrite (hereafter, nitrate-N).
Nitrite concentrations in typicalstreams and lakes is very low relative to the amount of nitrate in
the water.
The research lab has only one method formeasuring nitrate, i.e. the Skalar wet chemistry
autoanalyzer, whichwas described to us by Mrs. Brina Smith (personal communication). It analyzes
water samples similar to the Lachat, where nitrate is reduced to nitrite and then measured
colorimetrically. Colorimetric analysis determines the concentration of a constituten with the aid
of a colorreagent, using absorbance of light at a particular wave length. The absorbance is linearly
proportional to the concentration of the sample, so the Lachet and Skalar are able to determine the
nitrate concentration based on a standard curveof known concentrations. The Skalar also
measures nitrate plus nitrite in watersamples (hereafter, nitrate-N).
1.2 Objectives
To examine each lab, wetested their precision and accuracy witha set of standards and with
multiple environmental samples. We wanted our standards to represent whatmight be observed in
the environment, and streams usually vary fromless than 0.1 mg/L NO3-N to more than 5 mg/L
NO3-N. The standards wecreated had a concentration range from0.01 mg/L NO3-N to 10 mg/L
NO3-N, with most of our concentrations on the lower end because that is where we hypothesized
there wouldbe a difference in the lab results. Sets of these standards were sent to each lab for
them to determine the concentrations using each method. We then used this data to see if there was
any significant difference (viaanalysis of variance withmeans separation) between the lab
techniques.
For our environmental samples, we wanted to make sure that the sources would give us a broad
range of concentrations. This natural gradient would test the lab equipment the most effectively,
where lakes were expected to have low NO3-Nconcentrations (<0.5 mg/L) and streams and rivers
were expected tohave higher concentration(>0.5 mg/L). We determined which streams we
wanted to sample from by using data froma U.S. Geological Survey report by Petersen et al. (2014)
that had NO3-N concentrations from these streams in 2011. We also tooksamples froma few local
lakes to ensure wegot lowerNO3-N concentrations to compare labs and methods. Eachlab received
the environmental samples to analyze, and this data was used to see how consistent the labs were
in their readings.
Our goal in this investigation was to determine whichlab method was most precise and/or accurate
relative to the concentrations needed to be measured in water quality studies, evaluating
thresholds in algal response to increasing nutrients.
4. Mitchell, A. and A. Smith 4
2. TestingThroughStandards
To begin making our set of standards, we first had to determine what concentrations of nitrate we
wanted. We wanted our standards to represent whatmight be observed in the environment, and
streams usually vary from less than 0.1 mg/L N03-N to more than 5mg/L NO3-N. More of our
concentration levels are on the lower end because that is where we believed there would be a
difference in the lab results.
We determined the volume of our 1000 mg/L NO3-N stocksolution wewould need to use to make
500 mL of each solution using the formula:
Cstock*Vstock=Csolution*Vsolution
We decided the volume of our solutions to be 500 mL because 180 mL would go to the BIOR lab and
60 mL wouldgo to the BAEG lab. Then wecould keep the leftoverof each solution in case we
needed more in the future.
Lab Number [NO3] (mg/L) mL of stock
1A/1B 10.0 5.0
2A/2B 5.0 2.5
3A3B 2.5 1.25
4A/4B 1.0 0.5
5A/5B 0.5 0.25
6A/6B 0.1 0.05
7A/7B 0.08 0.04
8A/8B 0.05 0.025
9A/9B 0.03 0.015
10A/10B 0.01 0.005
Table 1. Volume of Stock Solution for Standards
We labeled each volumetric flask before making the solutions in them. Using the appropriate sized
pipettes, we added the amount of stock necessary for the corresponding concentration forthe flask.
Then we diluted the stock until the solution reached the 500 mL mark on the flask. We used this
process for all of the concentrations except forthe last one. The volume of stock needed forthis
solution was too small for the pipettes we had. So, instead of making 500 mL, we made 1000 mL of
this solution. This allowedus to use twicethe amount of stockthat we had planned, whichwas
enough to be able to use our pipettes.
Concentration: 0.01 mg/L NO3 New Volume: 1000 mL New Stock Volume: 0.01 mL
Eachlab received three samples of each concentration, but wehad to randomize the labeling so the
lab operators could be blind to the actual concentrations of their samples (or notice patterns) . We
began by splitting each standard solution into two250 mL containers. Eachcontainer was labeled
with a letter and number. The letter identified whichlab the solution would be tested at, “A” for the
BIOR lab and “B” for the BAEG lab, and the number told the concentration of the solution.
We proceeded to make three sets of samples for each lab. The BIORlab received 60 mL samples
because each of those samples would be tested twice,once with Ion Chromatography and again
5. Mitchell, A. and A. Smith 5
with the Lachat. To label each set of samples, they all received an A or B depending on the lab they
were being sent to. The numbers or letters after the A or B were chosen randomly. Table 2 shows
the corresponding lab number foreach sample label.
For example, B90-12B wouldmean that B90 was the label for the sample container and 12B was
the lab number that indicates the sample’s concentration.
BIOR Lab (A) 3x60 mL BAEGLab (B) 3x20 mL
A5-1A AK-1A A49-1A B5-1B BK-1B B49-1B
A10-2A AR-2A A44-2A B10-2B BR-2B B44-2B
A4-3A AX-3A A48-3A B4-3B BX-3B B48-3B
A7-4A AF-4A A15-4A B7-4B BF-4B B15-4B
A8-5A AV-5A A29-5A B8-5B BV-5B B29-5B
A6-6A AJ-6A A14-6A B6-6B BJ-6B B14-6B
A9-7A AY-7A A38-7A B9-7B BY-7B B38-7B
A11-8A AM-8A A39-8A B11-8B BM-8B B39-8B
A2-9A AN-9A A19-9A B2-9B BN-9B B19-9B
A12-10A AU-10A A45-10A B12-10B BU-10B B45-10B
Table 2. Labeling Key for Standard Solutions
6. Mitchell, A. and A. Smith 6
2.1 Data Analysis
To evaluate the lab and method performances, wedecided to evaluate analytical abilities in two
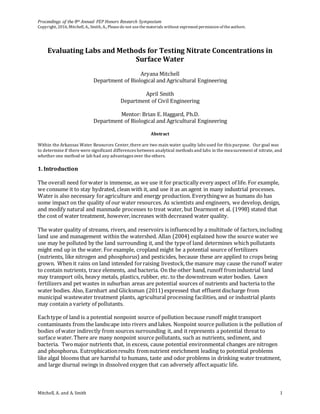
ways.Our first comparison used relative difference, whichshows the average percent difference
under- or overestimated by the instruments foreach standard solution; this is shown in Figure 1.
The green rectangle on the graph shows a range from +10% to -10%, whichwould be the
acceptable range followingstandard quality assurance and quality control protocolsfor standard
recovery during analysis. Estimates within this range would not be considered different from the
actual concentration value, or outside acceptable limits.
The nitrate-N concentrations measured using the Dionex IC and the Skalar wet-chemistry auto-
analyzer were within the acceptable limits (±10%) until standard concentrations were 0.08 mg/L
and below.When actual concentrations were less than 0.08 mg/L, these methods underestimated
the nitrate concentrations. The nitrate-N concentrations measured using the Lachat wet-chemistry
auto-analyzer were, on the other hand, within acceptable limits downto 0.01 mg/L standard
solution. This surprised us because the Lachat and the Skalar use similar methods to measure
nitrate in water samples, yet the Skalar performed similarly tothe Dionex IC in this test. Nitrate-N
concentrations measured using the Lachat wet-chemistry auto-analyzer were most accurate
relative to the lowerstandard solutions.
Figure 1. Relative Difference
-66.7
-66.7
-20.0
-8.3
-3.3
0.0
-0.3
0.5
1.1
5.1
-100.0
-22.2
-20.0
-4.2
0.0
-0.7
-11.0
-6.5
-5.3
-7.5
-66.7
0.0
0.0
0.0
-3.3
-2.0
-3.0
-2.7
4.6
1.1
-120
-110
-100
-90
-80
-70
-60
-50
-40
-30
-20
-10
0
10
20
0.01 0.03 0.05 0.08 0.1 0.5 1 2.5 5 10
RelativeDifference(%)
Standard Concentration (mg/L)
IC Dionex
Skalar
Lachat
7. Mitchell, A. and A. Smith 7
The second comparison used one way analysis of variance (ANOVA) withmeans separation
(Fisher’s Least Significant Difference,LSD) to show whichnitrate-N concentrations are different
from each other, as shown in Figure 2. This test compares the variation within and between the
results of each instrument to determine if there is a differencebetween lab results. If there is, the
letters labeling each lab are different from one another. As Figure 2 shows, the labs are labeled
using the letters “A”, “B”,and “C”.This does not mean that the method labeled with an “A” had
better results than the other two,it simply means that it had the highest average results of the
three.
As seen in Table 5, there were no differences in the lab results for standard concentrations 0.01
mg/L, 0.08 mg/L, 0.1 mg/L, 0.5 mg/L, and 5.0 mg/L. Eachlab produced significantly different
results from the other twoforthe standard concentrations of 0.03 mg/L, 1.0 mg/L, and 2.5 mg/L.
For the concentration of 10.0 mg/L, the nitrate-N concentrations from the Dionex IC and the Lachat
were not different, but the nitrate-N concentration from the Skalar were significantly less than both
of them.
Figure 2. One Way Mean Variance
3. Testingwith Environmental Samples
Our labs needed to be tested with more than our standards. The type of samples that are regularly
brought to these labs come from streams, ponds, and lakes. These will have many more nutrients
and microbial to process. We theorized that this couldinfluence the instruments’ performances.
8. Mitchell, A. and A. Smith 8
To test this theory, wetook samples from many local streams and lakes. We wanted to make sure
that these sources wouldgive us a good range in concentrations of nitrate, so we found a U.S.
Geological Survey report by Petersen et al. (2014) that had nitrate concentrations of local streams
and rivers from 2011. Table 3 (below)shows the locations that we decided to take samples from in
the are:
Location Reported [NO3-N]
Weddington Creek 2.9 mg/L
Cincinnati Creek 2.2 mg/L
Moores Creek 0.81 mg/L
Goose Creek 7.4 mg/L
Illinois River 0.17 mg/L
Mud Creek 0.79 mg/L
Table 3. Nitrate Concentrations in U.S. Geological Survey report by Petersen et al. (2014)
These concentrations gave a good range because they provide us withconcentrations that range
from high to low with more data points on the lower range. As said before, we wanted to test the
instruments with more samples that had less nitrogen because this is where we predicted the
differences in the lab methods would occur.
We also planned to take samples from lakes to be able to test the labs with samples that had
concentrations as low as the standards we tested them with. The labs were most inaccurate below
0.08 mg/L, so it was important to find sources with concentrations that low.We decided to take
samples fromLake Hamilton, Lake Ouachita, and Lake Catherine based on convenience.We also
tooksamples from a local unnamed stream that wepredicted would have a lower concentrationof
NO3-N.
At each site, we collectedabout 500 mL of water. This was a sufficientamount to split up between
the three instruments. We split up each sample into nine 60 mL containers. Three of these were
labeled with an “A” because they were sent to the BIOR Lab. The other three were sent to the BAEG
Lab so they were labeled with a “B.” Then, each container was randomly assigned a number to keep
the lab operators blind to any sort of pattern in the samples.
Site and Sample ID’s
Lake Hamilton A29 A43 A64 B63 B8 B100
Lake Ouachita A63 A7 A17 B24 B27 B1
Lake Catherine A37 A31 A33 B41 B97 B73
Weddington Creek A20 A9 A52 B81 B70 B91
Cincinnati Creek A58 A71 A95 B30 B87 B43
Moores Creek A39 A15 A96 B79 B75 B10
Goose Creek A66 A56 A23 B42 B21 B50
Illinois River A72 A97 A99 B3 B44 B59
Mud Creek A42 A92 A48 B96 B60 B71
Unnamed Forest Creek A3 A41 A22 B15 B55 B12
Beaver Lake A378 A554 A189 B274 B185 B357
Lake Weddington A277 A484 A148 B462 B439 B283
Table 4. Labeling Key for Environmental Samples
9. Mitchell, A. and A. Smith 9
When we got these results back, our data showed that there was a gap around 0.1 mg/L, so we
decided that we needed to take a couple more samples to try and hit that mark. Beaver Lake and
Lake Weddington were estimated to have a concentrationof around 0.1 mg/L by Dr. Thad Scott
(personal communication).These lakes went through the same process of sampling, labeling, and
distributing among the labs as the others.
To evaluate the labs using our environmental samples, we willnot be able test how closetheir
results were to the actual nitrate concentrations of the lakes and streams because there is no way
for us to know this. This data will be analyzed to see if there are any major differencesin the lab
results that wouldimply that any of the methodologies could not accurately read nitrate
concentrations within the threshold range determined before.
3.1 Data Analysis
As withthe standard solutions, we compared the lab results using one way analysis of variance
(ANOVA)with means separation (Fisher’s Least Significant Difference, LSD). Figure 3 shows the
average read concentration of our lake samples for each instrument and whether there were any
differences between them. The Dionex IC read a higher concentrationthan the other twolabs with
most of the samples, and had more significantly differentresults than the other twolabs. The graph
shows that there were no differences in the lab results forLake Catherine, but it looks like there
should be. This is because the Dionex IC had one extremely high reading. The amount of variation
within the Dionex IC’s data caused the results of the other twolabs to not have statistically different
results. In all of the lake samples, the Lachat and Skalar had no significantly different results from
one another.
Figure 3. Results for Lake Samples
0.55
0.01 0.01
0.18
0.17
0.39
0.00 0.00
0.19
0.18
0.39
0.00 0.00
0.18
0.16
0
0.1
0.2
0.3
0.4
0.5
0.6
Lake Catherine Lake Hamilton Lake Ouachita Beaver Lake Lake Weddington
MEANCONCENTRATION(MG/L)
IC Dionex
Lachat
Skalar
A
AA
AA
AA
AA
A
A
BBBB
10. Mitchell, A. and A. Smith 10
The stream samples show similar results to the lake samples. Figure 4 also shows the Dionex IC
generally estimating higher in concentrationreadings. Taking into accountthe stream as well as the
lake samples, the Dionex IC had significantly different results than the other twomethods in about
one third of our environmental samples. Once again, the Skalar and Lachat had no difference in
their results except forWeddington Creek. The Skalar had unusually high readings for this creek.
Figure 4. Results for Stream Samples
4. Conclusions
Recalling the ranges of nitrate concentrations weconsidered within the range important forwater
quality management, we have concludedthat either the BIOR lab or the BAEGlab can be used to
analyze water samples. For this range, each instrument read our standard solutions in an
acceptable range followingstandard quality assurance and quality control protocolsfor standard
recovery during analysis. However,nitrate-N concentrations measured using the Lachat wet-
chemistry auto-analyzer were most accurate relative to the lowerstandard solutions. Our
comparison of the standard and environmental results using one way analysis of variance (ANOVA)
with means separation did not imply that any of the methodologies could not accurately read
nitrate concentrations within the threshold range determined before. There were multiple times
where the labs had significantly different results, but that was also the case with the standard
solutions. The labs, although measuring the concentrationdifferently, were still within 10% of the
actual concentration value. Also, there is no possible way for us to have predetermined the nitrate
concentrations in our streams and lakes, so wecould not use that information in the analysis of the
lab results. Ultimately,the Skalar, Lachat, or Dionex IC can measure nitrate concentration values
accurately within our nitrogen threshold range.
5.00
0.35
6.08
3.52
2.51
0.55
5.20
4.80
0.32
5.89
3.36
2.43
0.52
5.01
4.74
0.37
6.00
3.48
2.41
0.51
5.91
0
1
2
3
4
5
6
7
Cincinnati Creek Unnamed Creek Goose Creek Illinois River Moores Creek Mud Creek Weddington Creek
MEANCONCENTRATION(MG/L)
IC Dionex
Lachat
Skalar
A
B
B
BB
BB
AB
A
A
A
A
A
A
A
A
A
AAA
B
11. Mitchell, A. and A. Smith 11
5. Future Projects/Work
As said before,nitrogen is not the only nutrient that couldbe a limiting factorto the growth of
algae. The water quality labs also test forphosphorus in water samples. There are different
instruments used forthis in the labs, but we couldgo through the same process of testing them as
we did with nitrogen. We would just have to use standards of various phosphorus concentrations
for the first test. The USGS report that we used to choose our environmental samples also measured
phosphorus levels so wewould be able to use that again to try and find streams with the desired
range of phosphorus concentrations.
7. References
Earnhart, D.H. and Robert L. Glicksman (2011). PollutionLimits andPolluters’Efforts to Comply,
Stanford University Press, Stanford, California.
Dionex Corporation (1998). DX-120IonChromatographOperator’s Manual,DionexCorporation,
Sunnyvale, California.
Petersen, J.C., B.G. Justus, and B.J. Meredith (2014). Effects of Land Use,Stream Habitat,andWater
Quality onBiologicalCommunities ofWadeableStreams inthe Illinois RiverBasinof Arkansas,
2011and 2012,U.S. Geological Survey,Reston, Virginia.
Dearmont, D., B. A. McCarl, D. A. Tolman (1998). “Costs of water treatment due to diminished water
quality: A case study in Texas”, Water Resources Research ANAGUJOURNAL, American
Geophysical Union, Vol. 34, No. 4, pp. 849-853
Evans-White, M.A., B.E. Haggard, and J.T.Scott (2012). “A Review of Stream Nutrient Criteria
Development in the United States”, Journalof EnvironmentalQuality,American Society of
Agronomy, Crop Science Society of America, and Soil Science Society of America, Madison,
WI, Periodical42, pp. 1002-1014
Kratzer, C.R. and PatrickL. Brezonik (1981). “A Carlson-Type Trophic State Index forNitrogen in
Florida Lakes”, JAWRA Journalof the AmericanWater Resources Association,AmericanWater
Resources Association, Vol. 17, No. 4, pp. 713-715
Nürnberg, G.K. (1996).“Trophic State of Clear and Colored, Soft-and Hardwater Lakes with Special
Consideration of Nutrients, Anoxia, Phytoplanktonand Fish”, Lake and Reservoir
Management,Taylor&Francis Group, Vol. 12, No. 4, pp. 432-447
Grimm, N.B. and Stuart G. Fisher (1986). “Nitrogen Limitation in a Sonoran Desert Stream”, Journal
of the NorthAmericanBenthologicalSociety,The University of Chicago Press, Vol. 5, No. 1,
pp. 2-15
Allan, J.D.(2004). “Landscapes and Riverscapes: The Influence of Land Use on Stream Ecosystems”,
Ecology,Evolution,andSystematics,Webof Science, Vol. 35, pp. 257-284