Advanced network modelling 2: connectivity measures, goup analysis
•
1 j'aime•1,471 vues

The 2013 edition of my contribution to the connectome course

Recommandé
Recommandé
Contenu connexe
Tendances
Tendances (20)
En vedette
En vedette (15)
Similaire à Advanced network modelling 2: connectivity measures, goup analysis
Similaire à Advanced network modelling 2: connectivity measures, goup analysis (20)
Plus de Gael Varoquaux
Plus de Gael Varoquaux (15)
Dernier
Dernier (20)
Advanced network modelling 2: connectivity measures, goup analysis
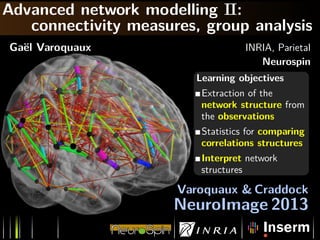
- 1. Advanced network modelling II: connectivity measures, group analysis Ga¨el Varoquaux INRIA, Parietal Neurospin Learning objectives Extraction of the network structure from the observations Statistics for comparing correlations structures Interpret network structures Varoquaux & Craddock NeuroImage 2013
- 2. Problem setting and vocabulary Given regions, infer and compare connections Graph: set of nodes and connections Weighted or not. Directed or not. Can be represented by an adjacency matrix. G Varoquaux 2
- 3. Functional network analysis: an outline 1 Signal extraction 2 Connectivity graphs 3 Comparing connections 4 Network-level summary G Varoquaux 3
- 4. 1 Signal extraction Enforcing specificity to neural signal [Fox 2005] G Varoquaux 4
- 5. 1 Choice of regions Too many regions gives harder statistical problem: ⇒ ∼ 30 ROIs for group-difference analysis Nearly-overlapping regions will mix signals Avoid too small regions ⇒ ∼ 10mm radius Capture different functional networks G Varoquaux 5
- 6. 1 Time-series extraction Extract ROI-average signal: weighted-mean with weights given by grey-matter probability Optional low-pass filter (≈ .1 Hz – .3 Hz) Regress out confounds: - movement parameters - CSF and white matter signals - Compcorr: data-driven noise identification [Behzadi 2007] - Global mean?... overhyped discussion (see later) G Varoquaux 6
- 7. 2 Connectivity graphs From correlations to connections Functional connectivity: correlation-based statistics G Varoquaux 7
- 8. 2 Correlation, covariance For x and y centered: covariance: cov(x, y) = 1 n i xiyi correlation: cor(x, y) = cov(x, y) std(x) std(y) Correlation is normalized: cor(x, y) ∈ [−1, 1] Quantify linear dependence between x and y Correlation matrix functional connectivity graphs [Bullmore1996,..., Eguiluz2005, Achard2006...] 1 G Varoquaux 8
- 9. 2 Partial correlation Remove the effect of z by regressing it out x/z = residuals of regression of x on z In a set of p signals, partial correlation: cor(xi/Z, xj/Z), Z = {xk, k = i, j} partial variance: var(xi/Z), Z = {xk, k = i} Partial correlation matrix [Marrelec2006, Fransson2008, ...] G Varoquaux 9
- 10. 2 Inverse covariance K = Matrix inverse of the covariance matrix On the diagonal: partial variance Off diagonal: scaled partial correlation Ki,j = −cor(xi/Z, xj/Z) std(xi/Z) std(xj/Z) Inverse covariance matrix [Smith 2010, Varoquaux NIPS 2010, ...] G Varoquaux 10
- 11. 2 Summary: observations and indirect effects Observations Correlation 0 1 2 3 4 + Variance: amount of observed signal Direct connections Partial correlation 0 1 2 3 4 + Partial variance innovation term G Varoquaux 11
- 12. 2 Summary: observations and indirect effects Observations Correlation Direct connections Partial correlation [Fransson 2008]: partial correlations highlight the backbone of the default mode G Varoquaux 11
- 13. 2 Summary: observations and indirect effects Observations Correlation Direct connections Partial correlation [Fransson 2008]: partial correlations highlight the backbone of the default mode Global signal regression Matters less on partial correlations CompCorr confounds Regressing out global signal Makes little difference with the choice of good confounds But unspecific, and can make the covariance matrix ill-conditioned G Varoquaux 11
- 14. 2 Inverse covariance and graphical model Gaussian graphical models Zeros in inverse covariance give conditional independence Σ−1 i,j = 0 ⇔ xi, xj independent conditionally on {xk, k = i, j} Robust to the Gaussian assumption G Varoquaux 12
- 15. 2 Inverse covariance matrix estimation p nodes, n observations (e.g. fMRI volumes) If not n p2 , ambiguities: 0 2 1 0 2 1 0 2 10 2 1 ? ? Thresholding partial correlations does not recover ground truth independence structure G Varoquaux 13
- 16. 2 Inverse covariance matrix estimation Sparse Inverse Covariance estimators: Independence between nodes makes estimation of partial correlation easier 0 1 2 3 4 Independence structure + 0 1 2 3 4 Connectivity values Joint estimation G Varoquaux 14
- 17. 2 Inverse covariance matrix estimation Sparse Inverse Covariance estimators: Independence between nodes makes estimation of partial correlation easier 0 1 2 3 4 Independence structure + 0 1 2 3 4 Connectivity values Joint estimation Group-sparse inverse covariance: learn different connectomes with same independence structure [Varoquaux, NIPS 2010] G Varoquaux 14
- 18. 3 Comparing connections Detecting and localizing differences G Varoquaux 15
- 19. 3 Comparing connections Detecting and localizing differences Learning sculpts the spontaneous activity of the resting human brain [Lewis 2009] Cor ...learn... cor differences G Varoquaux 15
- 20. 3 Pair-wise tests on correlations Correlations ∈ [−1, 1] ⇒ cannot apply Gaussian statistics, e.g. T tests Z-transform: Z = arctanh cor = 1 2 ln 1 + cor 1 − cor Z(cor) is normaly-distributed: For n observations, Z(cor) = N Z(cor), 1 √ n G Varoquaux 16
- 21. 3 Indirect effects: to partial or not to partial? 0 5 10 15 20 25 0 5 10 15 20 25 Control 0 5 10 15 20 25 0 5 10 15 20 25 Control 0 5 10 15 20 25 0 5 10 15 20 25 Control 0 5 10 15 20 25 0 5 10 15 20 25Large lesion Correlation matrices 0 5 10 15 20 25 0 5 10 15 20 25 Control 0 5 10 15 20 25 0 5 10 15 20 25 Control 0 5 10 15 20 25 0 5 10 15 20 25 Control 0 5 10 15 20 25 0 5 10 15 20 25Large lesion Partial correlation matrices Spread-out variability in correlation matrices Noise in partial-correlations Strong dependence between coefficients [Varoquaux MICCAI 2010] G Varoquaux 17
- 22. 3 Indirect effects versus noise: a trade off 0 5 10 15 20 25 0 5 10 15 20 25 Control 0 5 10 15 20 25 0 5 10 15 20 25 Control 0 5 10 15 20 25 0 5 10 15 20 25 Control 0 5 10 15 20 25 0 5 10 15 20 25Large lesion Correlation matrices 0 5 10 15 20 25 0 5 10 15 20 25 Control 0 5 10 15 20 25 0 5 10 15 20 25 Control 0 5 10 15 20 25 0 5 10 15 20 25 Control 0 5 10 15 20 25 0 5 10 15 20 25Large lesion Partial correlation matrices 0 5 10 15 20 25 0 5 10 15 20 25 Control 0 5 10 15 20 25 0 5 10 15 20 25 Control 0 5 10 15 20 25 0 5 10 15 20 25 Control 0 5 10 15 20 25 0 5 10 15 20 25Large lesion Tangent-space residuals [Varoquaux MICCAI 2010] G Varoquaux 18
- 23. 4 Network-level summary Comparing distributed network structure G Varoquaux 19
- 24. 4 Graph-theoretical analysis Summarize a graph by a few key metrics, expressing its transport properties [Bullmore & Sporns 2009] [Eguiluz 2005] Detect differences on metrics with permutation test Use a good graph (sparse inverse covariance) [Varoquaux NIPS 2010] Correlations are small-word by construction [Zalesky 2012]G Varoquaux 20
- 25. 4 Integration, within network and accross networks Network-wide activity Amount of signal in Σnetwork Determinant: |Σnetwork| = generalized variance Network integration: = log |ΣA| Cross-talk between network A and B Mutual information = log |ΣAB| − log |ΣA| − log |ΣB| [Marrelec 2008, Varoquaux NIPS 2010] G Varoquaux 21
- 26. Wrapping up: pitfalls Missing nodes Very-correlated nodes: e.g. nearly-overlapping regions Hub nodes give more noisy partial correlations G Varoquaux 22
- 27. Wrapping up: take home messages Regress confounds out from signals Inverse covariance to capture only direct effects Correlations cofluctuate ⇒ localization of differences is difficult 0 5 10 15 20 25 0 5 10 15 20 25 0 5 10 15 20 25 0 5 10 15 20 25 Networks are interesting units for comparison Slides on line http://gael-varoquaux.info
- 28. References (not exhaustive) [Achard 2006] A resilient, low-frequency, small-world human brain functional network with highly connected association cortical hubs, J Neurosci [Behzadi 2007] A component based noise correction method (CompCor) for BOLD and perfusion based fMRI, NeuroImage [Bullmore 2009] Complex brain networks: graph theoretical analysis of structural and functional systems, Nat Rev Neurosci [Eguiluz 2005] Scale-free brain functional networks, Phys Rev E [Frasson 2008] The precuneus/posterior cingulate cortex plays a pivotal role in the default mode network: Evidence from a partial correlation network analysis, NeuroImage [Fox 2005] The human brain is intrinsically organized into dynamic, anticorrelated functional networks, PNAS [Lewis 2009] Learning sculpts the spontaneous activity of the resting human brain, PNAS
- 29. References (not exhaustive) [Marrelec 2006] Partial correlation for functional brain interactivity investigation in functional MRI, NeuroImage [Marrelec 2007] Using partial correlation to enhance structural equation modeling of functional MRI data, Magn Res Im [Marrelec 2008] Regions, systems, and the brain: hierarchical measures of functional integration in fMRI, Med Im Analys [Smith 2010] Network Modelling Methods for fMRI, NeuroImage [Tononi 1994] A measure for brain complexity: relating functional segregation and integration in the nervous system, PNAS [Varoquaux MICCAI 2010] Detection of brain functional-connectivity difference in post-stroke patients using group-level covariance modeling, Med Imag Proc Comp Aided Intervention [Varoquaux NIPS 2010] Brain covariance selection: better individual functional connectivity models using population prior, Neural Inf Proc Sys
- 30. References (not exhaustive) [Varoquaux 2012] Markov models for fMRI correlation structure: is brain functional connectivity small world, or decomposable into networks?, J Physio Paris [Varoquaux 2013] Learning and comparing functional connectomes across subjects, NeuroImage [Zalesky 2012] On the use of correlation as a measure of network connectivity, NeuroImage