Pilot tool: Spatial analysis for investment targeting
•
4 j'aime•581 vues

Poster prepared May 2014
Recommandé

Recommandé
Contenu connexe
Tendances
Tendances (19)
En vedette
En vedette (8)
Similaire à Pilot tool: Spatial analysis for investment targeting
Similaire à Pilot tool: Spatial analysis for investment targeting (20)
Plus de ILRI
Plus de ILRI (20)
Pilot tool: Spatial analysis for investment targeting
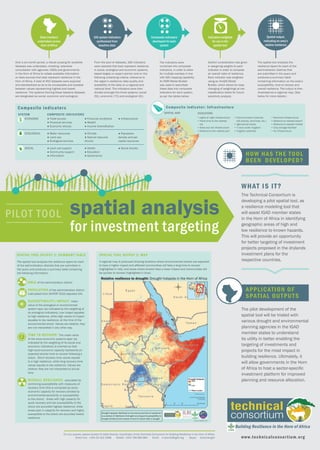
- 1. PILOT TOOL spatial analysis for investment targeting The Technical Consortium is developing a pilot spatial tool, as a resilience modeling tool that will assist IGAD member states in the Horn of Africa in identifying geographic areas of high and low resilience to known hazards. This will provide an opportunity for better targeting of investment projects proposed in the drylands investment plans for the respective countries. WHAT IS IT? HOW HAS THE TOOL BEEN DEVELOPED? Drought hotspots (likelihood of occurrence and lack of resilience) is a product of likelihood of drought occuring and susceptibility to drought divided by the inverse of time to revover after a drought. Relative resilience to drought: Drought hotspots in the Horn of Africa Data inventory undertaken across Horn of Africa 165 system indicators synthesised from baseline data Indicators weighted for use in the spatial tool Composite indicators developed for each system Spatial output, indicating an area’s relative resilience The spatial tool analyzes the resilience layers for each of the administration districts that are submitted in the query and produces a summary table containing information on the area’s susceptibility, time to recover and overall resilience. The output is then illustrated as a regional map. (See below for more details.) The pilot development of the spatial tool will be trialed with various drought and environmental planning agencies in the IGAD member states to understand its utility in better enabling the targeting of investments and projects for the most impact in building resilience. Ultimately, it will allow governments in the Horn of Africa to host a sector-specific investment platform for improved planning and resource allocation. Over a six-month period, a robust scoping for available datasets was undertaken, entailing extensive consultation with agencies, NGOs and governments in the Horn of Africa to collate available information on data sources that best represent resilience in the Horn of Africa. A total of 452 datasets were acquired and standardized so as to be comparable and scalable between values representing highest and lowest resilience. The systems framing these baseline datasets are designated as social, economic and ecological. From the pool of datasets, 165 indicators were selected that best represent resilience in social, ecological and economic systems, based largely on expert opinion and on the following underlying criteria: relevance to the region’s resilience; data quality and availability of the data on a regional and national level. The indicators were then divided amongst the three systems: social (51), economic (73) and ecological (41). Careful consideration was given in assigning weights to each indicator in order to compose an overall index of resilience. Each indicator was weighted using an ArcGIS Model Builder, which allows for easy changing of weightings at two classification levels for future sensitivity analysis. The indicators were combined into composite indicators, in order to allow for multiple overlays in line with GIS mapping capability. An ESRI Model Builder was used to assimilate these data into composite indicators for each system, as per the tables below: SYSTEM COMPOSITE INDICATORS ECONOMIC ● Trade access ● Financial services ● Economic shocks ● Financial conditions ● Wealth ● Income diversification ● Infrastructure ECOLOGICAL ● Water resources ● Land use ● Ecological services ● Climate ● Natural resource shocks ● Population density and per capita resources SOCIAL ● Land use support ● Community support ● Information ● Health ● Education ● Governance ● Social shocks Composite indicators AREA of the administration district POPULATION of the administration district (calculated from AfriPOP 2010 adjusted UN) SUSCEPTIBILIT Y/IMPACT: mean value of the ecological or environmental system layer (as indicated by the weighting of its ecological indicators). Low impact equates to high resilience, while high values of impact equates to low resilience, at the time of the environmental shock. Values are relative; they are not interpreted in any other way. TIME TO RECOVER: The mean value of the socio-economic systems layer (as indicated by the weighting of its social and economic indicators) is inverted so that high socio-economic capacity represents an expected shorter time to recover following a shock. Short recovery time values equate to a high resilience, while long recovery time values equate to low resilience. Values are relative; they are not interpreted to actual time. OVERALL RESILIENCE: calculated by combining susceptibility with measures of recovery time (this is computed as socio- economic capacity for recovery divided by environmental-sensitivity or susceptibility to the shock). Areas with high capacity for quick recovery and low susceptibility to the shock are accorded highest resilience; while areas poor in capacity for recovery and highly susceptible to the shock are accorded lowest resilience. APPLICATION OF SPATIAL OUTPUTS SPATIAL TOOL OUTPUT 1: SUMMARY TABLE TIME TO RECOVER: Building Resilience in the Horn of Africa For any queries, please contact Dr Katie Downie, Coordinator of the Technical Consortium for Building Resilience in the Horn of Africa. Direct line: +254 20 422 3066 Mobile: +254 708 985 664 Email: k.downie@cgiar.org Skype: kdowniengini www.technicalconsortium.org SPATIAL TOOL OUTPUT 2: MAP A regional map is produced showing locations where environmental shocks are expected to have a higher impact and affected communities will take a long time to recover (highlighted in red), and areas where shocks have a lower impact and communities will be quicker to recover (highlighted in blue). The spatial tool analyzes the resilience layers for each of the administration districts that are submitted in the query and produces a summary table containing the following information: • Lights at night infrastructure • Travel time to the nearest city • Road and rail infrastructure • Distance to the nearest port • Communication (internet, cell phones, land lines, etc.) • Agricultural inputs • % land under irrigation • Irrigation potential • Electrical infrastructure • Distance to nearest airport • Distance to nearest market • Crop storage facilities • Air infrastructure Composite indicator: Infrastructure INDICATORSSPATIAL MAP SOCIAL ECOLOGICAL ECONOMIC • Lights at night infrastructure • Travel time to the nearest city • Road and rail infrastructure • Distance to the nearest port