1. APPLICATION OF ROOT ANALYSIS TECHNIQUES IN
SPACECRAFT PROJECT MANAGEMENT
Deepti Lakshman, M.V.Kannan and H.Bhojraj
Programme Planning and Evaluation Group, ISRO Satellite Centre, Bangalore-560017, India
Abstract
Managing multiple and complex projects under one roof is a challenge within many
space agencies in the world. Too often, in these space organizations, projects
schedule runs on a critical path and ultimately slips from the baseline plan due to a
number of reasons. In a multi project environment, a spillover in one project activity
significantly affects the pace of the parallel and future projects which are directly or
indirectly depend on the same resources. In the wake of this, the space agencies are
actively involved in locating the factors that are negatively affecting the progress of
the project, but in the present scenario, the traditional methods and techniques are
proved to be less adequate. In the early 80s when the manufacturing firms were
looking for a technique to identify and remove the causes of defects and errors in the
manufacturing process, the concept of Six Sigma originated at Motorola. Six Sigma
makes use of DMAIC Methodology to systematically Define, Measure, Analyze,
Improve, and Control the manufacturing processes and eliminate defects. This paper
attempts to extend the benefits of the Root Cause Analysis (RCA) Techniques
from the Analytical phase of the DMAIC methodology to troubleshoot the causes of
spacecraft Project Schedule slippage. It illustrates the use of three key RCA
Techniques- WHY-WHY Technique, Cause & Effect Analysis and Pareto
Analysis for better understanding the parameters that are responsible for schedule
shift from estimated one in a space industry. The above three techniques are broadly
described to ensure their application in all the area of project management. In a
nutshell, this paper provides an insight into one of the challenging aspect of
Project Management: Identification of all the possible causes that may result
in Project Schedule Variance, using the RCA Techniques.
Keywords: Six Sigma, DMAIC methodology, Root Cause Analysis Techniques, WHY-
WHY Technique, Cause & Effect Analysis, Pareto Analysis, Schedule slippage
1. INTRODUCTION: continuing its pursuit towards enhancing
self-reliance in the area of
At the present juncture, Indian space telecommunication, broadcasting,
programme is flourishing rapidly and navigation, resource survey and
promoting the socio-economic management, cartography, weather
development of our nation. Today, the forecasting by developing state of art
Indian space programme has spread its technologies etc.
wings from Aryabatta, Bhaskara,Apple As the Indian space programme is
and sounding rockets to Satellite launch expanding its horizon, so are the number,
vehicles- Polar Satellite Launch complexity and the size of the projects
Vehicle(PSLV) and Geo-Synchronous increasing. The wide application of space
Satellite Launch Vehicle (GSLV), remote technology in the economic growth of the
sensing and communication satellites – country necessitates the adaptation of
Indian Remote sensing Satellite (IRS) & working in a multi project environment.
Indian National Satellite System(INSAT), Managing multi –dimension projects with
Space capsule Recovery experiment, the available resources, capability and
Chandrayaan-1-the first mission to our infrastructure is the greatest concern of
closest celestial body Moon and the future the Project Management Team (PMT) of
interplanetary mission including to that of the Indian Space Organizations. To
sending an Indian into space in the overcome the challenge of schedule
coming years. The space programme is deviation due to mid course change in
Page 1 of 14
2. Configuration/ scope, Inter-Project conflict from the six sigma tool kit. The DMAIC is
over resources, Communication deficit, a data-driven structured and logical tool
shifting Organizational Priorities etc, the for problem defining and decision making.
PMT should devise a methodology to This paper aims to spread the essence of
identify the root cause of the slippage DMAIC Methodology in the multiproject
from the baseline plan. The methodology environment of the Indian space
will help them to carefully review the organization. However, the primary
critical path of the project schedule and emphasis of this paper is on the Root
take pro-active approach for the forth Cause Analysis (RCA) Techniques of
coming projects in the organization. the Analytical phase of DMAIC
In the eighties when Motorola, seek to Methodology. This paper demonstrates
identify and remove the causes of defects the use of the three RCA Techniques –
in their manufacturing processes, the WHY-WHY Technique, Cause & Effect
concept of Six Sigma was invented. Six Analysis and Pareto Analysis to
Sigma was originally developed as a set of uncover the factors that contributes to
practices designed to improve spacecraft schedule delays. Although RCA
manufacturing processes and eliminate Techniques do not provide solution to a
defects, but its application was problem, but sets the foundation by
subsequently extended to other types of analytically and logically defining the root
business processes as well. The Six Sigma cause of a problem, to develop a concrete
Methodologies offers a wide range of and structured solution.
techniques and tools to improve the
Project management process. Although This paper has three main streams. The
every one of them may not be directly first is to highlight the challenges of
applicable to a project oriented project managements; the second is
organization but with some customization, introduce an overview of six sigma and
the key features can be embedded in the DMAIC methodology and third is to
Project management system. The DMAIC discuss the three root cause analysis
methodology where the acronym stands technique with illustrations of spacecraft
for Define, Measure, Analyze, Improve, projects.
and Control, is one such methodology
Lower Normal Distribution Centered Upper
Specification Specification
Limit Limit
68.27 %
95.45 %
0.001 PPM 0.001 PPM
99.9999998 %
Fig 1.1: Six Sigma limits with centered Normal distribution
Page 2 of 14
3. Lower Normal Distribution shifted 1.5σ Upper
Specification Specification
Limit Limit
Fig 1.2: Effect of 1.5 Sigma Shift in the Mean.
2. BASICS OF SIX SIGMA: 2.1SIX SIGMA-
DMAIC METHODOLOGY:
Six Sigma (the lower-case Greek letter σ)
is used to estimate standard deviation (a Six Sigma is a disciplined, data-driven
measure of variation) of a population. The approach for eliminating defects in any
six sigma scale of measure is perfectly process right from manufacturing to
correlated to such characteristics as service industries. Six Sigma improves the
defects per unit, part per million process performance, decreases variation
defectives. When a process is at a Six and maintains consistent quality of the
Sigma level of performance, it is believed process output. Six Sigma uses
that there will be practically very few methodologies for process performance
items that fail to meet the specifications improvement, reduction in
limits. defects/variation and help in maintaining
consistent quality of the process output.
A centered six-sigma process has a This is accomplished through the use of
normal distribution with mean=target and Six Sigma DMAIC Methodology. DMAIC
specifications placed six standard Methodology is based on W. Edwards
deviations to either side of the mean. At Deming's Plan-Do-Check-Act Cycle.
this point, the portions of the distribution
that are beyond the specifications contain
0.002 parts-per-million (ppm) of the data
(0.001 on each side) as shown in fig 1.1.
Practice has shown that most
manufacturing processes experience a
shift (due to drift over time) of 1.5
standard deviations so that the mean no
longer equals target. When this happens
in a six-sigma process, a larger portion of
the distribution now extends beyond the
specification limits: 3.4 parts-per-million
(ppm) as shown in Fig 1.2.
Fig 2.1: Plan-Do-Check-Act Cycle
Page 3 of 14
4. MODIFY
DEFINE MEASURE ANALYZE DESIGN NO
IMPROVE CONTROL
NO
YES
REDESIGN
Fig 2.2: DMAIC Methodology
2.2STAGES OF DMAIC METHODOLOGY activities involves in this phase are
mission analysis, feasibility studies,
The different stages of DMAIC technology needs analysis, analysis of
Methodology are explained by mapping it payload and spacecraft bus configuration
with the life cycle of a satellite Project. etc. Once the spacecraft configuration is
Broadly speaking, a Spacecraft project finalized the prime activities during
goes through four phases - Concept and planning phase are the identification of
Design Phase, Subsystems the team, defining the project
Fabrication Phase, Spacecraft deliverables, resources, finance &
Assembly and Integration Phase and Organizational Support required to
Pre and Post Launch Phases during its complete the project and estimating the
life cycle as shown in fig 3. The concept expected Project completion time etc.
and Design Phase begins with a feasibility Once a project is defined, one can
studies for mission as per the user methodically proceeds through
demand. Afterwards, payload and the Measurement, Analysis, Improvement,
mainframe spacecraft configuration will be and Control phase.
finalised.It is followed by the execution
phase comprising of hardware fabrication, Some of the key tools offered by the
testing and assembly/integration activities DMAIC methodology in this phase are
etc. The final phase consists of Pre- Project Charter
Launch, Launch, and Post launch activities Work/Product Breakdown Structure
carried out in the launch site and the Gantt chart
control centers. The phases are separated Network diagram
by major reviews which include Baseline
Design Reviews, Preliminary Design The spacecraft design finalization mark its
Reviews, Critical Design Reviews and transition from planning Phase to
Pre-shipment Review etc. execution phase. During this Phase the
The stages in the DMAIC methodology primary activities are detailed
will be discussed in the following text with identification and assignment of tasks
respect to its application in the life cycle based on spacecraft configuration, to
of a spacecraft project. respective subsystem groups/area. In this
phase the prototype models and
D - DEFINE: qualification testing validate the
The first stage in the DMAIC methodology spacecraft configuration. As the execution
focuses on concept and design phase of phase progress, groups across the
the spacecraft project. The primary organization become more actively
activity in this phase is to develop and involved in the fabrication of subsystem
define the project requirements w.r.t the packages. The functional behaviors of the
application and to design a plan for subsystem packages are tested in a
realization within constraints of time, simulated space environment. Finally it
resources, or cost. The pre-formulation will be delivered to Assembly and
Page 4 of 14
5. Integration team to complete its Some of the key tools used in this stage
integration with the spacecraft bus. are
The integrated spacecraft will then be Gantt chart
subjected to intensive environmental and Network Diagram
functional tests that include Open mode Project Milestone Summary
and closed mode Spacecraft level tests, Baseline Plan Vs Actual Execution
Thermovac tests, Dynamic tests, and post summary
dynamic tests etc. Once the tests and Project Deliverable checklist
reviews are completed the spacecraft will
be shipped to the launch site. A- ANALYZE:
Of the five stages in the DMAIC During the realization of a spacecraft
methodology, Measure, Analyze, project, there are numerous challenges
Improve, and Control is exceptionally and issues such as schedule slippage,
useful during the execution phase of the Budget over run, configuration changes
spacecraft project. These stages aid the that can arise to threaten the success of
project Management team in digging the project. The analytical stage of the
beneath the apparent causes of schedule DMAIC methodology analyzes the data
slippage. These stages are explained in recorded in the measurement stage to
brief in the following text. identify the root cause of the deviation
from the baseline plan. The techniques
M-MEASURE: available in this stage enable to explore
Once the project is underway, the actual all potential or real causes that result in
progress of the project needs to be the deviation of any of the Project
constantly monitored against the planned Performance parameter.
progress. The deliverable due dates, the
major milestone events, & budget The various Root Cause Analysis
expenditures, are the key project Techniques useful in this stage are
elements which are normally measured to Histogram
monitor the actual performance of the Pareto Chart
project. This stage of DMAIC is helpful in Time Series/Run Chart
collecting the relevant data to track the Regression Analysis
progress of the project. It records the Cause and Effect/Fishbone
variations between the actual and planned Diagram
performance of the project and the Why Tree Technique
estimated variance acts as an input to Process Map Review and Analysis
adjust or update the plan in order to get Statistical Analysis
the project back on track.
LIFE CYCLE-SPACECRAFT PROJECT
PRE LAUNCH
ASSEMBLY & & POST
TESTING LAUNCH
SUBSYTEM
FABRICATION
& TESTING
CONCEPT &
DESIGN
PLANNING EXECUTION COMPLETION
Fig 3
Page 5 of 14
6. I- IMPROVE : from other parallel projects are
Once the root causes are identified, and interchanged. Additional cost can arise
prioritized, corrective actions are outlined from such configuration changes, spill
and implemented in the system. This over task, repetitive component
stage pinpoints exactly what can be done procurements, uneconomic outsourcing
in the existing system to prevent the etc. Thus to have a complete control over
reoccurrence of the problem in future. the estimated plan, it is imperative to
Thus it mainly addresses the area that identify the elements responsible for the
contributed to the problem and variance. This can be achieved with the
determines the best actions to improve help of the various root cause analytical
the system. However, it is recognized that techniques available.
complete prevention of recurrence by a This paper focuses primarily on the
single intervention is not always possible. analytical phase of DMAIC methodology.
Thus, it is often considered to be an It offers an insight in to the concept of
iterative process, and is frequently viewed Root Cause Analysis. It mainly illustrates
as a tool of continuous improvement. three Root Cause analytical Techniques
viz WHY-WHY Technique, Cause &
Some of the tools helpful in this stage are Effect analysis, Pareto Analysis to
address the factors that contribute to
Action Priority Matrix variation in spacecraft project execution
Pareto Analysis from baseline plan.
RACI(Responsible-Accountable-
Consulted-Informed ) Matrix 2.2.1. A ROOT CAUSE ANALYIS (RCA):
Project Dashboard.
Decision Tree Root Cause Analysis is a class of
problem solving methods aimed at
C- CONTROL: identifying the root causes of problems or
Once improvement and implementation events. The practice of RCA is predicated
activity is underway, consideration must on the belief that problems are best
be given to the last step in the DMAIC solved by attempting to correct or
process, “Control”. To achieve excellence eliminate the root causes, as opposed to
in Project Management, adherence to the merely addressing the immediately
success critical factors such as schedule, obvious symptoms. The step by step
Budget, quality standard, etc is utmost process of identify the problem by a RCA
important. Reviewing of the project technique can helps the project
performance regularly and at the management team to address all the
stipulated review points will help to areas that has intervened the
sustain it in future. performance of the project and shifted it
Some of the key tools used in this phase from the estimated plan. RCA is
are considered to be a continuous
Tracking Gantt chart improvement tool in the field of quality
Resource Usage Analysis management. The three RCA techniques
Workload Analysis addressed in this paper are WHY-WHY
Earned Value Analysis Technique, Cause & Effect Analysis,
Cash Flow Analysis Pareto Analysis. None of this technique
is new to the statistical community;
however this paper is making an effort to
2.2.1 ANALYTICAL STAGE OF DMAIC introduce it as a strategic option and
METHODOLOGY effective decision-making/root cause
identification tool in the field of Project
Each spacecraft project will have a Management.
planned -Schedule, budget and scope. A
change in any one of above factor can The prerequisite of the RCA Technique is
adversely affect the other. For example to that there should be a Cross-Functional
recover a spacecraft Project which is Team (CFT) with people from different
running behind schedule, the project team functional expertise working toward a
sometimes change the configuration of common goal of identifying the root cause
the spacecraft in the middle of its life of the problem and recommending the
cycle, while sometimes the deliverables best solution. Information from all level of
Page 6 of 14
7. management and experience in the Illustration: To Illustrate the Concept of
project related area would provide a Why-WHY technique in spacecraft
greater visibility in to the problem and will Schedule management, a study on the
help to formulate a strategic, tactical, and realization of a high power
operational decision. The following article communication satellite with a lift off
discusses the three RCA techniques in mass of more a three tons was
brief with illustration. conducted.
2.2.1.A(i) WHY-WHY TECHNIQUE: At the superficial level, it was observed
that basic design change in battery
The WHY-WHY Technique, which was configuration, Priority Conflict amongst
made popular in the 1970s by the Toyota ongoing and parallel projects, non-
Production System is an easy and often- availability of TTC –RF
effective tool for uncovering the root of a system(communication system) and
Problem. This Technique is also known, as Power Electronics package on time and
WHY TREE TECHNIQUE amongst the the indigenization of systems such as heat
Quality Management Professionals. It is a pipe radiator panels, TXCO (temperature
simple tool where one can peel away the Controlled Crystal oscillator) for both
root cause of a problem by repeatedly transmitter and receivers and Inclusion of
asking the question "WHY”. Answer to the Programmable Auto temperature
first “WHY” will prompt another “WHY” controller in TMTC system has
and the answer to the second “WHY” will significantly influenced the schedule of the
prompt another and so on. Thus the project. To have a greater insight in to the
apparent reason for a problem will lead sources of schedule slippage and to
you to another question and finally to the identify the root cause, each cause is
root cause of the problem. thoroughly analyzed using the why tree
technique. For example, the mid course
HOW TO USE THE TOOL: changes in the battery configuration from
1. Write down the specific problem. 2 No of 125 Ah NiH2 batteries to 3 no of
Writing the issue helps in formalize 100Ah Li-ion hold considerably
the problem and describe it accountable for the slippage of the project
completely. It also helps the Cross from the baseline plan. The detailed
functional team to focus on the analysis reveals that the battery was
same problem. reconfigured in the midst of the
2. Ask WHY the problem happens and realization due to the non availability of
write the answer down below the the indigenous batteries during the
problem. assembly and integration phase of the
3. If the answer just provided doesn't project. Actually the indigenously
identify the root cause of the developed battery cells were subjected to
problem that one has wrote down excessive voltage during its qualification
in step 1, ask WHY again and write test which results into failure of battery
that answer down. cells. This failure reverted back battery to
4. Loop back to step 3 until the team its design stage and delayed its realization
is in agreement that the problem's cycle. The three battery configuration also
root cause is identified. Again, this called for the introduction of new Power
may take fewer or more times Electronic Packages, Battery Interface
than five WHYs. Modules and modification of the existing
power packages as well as the harness.
As an alternative option, procurement
Why- WHY technique is a kind of
process of battery from external vendor
brainstorming tool where cross-functional
was also initiated in parallel. However due
team will identify the events associated
to internal circuit failure in the battery
with a particular problem and ultimately
string during load testing, even external
discovers the actual cause of the event.
vendor could not delivered the battery on
For each event there can be sub event
time. Thus this design change in battery
and causes. This process should be
configuration adversely affected the pace
continued until the team reaches the root
of the project and setback its overall
cause of the event.
progress by around 9 months. Similarly all
the causes of the schedule drift are
Page 7 of 14
8. represented by Why Tree Technique in the
figure 4.
Spacecraft Project Schedule Slippage
WHY?
WHY? WHY? WHY? WHY?
Ongoing Parallel Non-availability of Change in Battery Indeginization
Projects subsystem on time Configuration from 2 No of of system
125 Ah NiH2 batteries to 3
No of 100Ah Li-ion WHY?
WHY? batteries
WHY?
Non-availability of
TTC-RF system Non-availability of Qualification
Power Electronics cycle
WHY?
WHY? WHY? Concept &
Introduction of new design
Vendor not able to finalization
Zener diode core power package &
TTC-RF package deliver battery on
failure during battery interface
diverted to time
card level test module
other project
WHY?
Waiting time to Non-availability of Battery during
share common Electrical indigenously developed load Testing
facility overstress battery cells
WHY?
Non-availability of
components /Component Cell failures String internal
list/fabrication details during circuit failure
during Fabrication Phase qualification
testing
Short circuit
Overcharging
Fig 4: Why Tree representation of causes of spacecraft schedule slippage
2.2.1.A(ii)CAUSE & EFFECT DIAGRAM: Chart, Flowchart And Scatter Diagram. It
is also known as a fishbone diagram
The second technique is the Cause & because of its shape, similar to the side
Effect Diagram. view of a fish skeleton. In quality
Cause & Effect diagram was originally Management, the user attempts to define
developed by Professor Kaoru ishikawa multiple possible causes for a given
who pioneered Quality management reason in the four areas of Manpower,
processes in the Kawasaki Shipyards and Methods, Material and Machines. Similarly
in the process become the one of the any delay in the execution of the satellite
founding fathers of Modern management. project could be found by systematic
Cause & effect diagram, which is often mapping of all the probable causes
referred to as an Ishikawa Diagram is influencing the project and its effect on
one of the seven basic tool of Quality the completion of the project using the
Management along with Histogram, fishbone diagram. For each cause we
Pareto Chart, Check Sheet, Control have to ask the question why? This will
Page 8 of 14
9. help to identify the sub-cause and finally design and integration etc. This was a
the root cause. unique project where scientists/ Engineers
Thus WHY-WHY Technique can be used as from the different sub-continents worked
a part of fishbone diagram to construct together to interface the scientific
the further bones of the fish. Once the instruments. Miniaturization of systems,
most probable causes are identified, one underestimation of the technical
can drill down to the root cause using the complexities, ad hoc task delegation to
WHY-WHY Technique. team member, lack of proper
communication all added up to delays in
How to construct a Fishbone Diagram: project.
1. First gather materials needed like All the major causes that resulted in
Flip Chart, OHP & transparencies or schedule slippage are categorized and
board for writing. represented in terms of a fish-bone
2. Call together the Cross Functional diagram shown in figure 5.
team. Thus, with the free flow of information
3. In the Flip chart, transparency or from the member of the team, it is
on the board draw a long arrow possible to organize the causes in an
horizontally across the middle orderly and logical manner as shown in fig
pointing to the right, and label the 5. This is a laborious process but the
arrowhead with the title of the benefit is an excellent understanding of a
issue to be explained. This is the complex problem in a simple way.
‘backbone’ of the ‘fish’.
4. Draw spurs coming off the So far we have seen that how the above
‘backbone’ at about 45 degrees, two techniques helps us to explore all
one for every likely cause of the potential or real causes that result in a
problem that the group can think defect or failure. Despite the fact that
of; and label each at its outer end. there will be multiple causes for a
Add sub-spurs to represent particular problem, we need to identify
subsidiary causes. Highlight any those whose removal can produce
causes that appear more than once significant overall effect on the
– they may be significant. performance of the project schedule.
5. Ideally, it is eventually re-drawn so There can be situation when a few causes
that position along the backbone will be responsible for the overall delay of
reflects the relative importance of the project. Even though the Cause &
the different parts of the problem, Effect Diagram and the Why Tree
with the most important at the Technique help to identify the root cause
head end. of the problem, they cannot provide the
information about the frequency of
occurrence of a particular cause. This can
Illustration: An evaluation of the be achieved by the Pareto Analysis.
execution of a technology
demonstrator maiden remote sensing
spacecraft project was conducted and 2.2.1. A (iii) Pareto Analysis:
the potential causes that had a huge
impact on project schedule are identified
using the cause and effect diagram. Pareto Analysis is used when there are
multiple causes for a problem and priority
Being a novel remote sensing mission, has to be set to attack the cause based on
there was a lot of complexity involved in their frequency of occurrence. The Pareto
realization of major sub-systems of the provides facts needed to prioritize the
project. Therefore the configuration and causes that are responsible for
design phase of the spacecraft has taken malfunctioning/problem in any system.
a major portion of the total project Pareto Analysis is based on the classical
lifespan attributable to the technology 80/20 rules. That is, when several factors
challenges in the areas of Data handling affect a situation, few factors will account
and transmission, data storage schemes, for most of the impact.
Communication system, Power handling
system, Bus management unit, thermal
Page 9 of 14
10. CAUSES
Multiple Projects Non-availability of
Data Handling System
on time to AIT
Backlog of other projects
ASIC failure during Environment Testing
Non-availability of components like FPGA &
Improper balancing of Fabrication details during Fabrication Phase
Resources
Non-availability of PCBs during Fabrication Phase
Single Person (Deputy Project
Director) identified for Multiple PCBs failure during New payload Interface standards
Projects manufacturing & data transfer protocols
Each Payload with different data EFFECT
Project Priority conflict rates
New Design
Schedule
Slippage
Delayed delivery of mould from Maiden Project/ New design
vendor due to failure in DIE
International collaboration
Miniaturization of systems
Fibre/matrix debonding Composite delamination Eg: Inertial Reference unit, Star sensor and
observed during vibration test Underestimation of the technical communication system
complexities in S/C Bus
Radial crack during thermal
cycling
Ad hoc task delegation to team
Change in Thermal Control Element Communication
(from white Paint to Germanium issue
coated Thermal Film & MLI blanket) Adaptation of new international space data protocols
Manufacturing of high performance Configuration
data transmission antenna finalization
Fig 5: CAUSE & EFFECT DIAGRAM (Fishbone Diagram) representation of causes of spacecraft schedule slippage
Page 10 of 14
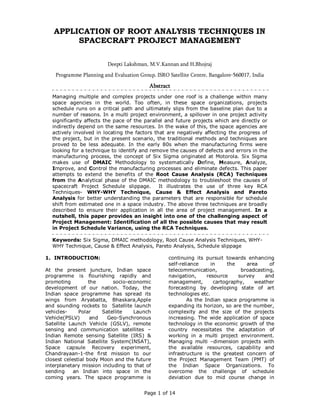
11. Steps to plot a Pareto Diagram:
PCB is the backbone of spacecraft
Form a table listing the causes and electronic system.Numerous numbers of
their frequency of occurrence as a PCBs are required in the assembly and
percentage. wiring of onboard electronics subsystem
Arrange the rows in the decreasing for all spacecraft projects. All of the PCB
order of importance of the causes, used for onboard electronics packages
i.e. the most important cause first. requires a high degree of quality and
Add a cumulative percentage reliability. Moreover, the complexity of
column to the table. PCB manufacturing has increased
Plot with causes on x-axis and dramatically over the last 3 decades
cumulative percentage on y-axis. progressing from straightforward double-
Join the above points to form a sided PCB to highly complex multi-layer
curve. PCBs with mixture of through hole,
Plot (on the same graph) a bar surface mount and chip on board
graph with causes on x-axis and configuration.Board layouts have
percent frequency on y-axis. consequently increased in density with
tighter tolerances and decreased distance
Illustration: The sub-causes of the between electrical contacts. With this
schedule delays are analyzed using the increase in complexity the possibility of
Pareto analysis technique in the following manufacturing defects has also
section. If we recall the examples consequently increased. Nevertheless,
discussed in the previous sections of this defects directly affect the form, fit,
paper, one of the causes of the Non- function and long-term performance of
availability of Data handling Package the PCB, which is the prerequisite of the
on time was Printed Circuit Board spacecraft electronic packages. Let us
(PCB) failure during manufacturing. further dig out the root cause of PCB
failures with the help of Pareto Analysis.
Cumulative
Total % Of total
Type of defects Cumulative. % of total
Sr.No defects defects
defect
a b c d=(c/116)*100 e
1 Board Delamination 40 40 34% 34%
Component
2 25 65 22% 56%
Misalignment
3 Cold solder Joint 16 81 14% 70%
4 Poor Die Bonding 13 94 11% 81%
5 Broken metal lines 12 106 10% 91%
Surface Contamination
6 by metal & ionic 10 116 9% 100%
residues
Table-1
11
12. PARETO CHART
50 120%
TO T A L N O . O F
40 100%
D EF E C T S
CU MM %
80%
30
60%
20
40%
10 20%
0 0%
M isalig n m en t
B roken m e tal
B on d in g
p oor D ie
D elam in a tion
Cold sold er
Co n tam in ation
Com p on en t
ion ic resid u es
b y m et al &
Join t
S u rface
B oard
lin es
TYPE OF DEFECTS
Total No. of Defects Cumm. %
Fig 6: Pareto Chart of PCB failure by reported causes
As Pareto Analysis is a statistical accounts for majority of the defectives
technique in problem solving, sample data PCB i.e. 40 No, followed by Component
on the most common sources of defects, Misalignment, and so on. Thus Pareto
the highest occurring type of defect is Diagram is an excellent tool for
collected and being plotted as shown in fig identification of root causes and its
6. frequency of occurrence during the
spacecraft subsystem realization phase.
The typical causes of PCB failures This technique based on statistical data
observed during the study were. will help the spacecraft subsystem group
to focus on the vital few causes that is
Board Delamination responsible for creating most of the issues
Component Misalignment and difficulties. Thus Pareto Analysis is a
Cold solder Joint powerful and effective tool in continuous
Poor Die Bonding improvement and problem solving to
Broken metal lines separate the ‘vital few’ from the ‘many
Surface Contamination by metal and other’ causes.
ionic residues
3. CONCLUSION&
All the defects that are responsible for the RECOMMENDATION:
total effect are arranged in a descending
order in table 1. This gives a clarity Juggling multiple projects, all competing
regarding the level of contribution of each for common resources, lack of priorities
defect. We can see in the Pareto diagram setting, project delays, changing external
that it is the Board Delamination that environment, growing technologies,
12
13. demands a proactive project management RCA offer simple but effective tools to
approach. Managing a balance between help in this effort.
the different ongoing projects within an To sum up, eventhough Six Sigma is now
organization and that too when they are a well established philosophy in
in their different phases of their life cycle manufacturing community, this paper
is indeed a great challenge to a project attempts to spread its root and help it to
Management team. The Six Sigma DMAIC grow in the project management
– Methodology can make some of these discipline also.
challenges little bit less daunting and help
to accomplish the estimated schedule,
cost reduction, process enhancement
milestones etc. The different stages of the ACKNOWLEDGEMENT
DMAIC – Methodology can be integrated
with the phases in the life cycle of the The authors would like to thank our
satellite project, and together they can Director, Dr.T.K Alex, for inspiring us to
strive for the improvement of the system. write this paper.
The Root Cause Analysis (RCA) techniques
discussed in this paper encourages a
REFERENCES
structured and systematic analysis of the
problem instead of jumping into a hasty
conclusion. The three techniques, WHY- [1] Forrest W Breyfogle,”Implementing six
WHY Technique, Cause & Effect sigma: Smarter solutions using statistical
analysis, Pareto Analysis can aid in methods”, John Wiley, New York,2003
conducting a rigorous analysis of the [2] Joglekar, Anand M,”Statistical
problems, in a structured and methodical methods for six sigma: In R & D and
way and not on Peer committees’ personal manufacturing”,John Wiley,New
preferences. York,2003
[3]D H Stamatis, “Six sigma
fundamentals: A complete guide to the
This paper shows how the three
system, methods and tools”, Productivity
techniques can be used to identify the
Press, New York, 2004
root causes of project schedule delays.
[4] Harold Kerzner, “Project
Out of the three techniques, the Why Tree
management: A systems approach to
technique is the simplest tools which
planning, scheduling and controlling”,Van
explore all potential causes of schedule
Nostrand Reinhold Company
slippage by repeatedly asking the
[5] Robert J Latino, “Root cause analysis:
question "Why”. The Cause-and-effect
Improving performance for bottom line
diagrams can reveal key relationships
result”, CRC Press, 1999
among various factors attributing to
project delays. Pareto analysis which is
statistical technique is used for selection
the few key causes from the trivial many
that produce significant overall effect in
the progress of the project. The above
three techniques can be used individually
or in combination to understand the root
causes.
There are various RCA methods available
other than the above three which can be
used for the analysis of the project
delays. But the basis of all the techniques
is systematic and structured approach to
uncover the root causes. In a multi-
project environment, there are numerous
factors that accounts for schedule
slippage, budget over run etc. In order to
address these issues, a high level of
understanding of factors is essential. The
13
14. Deepti Lakshman joined ISRO in December 2006. She holds a bachelor
degree in Industrial Engineer and pursuing her MBA in Operation
Management. She is working in Projects Division, PPEG. Her current role
includes Project Monitoring, Project life cycle evaluation, project planning
& Scheduling, Resource Planning, critical path analysis & System
Engineering.
M.V. Kannan joined ISRO Satellite Centre in November 1973 in
Structure after graduation in Science from Madras University and
Engineering in Aeronautic from Madras Institute of Technology (MIT),
Chennai. He was involved in Theoretical analysis, Experimental stress
analysis and load testing of spacecraft structures holding responsible
positions. He has contributed significantly for Stretched Rohini Satellite
Series, INSAT-3B and GSAT-1 as Deputy Project Director, Structures. He
is heading Projects Division, PPEG since 2003. He is also the Deputy
Project Director-Technical Services of Astronaut Training Centre, HSP.
His areas of interest are in Aerospace structural design, analysis and
testing, Multi-Project Management and Systems Engineering.
H. Bhojraj got his B.E. (Hons) in Mechanical Engineering from Madurai
University, Tamilnadu and joined ISRO on 1972. Presently he is Group
Director for Programme Planning and Evaluation Group, ISAC and also
additionally holding the post of Controller, ISRO Satellite Centre,
Bangalore. He worked in the area of Satellite Thermal Control System
and was responsible for fabrication and implementation of Thermal
Control System for Indian Satellites from Aryabhata to Chandrayaan I.
He played a key role in indigenisation of thermal control elements for
Satellite application. He got NRDC award for development of Rigid
Optical Solar Reflector (OSR) in 1990 and for flexible heater in 1999. He
has published more than 15 papers both in National and International
Journals.
14