Contenu connexe Similaire à TURKEY ECONOMIC INDICATORS Similaire à TURKEY ECONOMIC INDICATORS (20) 1. TURKEY
MAIN ECONOMIC INDICATORS
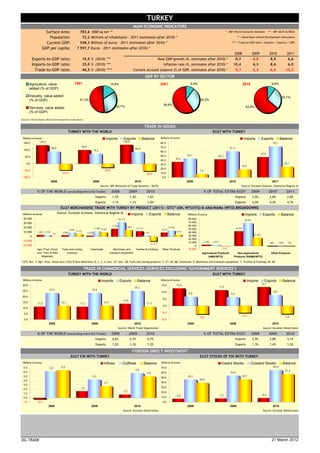
Surface Area: 783,6 1000 sq km ** * : IMF (World Economic Outlook) *** : IMF (DoTS & WEO)
Population: 72,2 Millions of inhabitants - 2011 (estimates after 2010) * ** : World Bank (World Development Indicatotrs)
Current GDP: 548,2 Billions of euros - 2011 (estimates after 2010) * **** : Trade-to-GDP ratio = (Exports + Imports) / GDP
GDP per capita: 7 597,7 Euros - 2011 (estimates after 2010) *
2008 2009 2010 2011
Exports-to-GDP ratio: 15,5 % (2010) *** Real GDP growth (%, estimates after 2010) * 0,7 -4,8 8,9 6,6
Imports-to-GDP ratio: 25,0 % (2010) *** Inflation rate (%, estimates after 2010) * 10,4 6,3 8,6 6,0
Trade-to-GDP ratio: 40,5 % (2010) **** Current account balance (% of GDP, estimates after 2010) * -5,7 -2,3 -6,6 -10,3
GDP BY SECTOR
Agriculture, value 1991 15,8% 2001 9,9% 2010 9,6%
added (% of GDP)
Industry, value added 26,7%
(% of GDP) 51,5% 30,2%
59,8%
Services, value added 32,7% 63,8%
(% of GDP)
Source: World Bank (World Development Indicators)
TRADE IN GOODS
TURKEY WITH THE WORLD EU27 WITH TURKEY
Billions of euros Imports Exports Balance Billions of euros Imports Exports Balance
135,5 138,9
150,0 80,0 72,7
99,8 70,0 61,3
89,5 85,9
100,0 73,2 60,0
47,6
50,0 44,1 42,3
50,0
36,2
40,0
0,0 30,0 25,1
18,9
20,0
-50,0 -26,6 7,9
-45,9 -52,9 10,0
-100,0 0,0
2008 2009 2010 2009 2010 2011
Source: IMF (Direction of Trade Statistics - DoTS) Source: Eurostat (Comext, Statistical Regime 4)
% OF THE WORLD (excluding Intra-EU Trade) 2008 2009 2010 % OF TOTAL EXTRA-EU27 2009 2010 2011
Imports 1,7% 1,5% 1,6% Imports 3,0% 2,8% 2,8%
Exports 1,1% 1,1% 1,0% Exports 4,0% 4,5% 4,7%
EU27 MERCHANDISE TRADE WITH TURKEY BY PRODUCT (2011) - SITC* (UN, WTO/ITS) & AMA/NAMA (WTO) BREAKDOWNS
Source: Eurostat (Comext, Statistical Regime 4) Imports Exports Balance
Millions of euros Millions of euros Imports Exports Balance
40 000 32 513 80 000 68 351
30 000 70 000
17 622 60 000
20 000 14 891 13 756
11 862 9 792 12 113 50 000 43 817
8 653 9 077
10 000 3 831 3 779 5 773 4 679
-52
2 880 2 070 2 101 40 000
30 000 24 534
0
20 000
-10 000 3 490 3 274
-10 012
10 000 286 1 039 753
-20 000 0
Agri. Prod. (Food Fuels and mining Chemicals Machinery and Textiles & Clothing Other Products -10 000 -216
(incl. Fish) & Raw products transport equipment Agricultural Products Non-Agricultural Other Products
Materials) (AMA/WTO) Products (NAMA/WTO)
* SITC Rev. 3: Agri. Prod. (Food (incl. Fish) & Raw Materials): 0, 1, 2, 4, excl. 27, excl. 28; Fuels and mining products: 3, 27, 28, 68; Chemicals: 5; Machinery and transport equipment: 7; Textiles & Clothing: 65, 84
TRADE IN COMMERCIAL SERVICES (SERVICES EXCLUDING "GOVERNMENT SERVICES")
TURKEY WITH THE WORLD EU27 WITH TURKEY
Billions of euros Imports Exports Balance Billions of euros Imports Exports Balance
12,8 13,7
30,0 15,0
25,2 11,5
25,0 23,4 23,4
10,0 8,0
6,8 6,4
20,0
5,0
13,9
15,0 11,3 12,1 11,1 12,2 11,3
0,0
10,0
5,0 -5,0
-6,0 -5,0 -5,8
0,0 -10,0
2008 2009 2010 2008 2009 2010
Source: World Trade Organisation Source: Eurostat (NewCronos)
% OF THE WORLD (excluding Intra-EU Trade) 2008 2009 2010 % OF TOTAL EXTRA-EU27 2008 2009 2010
Imports 0,6% 0,7% 0,7% Imports 2,9% 2,8% 3,1%
Exports 1,2% 1,3% 1,2% Exports 1,3% 1,4% 1,5%
FOREIGN DIRECT INVESTMENT
EU27 FDI WITH TURKEY EU27 STOCKS OF FDI WITH TURKEY
Billions of euros Inflows Outflows Balance Billions of euros Inward Stocks Outward Stocks Balance
7,0 6,2 6,5 70,0 65,5
5,8 57,3
6,0 5,0 60,0 54,0
5,0 4,3 46,1 46,7
50,0
4,0 39,6
2,7 40,0
3,0
1,5 30,0
2,0
0,7 20,0
1,0
6,5 7,3 8,2
0,0 10,0
-1,0 -0,3 0,0
2008 2009 2010 2008 2009 2010
Source: Eurostat (NewCronos) Source: Eurostat (NewCronos)
DG TRADE 21 March 2012
2. TURKEY 21-Mar-12
EU BILATERAL TRADE AND TRADE WITH THE WORLD DG TRADE
TOTAL MERCHANDISE TRADE, 2007-2011
1. Evolution of the EU's Trade Balance with Turkey
2. Evolution of the Turkey's Trade Balance
GEOGRAPHIC BREAKDOWN OF TRADE, 2011
3. EU Trade with Main Partners
4. Turkey's Trade with Main Partners
SECTORAL BREAKDOWN OF TRADE
SITC Rev.3 & AMA/NAMA Product Groups
5. European Union, Trade with the World and Turkey, by Sitc Section
6. European Union Imports, by Product Grouping
7. European Union Exports, by Product Grouping
8. Rank of Turkey in European Union Trade
Harmonized System, Sections
9. EU Trade with the World and EU Trade with Turkey (2011)
3. EU'S TRADE BALANCE WITH TURKEY
European Union, Trade with Turkey millions of euro, %
Share of total Share of total
Variation Variation
Period Imports EU Imports Exports EU Exports Balance Trade
(%, y-o-y) (%, y-o-y)
(%) (%)
2007 47 028 12,7 3,3 52 650 5,2 4,2 5 621 99 678
2008 45 960 -2,3 2,9 54 093 2,7 4,1 8 133 100 053
2009 36 197 -21,2 3,0 44 101 -18,5 4,0 7 903 80 298
2010 42 323 16,9 2,8 61 253 38,9 4,5 18 930 103 577
2011 47 588 12,4 2,8 72 588 18,5 4,7 24 999 120 176
2011Q1 12 461 - 3,0 18 590 - 5,1 6 129 31 052
2011Q2 12 186 - 2,9 19 230 - 5,1 7 044 31 417
2011Q3 11 271 - 2,7 17 597 - 4,6 6 325 28 868
2011Q4 11 670 - 2,8 17 170 - 4,3 5 501 28 840
2012Q1 - - - - - - - -
2012Q2 - - - - - - - -
2012Q3 - - - - - - - -
2012Q4 - - - - - - - -
Average annual growth (2007-2011) 0,3 8,4 4,8
80 000
70 000
60 000
50 000
40 000
30 000
20 000
10 000
0
2007 2008 2009 2010 2011
Imports Exports Balance
European Union, Trade with the World millions of euro, %
Variation Variation
Period Imports Exports Balance Trade
(%, y-o-y) (%, y-o-y)
2007 1 435 083 6,1 1 240 984 7,0 -194 099 2 676 067
2008 1 566 379 9,1 1 309 218 5,5 -257 161 2 875 597
2009 1 207 814 -22,9 1 098 066 -16,1 -109 748 2 305 880
2010 1 509 092 24,9 1 349 610 22,9 -159 482 2 858 702
2011 1 683 931 11,6 1 531 122 13,4 -152 809 3 215 053
2011Q1 419 185 - 366 024 - -53 161 785 210
2011Q2 420 281 - 377 464 - -42 816 797 745
2011Q3 423 142 - 383 708 - -39 434 806 850
2011Q4 421 323 - 403 926 - -17 398 825 249
2012Q1 - - - - - -
2012Q2 - - - - - -
2012Q3 - - - - - -
2012Q4 - - - - - -
Average annual growth (2007-2011) 4,1 5,4 4,7
2 000 000
1 500 000
1 000 000
500 000
0
-500 000
2007 2008 2009 2010 2011
Imports Exports Balance
Source: EUROSTAT (Comext, Statistical regime 4) TRADE A2 - CG/MP
World excluding Intra-EU27 trade; European Union: 27 members. 21-Mar-12
4. TURKEY'S TRADE BALANCE
TURKEY, Trade with the European Union millions of euro, %
EU Share of EU Share of
Variation Variation
Period Imports total Imports Exports total Exports Balance Trade
(%, y-o-y) (%, y-o-y)
(%) (%)
2007 49 910 5,8 40,8 43 974 15,4 56,8 -5 937 93 884
2008 50 559 1,3 37,3 42 916 -2,4 47,9 -7 643 93 475
2009 40 432 -20,0 40,5 33 585 -21,7 45,9 -6 848 74 017
2010 54 610 35,1 39,3 39 754 18,4 46,3 -14 855 94 364
2011 - - - - - - - -
2011Q1 15 381 - 37,9 11 086 - 48,3 -4 295 26 468
2011Q2 17 774 - 40,5 11 391 - 48,1 -6 383 29 165
2011Q3 - - - - - - - -
2011Q4 - - - - - - - -
2012Q1 - - - - - - - -
2012Q2 - - - - - - - -
2012Q3 - - - - - - - -
2012Q4 - - - - - - - -
Average annual growth (2007-2011) - - -
60 000
50 000
40 000
30 000
20 000
10 000
0
-10 000
-20 000
2007 2008 2009 2010 2011
Imports Exports Balance
TURKEY, Trade with the World millions of euro, %
Variation Variation
Period Imports Exports Balance Trade
(%, y-o-y) (%, y-o-y)
2007 122 266 11,6 77 459 14,5 -44 807 199 725
2008 135 458 10,8 89 521 15,6 -45 936 224 979
2009 99 807 -26,3 73 178 -18,3 -26 630 172 985
2010 138 894 39,2 85 949 17,5 -52 945 224 844
2011 - - - - - -
2011Q1 40 620 - 22 936 - -17 683 63 556
2011Q2 43 865 - 23 679 - -20 186 67 545
2011Q3 - - - - - -
2011Q4 - - - - - -
2012Q1 - - - - - -
2012Q2 - - - - - -
2012Q3 - - - - - -
2012Q4 - - - - - -
Average annual growth (2007-2011) - - -
150 000
100 000
50 000
0
-50 000
-100 000
2007 2008 2009 2010 2011
Imports Exports Balance
Source: IMF (DoTS) TRADE A2 - CG/MP
21-Mar-12
5. EU TRADE WITH MAIN PARTNERS (2011)
The Major Imports Partners The Major Exports Partners The Major Trade Partners
Rk Partners Mio euro % Rk Partners Mio euro % Rk Partners Mio euro %
Extra EU27 1 683 931,0 100,0% Extra EU27 1 531 122,0 100,0% Extra EU27 3 215 053,0 100,0%
1 China 292 070,9 17,3% 1 United States 260 566,8 17,0% 1 United States 444 708,0 13,8%
2 Russia 198 178,2 11,8% 2 China 136 216,9 8,9% 2 China 428 287,8 13,3%
3 United States 184 141,2 10,9% 3 Switzerland 121 690,6 7,9% 3 Russia 306 627,1 9,5%
4 Norway 93 528,7 5,6% 4 Russia 108 448,9 7,1% 4 Switzerland 212 894,7 6,6%
5 Switzerland 91 204,1 5,4% 5 Turkey 72 587,6 4,7% 5 Norway 140 059,6 4,4%
6 Japan 67 444,8 4,0% 6 Japan 48 970,3 3,2% 6 Turkey 120 176,0 3,7%
7 Turkey 47 588,4 2,8% 7 Norway 46 531,0 3,0% 7 Japan 116 415,1 3,6%
8 India 39 256,9 2,3% 8 India 40 419,4 2,6% 8 India 79 676,2 2,5%
9 Brazil 37 751,6 2,2% 9 Brazil 35 729,7 2,3% 9 Brazil 73 481,3 2,3%
10 South Korea 36 057,0 2,1% 10 United Arab Emirate 32 614,2 2,1% 10 South Korea 68 475,6 2,1%
11 Saudi Arabia 27 933,3 1,7% 11 South Korea 32 418,5 2,1% 11 Saudi Arabia 54 328,8 1,7%
12 Algeria 27 534,4 1,6% 12 Australia 30 804,9 2,0% 12 Canada 52 459,6 1,6%
13 Nigeria 24 190,0 1,4% 13 Hong Kong 30 189,6 2,0% 13 Singapore 46 068,8 1,4%
14 Taiwan 23 917,1 1,4% 14 Canada 29 607,2 1,9% 14 Algeria 44 739,0 1,4%
15 Canada 22 852,4 1,4% 15 Singapore 27 131,3 1,8% 15 South Africa 43 412,9 1,4%
16 Kazakhstan 22 672,7 1,3% 16 Saudi Arabia 26 395,5 1,7% 16 Australia 42 559,7 1,3%
17 Malaysia 20 988,0 1,2% 17 South Africa 25 639,0 1,7% 17 United Arab Emirate 41 384,3 1,3%
18 Singapore 18 937,5 1,1% 18 Mexico 23 802,6 1,6% 18 Hong Kong 40 322,4 1,3%
19 South Africa 17 774,0 1,1% 19 Ukraine 21 197,0 1,4% 19 Taiwan 40 124,2 1,2%
20 Thailand 17 534,2 1,0% 20 Algeria 17 204,7 1,1% 20 Mexico 40 071,8 1,2%
21 Mexico 16 269,1 1,0% 21 Israel 16 835,9 1,1% 21 Nigeria 36 691,1 1,1%
22 Indonesia 16 152,5 1,0% 22 Taiwan 16 207,1 1,1% 22 Ukraine 36 172,3 1,1%
23 Iran 15 887,6 0,9% 23 Morocco 15 168,0 1,0% 23 Malaysia 32 903,0 1,0%
24 Ukraine 14 975,3 0,9% 24 Egypt 13 904,4 0,9% 24 Israel 29 476,2 0,9%
25 Azerbaijan 14 785,5 0,9% 25 Nigeria 12 501,0 0,8% 25 Thailand 29 393,5 0,9%
26 Qatar 13 299,6 0,8% 26 Malaysia 11 915,0 0,8% 26 Kazakhstan 28 672,5 0,9%
27 Vietnam 12 800,3 0,8% 27 Thailand 11 859,3 0,8% 27 Iran 26 376,5 0,8%
28 Israel 12 640,3 0,8% 28 Croatia 11 300,9 0,7% 28 Morocco 23 853,3 0,7%
29 Australia 11 754,8 0,7% 29 Tunisia 10 928,9 0,7% 29 Indonesia 23 502,4 0,7%
30 Chile 10 866,8 0,6% 30 Iran 10 488,9 0,7% 30 Egypt 23 326,7 0,7%
31 Argentina 10 659,9 0,6% 31 Serbia 8 486,6 0,6% 31 Tunisia 20 798,0 0,6%
32 Libya 10 406,0 0,6% 32 Argentina 8 322,1 0,5% 32 Argentina 18 982,1 0,6%
33 Hong Kong 10 132,8 0,6% 33 Gibraltar 7 836,2 0,5% 33 Chile 18 518,2 0,6%
34 Tunisia 9 869,2 0,6% 34 Chile 7 651,4 0,5% 34 Qatar 18 185,0 0,6%
35 Iraq 9 469,6 0,6% 35 Indonesia 7 349,9 0,5% 35 Vietnam 18 009,4 0,6%
36 Egypt 9 422,3 0,6% 36 Belarus 7 218,0 0,5% 36 Azerbaijan 17 647,9 0,5%
37 United Arab Emirate 8 770,1 0,5% 37 Kazakhstan 5 999,8 0,4% 37 Croatia 16 905,0 0,5%
38 Morocco 8 685,3 0,5% 38 Lebanon 5 236,2 0,3% 38 Iraq 13 353,2 0,4%
39 Bangladesh 8 584,9 0,5% 39 Vietnam 5 209,1 0,3% 39 Serbia 13 202,6 0,4%
40 Colombia 6 897,5 0,4% 40 Colombia 4 986,1 0,3% 40 Libya 12 472,2 0,4%
41 Angola 6 651,3 0,4% 41 Qatar 4 885,5 0,3% 41 Colombia 11 883,6 0,4%
42 Peru 6 339,3 0,4% 42 Venezuela 4 879,9 0,3% 42 Angola 11 504,7 0,4%
43 Costa Rica 5 986,9 0,4% 43 Angola 4 853,5 0,3% 43 Belarus 11 437,4 0,4%
44 Croatia 5 604,1 0,3% 44 Philippines 3 978,8 0,3% 44 Bangladesh 10 286,6 0,3%
45 Philippines 5 091,0 0,3% 45 Iraq 3 883,6 0,3% 45 Peru 9 148,0 0,3%
46 Kuwait 4 791,7 0,3% 46 Pakistan 3 740,7 0,2% 46 Philippines 9 069,8 0,3%
47 Serbia 4 716,0 0,3% 47 Kuwait 3 706,8 0,2% 47 Venezuela 8 966,2 0,3%
48 Pakistan 4 565,9 0,3% 48 Bosnia-Herzegovina 3 535,1 0,2% 48 Kuwait 8 498,5 0,3%
49 Belarus 4 219,4 0,3% 49 New Zealand 3 463,6 0,2% 49 Pakistan 8 306,6 0,3%
50 Equatorial Guinea 4 116,3 0,2% 50 Jordan 3 250,3 0,2% 50 Gibraltar 8 053,7 0,3%
- 0,0 0,0% - 0,0 0,0% - 0,0 0,0%
EU Imports from … EU Exports to … Imports + Exports
Partner regions Mio euro % Partner regions Mio euro % Partner regions Mio euro %
ACP 86 277,8 5,1% ACP 80 197,0 5,2% ACP 166 474,8 5,2%
Andean Community 15 906,9 0,9% Andean Community 9 652,0 0,6% Andean Community 25 558,9 0,8%
ASEAN 93 203,4 5,5% ASEAN 68 458,5 4,5% ASEAN 161 661,9 5,0%
BRIC 567 257,6 33,7% BRIC 320 814,8 21,0% BRIC 888 072,4 27,6%
CACM 8 274,5 0,5% CACM 4 335,2 0,3% CACM 12 609,7 0,4%
Candidate Countries 55 324,2 3,3% Candidate Countries 86 723,0 5,7% Candidate Countries 142 047,2 4,4%
CIS 257 570,0 15,3% CIS 152 602,0 10,0% CIS 410 172,0 12,8%
EFTA 188 650,8 11,2% EFTA 171 141,9 11,2% EFTA 359 792,7 11,2%
Latin American Coun 106 354,4 6,3% Latin American Coun 96 141,4 6,3% Latin American Coun 202 495,9 6,3%
MEDA (excl EU and T 71 958,9 4,3% MEDA (excl EU and T 85 634,8 5,6% MEDA (excl EU and T 157 593,7 4,9%
Mercosur 50 950,8 3,0% Mercosur 45 820,2 3,0% Mercosur 96 771,0 3,0%
NAFTA 223 262,7 13,3% NAFTA 313 976,6 20,5% NAFTA 537 239,3 16,7%
EFTA: Iceland, Liechtenstein, Norway, Switzerland; Candidates: Croatia, FYR of Macedonia, Turkey; Andean Community: Bolivia, Colombia, Ecuador, Peru;
CIS: Armenia, Azerbaijan, Belarus, Georgia, Kyrgyzstan, Kazakhstan, Moldova Republic of, Russian Federation, Tajikistan, Turkmenistan, Ukraine, Uzbekistan;
CACM: Honduras, El Salvador, Nicaragua, Costa Rica, Guatemala, Panama; Mercosur: Argentina, Brazil, Paraguay, Uruguay; NAFTA: Canada, Mexico, United States;
Latin America Countries: CACM, Mercosur, ANCOM, Chile, Cuba, Dominican Republic, Haiti, Mexico, Panama, Venezuela; BRIC: Brazil, Russia, India, China;
ASEAN: Brunei Darussalam, Indonesia, Cambodia, Lao People's Democratic Republic, Myanmar, Malaysia, Philippines, Singapore, Thailand, Vietnam;
ACP: 79 countries; MEDA (excl EU & Turkey): Algeria, Egypt, Israel, Jordan, Lebanon, Morocco, Occupied Palestinian Territory, Syrian Arab Republic, Tunisia.
Source: EUROSTAT (Comext, Statistical regime 4) DG TRADE
European Union: 27 members. 21-Mar-12
6. TURKEY'S TRADE WITH MAIN PARTNERS (2010)
The Major Imports Partners The Major Export Partners The Major Trade Partners
Rk Partners Mio euro % Rk Partners Mio euro % Rk Partners Mio euro %
World (all countrie 138 894,2 100,0% World (all countrie 85 949,4 100,0% World (all countrie 224 843,7 100,0%
1 EU27 54 609,7 39,3% 1 EU27 39 754,5 46,3% 1 EU27 94 364,1 42,0%
2 Russia 16 290,8 11,7% 2 Iraq 4 564,0 5,3% 2 Russia 19 788,3 8,8%
3 China 12 999,0 9,4% 3 Russia 3 497,5 4,1% 3 China 14 715,2 6,5%
4 United States 9 338,2 6,7% 4 United States 2 906,2 3,4% 4 United States 12 244,4 5,4%
5 Iran 5 791,1 4,2% 5 United Arab Emirate 2 522,1 2,9% 5 Iran 8 091,5 3,6%
6 South Korea 3 608,9 2,6% 6 Iran 2 300,3 2,7% 6 Iraq 5 586,3 2,5%
7 Ukraine 2 903,5 2,1% 7 China 1 716,2 2,0% 7 Switzerland 3 976,5 1,8%
8 India 2 585,8 1,9% 8 Egypt 1 698,9 2,0% 8 Ukraine 3 853,2 1,7%
9 Japan 2 495,7 1,8% 9 Saudi Arabia 1 683,7 2,0% 9 South Korea 3 838,1 1,7%
10 Switzerland 2 389,3 1,7% 10 Switzerland 1 587,2 1,8% 10 Saudi Arabia 3 529,1 1,6%
11 Kazakhstan 1 859,9 1,3% 11 Israel 1 569,3 1,8% 11 United Arab Emirate 3 049,3 1,4%
12 Saudi Arabia 1 845,3 1,3% 12 Libya 1 464,4 1,7% 12 India 3 043,8 1,4%
13 Algeria 1 711,5 1,2% 13 Syria 1 391,9 1,6% 13 Algeria 2 845,6 1,3%
14 Indonesia 1 117,1 0,8% 14 Azerbaijan 1 173,1 1,4% 14 Japan 2 700,9 1,2%
15 Israel 1 033,2 0,7% 15 Algeria 1 134,1 1,3% 15 Israel 2 602,4 1,2%
16 Iraq 1 022,3 0,7% 16 Ukraine 949,6 1,1% 16 Kazakhstan 2 480,4 1,1%
17 Brazil 1 019,6 0,7% 17 Turkmenistan 861,4 1,0% 17 Egypt 2 399,0 1,1%
18 Thailand 967,0 0,7% 18 Kazakhstan 620,5 0,7% 18 Syria 1 898,7 0,8%
19 Malaysia 849,9 0,6% 19 Georgia 582,6 0,7% 19 Azerbaijan 1 826,7 0,8%
20 Egypt 700,1 0,5% 20 Tunisia 539,0 0,6% 20 Libya 1 791,1 0,8%
21 Canada 691,4 0,5% 21 Morocco 469,8 0,5% 21 Brazil 1 485,9 0,7%
22 South Africa 677,5 0,5% 22 Brazil 466,3 0,5% 22 Indonesia 1 306,4 0,6%
23 Azerbaijan 653,6 0,5% 23 Lebanon 466,2 0,5% 23 Turkmenistan 1 152,9 0,5%
24 Uzbekistan 652,4 0,5% 24 India 458,0 0,5% 24 Thailand 1 134,0 0,5%
25 Bangladesh 640,9 0,5% 25 Singapore 447,8 0,5% 25 Canada 1 052,7 0,5%
26 Norway 619,7 0,4% 26 Jordan 434,0 0,5% 26 Malaysia 1 020,9 0,5%
27 Pakistan 567,7 0,4% 27 Canada 361,3 0,4% 27 South Africa 958,4 0,4%
28 Vietnam 566,4 0,4% 28 Kuwait 302,7 0,4% 28 Norway 879,7 0,4%
29 United Arab Emirate 527,2 0,4% 29 South Africa 280,9 0,3% 29 Uzbekistan 866,0 0,4%
30 Syria 506,8 0,4% 30 Norway 260,0 0,3% 30 Georgia 802,6 0,4%
31 Nigeria 450,2 0,3% 31 Australia 253,5 0,3% 31 Morocco 770,8 0,3%
32 Mexico 373,9 0,3% 32 Yemen 250,6 0,3% 32 Bangladesh 769,8 0,3%
33 Australia 337,2 0,2% 33 Serbia 230,9 0,3% 33 Pakistan 753,6 0,3%
34 Libya 326,6 0,2% 34 South Korea 229,2 0,3% 34 Tunisia 750,8 0,3%
35 Morocco 300,9 0,2% 35 Kosovo 222,5 0,3% 35 Vietnam 646,2 0,3%
36 Turkmenistan 291,5 0,2% 36 Uzbekistan 213,5 0,2% 36 Nigeria 640,1 0,3%
37 Chile 235,6 0,2% 37 Japan 205,3 0,2% 37 Lebanon 638,6 0,3%
38 Colombia 221,9 0,2% 38 FYR Macedonia 198,2 0,2% 38 Singapore 606,7 0,3%
39 Georgia 220,0 0,2% 39 Afghanistan 197,1 0,2% 39 Australia 590,8 0,3%
40 Tadjikistan 213,5 0,2% 40 Nigeria 189,9 0,2% 40 Mexico 484,0 0,2%
41 Argentina 212,3 0,2% 41 Indonesia 189,2 0,2% 41 Jordan 465,7 0,2%
42 Tunisia 211,8 0,2% 42 Croatia 187,8 0,2% 42 Kuwait 464,9 0,2%
43 Paraguay 174,9 0,1% 43 Hong Kong 187,4 0,2% 43 Croatia 347,8 0,2%
44 Lebanon 172,4 0,1% 44 Pakistan 186,0 0,2% 44 Argentina 347,1 0,2%
45 Kuwait 162,2 0,1% 45 Albania 181,7 0,2% 45 Tadjikistan 322,1 0,1%
46 Croatia 160,0 0,1% 46 Sudan 172,2 0,2% 46 Serbia 313,9 0,1%
47 Singapore 158,9 0,1% 47 Malaysia 170,9 0,2% 47 Chile 297,5 0,1%
48 Ghana 146,9 0,1% 48 Bosnia-Herzegovina 169,7 0,2% 48 Hong Kong 276,8 0,1%
49 Qatar 134,4 0,1% 49 Thailand 166,9 0,2% 49 Colombia 262,0 0,1%
50 Uruguay 129,2 0,1% 50 Belarus 140,9 0,2% 50 Belarus 257,8 0,1%
Turkey's Imports from … Turkey's Exports to … Turkey's Trade with…
Partner regions Mio euro % Partner regions Mio euro % Partner regions Mio euro %
ACP 1 614,0 1,2% ACP 1 828,9 2,1% ACP 3 442,9 1,5%
Andean Community 342,1 0,2% Andean Community 193,6 0,2% Andean Community 535,7 0,2%
ASEAN 3 780,5 2,7% ASEAN 1 127,3 1,3% ASEAN 4 907,8 2,2%
BRIC 32 895,2 23,7% BRIC 6 137,9 7,1% BRIC 39 033,2 17,4%
CACM 72,2 0,1% CACM 134,1 0,2% CACM 206,3 0,1%
Candidate Countries 199,7 0,1% Candidate Countries 385,9 0,4% Candidate Countries 585,6 0,3%
CIS 23 310,7 16,8% CIS 8 357,1 9,7% CIS 31 667,8 14,1%
EFTA 3 022,7 2,2% EFTA 1 852,8 2,2% EFTA 4 875,5 2,2%
Latin American Coun 2 673,7 1,9% Latin American Coun 1 176,9 1,4% Latin American Coun 3 850,6 1,7%
MEDA (excl EU and T 4 668,9 3,4% MEDA (excl EU and T 7 733,7 9,0% MEDA (excl EU and T 12 402,6 5,5%
Mercosur 1 536,0 1,1% Mercosur 643,8 0,7% Mercosur 2 179,8 1,0%
NAFTA 10 403,6 7,5% NAFTA 3 377,5 3,9% NAFTA 13 781,1 6,1%
EFTA: Iceland, Liechtenstein, Norway, Switzerland; Candidates: Croatia, FYR of Macedonia, Turkey; Andean Community: Bolivia, Colombia, Ecuador, Peru;
CIS: Armenia, Azerbaijan, Belarus, Georgia, Kyrgyzstan, Kazakhstan, Moldova Republic of, Russian Federation, Tajikistan, Turkmenistan, Ukraine, Uzbekistan;
CACM: Honduras, El Salvador, Nicaragua, Costa Rica, Guatemala, Panama; Mercosur: Argentina, Brazil, Paraguay, Uruguay; NAFTA: Canada, Mexico, United States;
Latin America Countries: CACM, Mercosur, ANCOM, Chile, Cuba, Dominican Republic, Haiti, Mexico, Panama, Venezuela; BRIC: Brazil, Russia, India, China;
ASEAN: Brunei Darussalam, Indonesia, Cambodia, Lao People's Democratic Republic, Myanmar, Malaysia, Philippines, Singapore, Thailand, Vietnam;
ACP: 79 countries; MEDA (excl EU & Turkey): Algeria, Egypt, Israel, Jordan, Lebanon, Morocco, Occupied Palestinian Territory, Syrian Arab Republic, Tunisia.
Source: IMF (DoTS) DG TRADE
European Union: 27 members. 21-Mar-12
7. EUROPEAN UNION, TRADE WITH THE WORLD AND TURKEY, BY SITC SECTION (2011)*
European Union, Imports from the World European Union, Imports from... Turkey
Value Value Share of
SITC Share of SITC Share of
SITC Sections (millions of SITC Sections (Millions of total EU
Codes Total (%) Codes Total (%)
euro) euro) Imports
SITC T TOTAL 1 683 931 100,0% SITC T TOTAL 47 588 100,0% 2,8%
SITC 3 Mineral fuels, lubricants and related materials 485 445 28,8% SITC 7 Machinery and transport equipment 17 622 37,0% 4,0%
SITC 7 Machinery and transport equipment 438 645 26,0% SITC 6 Manufactured goods classified chiefly by material 11 227 23,6% 6,1%
SITC 8 Miscellaneous manufactured articles 214 871 12,8% SITC 8 Miscellaneous manufactured articles 10 952 23,0% 5,1%
SITC 6 Manufactured goods classified chiefly by material 183 699 10,9% SITC 0 Food and live animals 3 257 6,8% 3,9%
SITC 5 Chemicals and related prod, n.e.s. 152 490 9,1% SITC 5 Chemicals and related prod, n.e.s. 2 069 4,3% 1,4%
SITC 0 Food and live animals 83 827 5,0% SITC 2 Crude materials, inedible, except fuels 1 201 2,5% 1,6%
SITC 2 Crude materials, inedible, except fuels 76 944 4,6% SITC 3 Mineral fuels, lubricants and related materials 765 1,6% 0,2%
SITC 9 Commodities and transactions n.c.e. 30 003 1,8% SITC 9 Commodities and transactions n.c.e. 223 0,5% 0,7%
SITC 4 Animal and vegetable oils, fats and waxes 8 596 0,5% SITC 1 Beverages and tobacco 165 0,3% 2,3%
SITC 1 Beverages and tobacco 7 061 0,4% SITC 4 Animal and vegetable oils, fats and waxes 18 0,0% 0,2%
Other 2 350 Other 89
European Union, Imports from the World European Union, Imports from... Turkey
SITC Other
SITC 4
SITC 1
9 SITCSITC14
SITC
Other
SITC 2 SITC 2 SITC 9
3
1,8%0,1%
0,5%
0,4%
SITC 5 2,5% 1,6%0,0%
0,3%
0,2%
0,5%
4,6%
SITC 0 4,3%
5,0%
SITC 0
SITC 3 6,8%
28,8%
SITC 5
9,1% SITC 7
37,0%
SITC 6
10,9% SITC 8
23,0%
SITC 8
12,8% SITC 7
26,0% SITC 6
23 6%
European Union, Exports to the World European Union, Exports to... Turkey
Value Value Share of
SITC Share of SITC Share of
SITC Sections (millions of SITC Sections (millions of total EU
Codes Total (%) Codes Total (%)
euro) euro) Exports
SITC T TOTAL 1 531 122 100,0% SITC T TOTAL 72 588 100,0% 4,7%
SITC 7 Machinery and transport equipment 647 511 42,3% SITC 7 Machinery and transport equipment 32 472 44,7% 5,0%
SITC 5 Chemicals and related prod, n.e.s. 253 037 16,5% SITC 5 Chemicals and related prod, n.e.s. 11 858 16,3% 4,7%
SITC 6 Manufactured goods classified chiefly by material 195 760 12,8% SITC 6 Manufactured goods classified chiefly by material 10 487 14,4% 5,4%
SITC 8 Miscellaneous manufactured articles 157 631 10,3% SITC 8 Miscellaneous manufactured articles 5 259 7,2% 3,3%
SITC 3 Mineral fuels, lubricants and related materials 98 650 6,4% SITC 2 Crude materials, inedible, except fuels 4 838 6,7% 11,8%
SITC 0 Food and live animals 63 726 4,2% SITC 3 Mineral fuels, lubricants and related materials 3 858 5,3% 3,9%
SITC 9 Commodities and transactions n.c.e. 43 679 2,9% SITC 0 Food and live animals 1 808 2,5% 2,8%
SITC 2 Crude materials, inedible, except fuels 40 920 2,7% SITC 9 Commodities and transactions n.c.e. 774 1,1% 1,8%
SITC 1 Beverages and tobacco 25 107 1,6% SITC 1 Beverages and tobacco 531 0,7% 2,1%
SITC 4 Animal and vegetable oils, fats and waxes 3 874 0,3% SITC 4 Animal and vegetable oils, fats and waxes 22 0,0% 0,6%
Other 1 227 Other 680
European Union, Exports to the World European Union, Exports to... Turkey
SITC 2 SITC 4
SITC 1
Other SITC SITC Other
0 SITC 1 4
SITC
9
SITC 9 0,3%
2,7% 1,6% 0,1% SITC 3 2,5% 1,1%0,9%
0,0%
0,7%
SITC 0 2,9% 5,3%
4,2%
SITC 2
SITC 3 6,7%
6,4%
SITC 7 SITC 8
42,3% 7,2% SITC 7
SITC 8 44,7%
10,3%
SITC 6
14,4%
SITC 6
12,8%
SITC 5 SITC 5
16,5% 16,3%
* The sums of the individual SITC product categories are less than the totals due to confidentiality reasons. DG TRADE
Source: EUROSTAT (Comext, Statistical regime 4); World excluding Intra-EU trade and European Union: 27 members. 21-Mar-12
8. EUROPEAN UNION IMPORTS, BY PRODUCT GROUPING*
European Union, Imports from... Turkey
SITC Rev.3 (UN, WTO/ITS) & AMA/NAMA** (WTO) 2007 2009 2011 Share of
Partner in EU
Product Groups Imports (2011)
Millions euro % Millions euro % Millions euro %
0000 - Total 47 028,4 100,0% 36 197,4 100,0% 47 588,4 100,0% 2,8%
1000 - Primary products 5 916,5 12,6% 4 573,5 12,6% 6 709,9 14,1% 1,0%
1100 - Agricultural products (Food (incl. Fish) & Raw Materials) 3 416,4 7,3% 3 175,3 8,8% 3 830,4 8,0% 2,9%
1200 - Fuels and mining products 2 500,1 5,3% 1 398,1 3,9% 2 879,4 6,1% 0,5%
2000 - Manufactures 40 897,6 87,0% 31 445,5 86,9% 40 547,2 85,2% 4,3%
2100 - Iron and steel 2 979,8 6,3% 1 154,2 3,2% 2 066,7 4,3% 6,1%
2200 - Chemicals 1 354,6 2,9% 1 341,1 3,7% 2 069,0 4,3% 1,4%
2300 - Other semi-manufactures 3 750,3 8,0% 3 048,1 8,4% 4 113,6 8,6% 4,8%
2400 - Machinery and transport equipment 17 505,0 37,2% 13 793,2 38,1% 17 621,9 37,0% 4,0%
2410 - Office and telecommunication equipment 1 928,1 4,1% 1 400,0 3,9% 1 410,1 3,0% 0,8%
2420 - Transport equipment 10 871,4 23,1% 8 352,6 23,1% 10 535,3 22,1% 10,3%
2430 - Other machinery 4 705,4 10,0% 4 040,6 11,2% 5 676,6 11,9% 3,6%
2500 - Textiles 3 722,7 7,9% 2 844,4 7,9% 3 743,8 7,9% 16,7%
2600 - Clothing 9 072,3 19,3% 7 178,1 19,8% 8 366,4 17,6% 11,6%
2700 - Other manufactures 2 513,0 5,3% 2 086,4 5,8% 2 565,9 5,4% 1,8%
3000 - Other products 159,0 0,3% 157,4 0,4% 242,7 0,5% 0,8%
Agricultural Products (AMA) 3 129,4 6,7% 2 931,7 8,1% 3 488,9 7,3% 3,6%
Non-Agricultural Products (NAMA) 43 736,5 93,0% 33 131,4 91,5% 43 813,5 92,1% 2,8%
Other Products 162,5 0,3% 134,2 0,4% 286,0 0,6% 1,7%
45%
1100 - Agricultural products (Food (incl. Fish) & Raw Materials)
40%
1200 - Fuels and mining products
35%
2100 - Iron and steel
30%
2200 - Chemicals
25%
2300 - Other semi-manufactures
20%
2400 - Machinery and transport equipment
15%
2500 - Textiles
10%
2600 - Clothing
5%
2700 - Other manufactures
0%
2007 2009 2011
European Union, Imports from the World (excl. Intra EU)
SITC Rev.3 (UN, WTO/ITS) & AMA/NAMA** (WTO) 2007 2009 2011 Average Annual
Growth (2007-
Product Groups 2011)
Millions euro % Millions euro % Millions euro %
0000 - Total 1 435 083,2 100,0% 1 207 813,6 100,0% 1 683 931,0 100,0% 4,1%
1000 - Primary products 529 936,9 36,9% 440 812,1 36,5% 703 822,3 41,8% 7,4%
1100 - Agricultural products (Food (incl. Fish) & Raw Materials) 109 698,1 7,6% 101 226,1 8,4% 133 557,5 7,9% 5,0%
1200 - Fuels and mining products 420 238,8 29,3% 339 586,0 28,1% 570 264,8 33,9% 7,9%
2000 - Manufactures 883 517,1 61,6% 738 564,5 61,1% 946 752,9 56,2% 1,7%
2100 - Iron and steel 42 149,2 2,9% 17 917,5 1,5% 34 113,7 2,0% -5,2%
2200 - Chemicals 120 706,1 8,4% 112 463,8 9,3% 152 490,4 9,1% 6,0%
2300 - Other semi-manufactures 79 424,1 5,5% 59 437,3 4,9% 85 216,3 5,1% 1,8%
2400 - Machinery and transport equipment 428 425,0 29,9% 352 429,5 29,2% 438 645,0 26,0% 0,6%
2410 - Office and telecommunication equipment 175 572,7 12,2% 143 363,3 11,9% 178 401,8 10,6% 0,4%
2420 - Transport equipment 111 326,6 7,8% 92 670,9 7,7% 102 056,2 6,1% -2,2%
2430 - Other machinery 141 525,7 9,9% 116 395,3 9,6% 158 187,0 9,4% 2,8%
2500 - Textiles 20 027,3 1,4% 16 274,2 1,3% 22 419,7 1,3% 2,9%
2600 - Clothing 61 846,3 4,3% 61 266,3 5,1% 72 425,9 4,3% 4,0%
2700 - Other manufactures 130 939,1 9,1% 118 775,9 9,8% 141 441,9 8,4% 1,9%
3000 - Other products 21 632,6 1,5% 28 440,9 2,4% 31 005,9 1,8% 9,4%
Agricultural Products (AMA) 77 818,4 5,4% 77 070,8 6,4% 98 148,4 5,8% 6,0%
Non-Agricultural Products (NAMA) 1 343 383,5 93,6% 1 116 421,3 92,4% 1 569 036,2 93,2% 4,0%
Other Products 13 881,3 1,0% 14 321,6 1,2% 16 746,5 1,0% 4,8%
40%
1100 - Agricultural products (Food (incl. Fish) & Raw Materials)
35%
1200 - Fuels and mining products
30% 2100 - Iron and steel
25% 2200 - Chemicals
20% 2300 - Other semi-manufactures
15% 2400 - Machinery and transport equipment
10% 2500 - Textiles
2600 - Clothing
5%
2700 - Other manufactures
0%
2007 2009 2011
SITC Rev. 3: 1000 - Primary products: 0, 1, 2, 3, 4, 68; 1100 - Agricultural products (Food (incl. Fish) & Raw Materials): 0, 1, 2, 4, excl. 27, excl. 28; 1200 - Fuels and mining products: 3, 27, 28, 68; 2000 – Manufactures: 5, 6, 7, 8, excl. 68, excl. 891; 2100 - Iron and steel: 67;
2200 – Chemicals: 5; 2300 - Other semi-manufactures: 61, 62, 63, 64, 66, 69; 2400 - Machinery and transport equipment: 7; 2410 - Office and telecommunication equipment: 75, 76, 776; 2420 - Transport equipment: 78, 79, 713, 7783; 2430 - Other machinery: 71, 72, 73,
74, 77, excl. 713, excl. 776, excl. 7783; 2500 – Textiles: 65; 2600 – Clothing: 84; 2700 - Other manufactures: 81, 82, 83, 85, 87, 88, 89, excl. 891; 3000 - Other products: 9, 891.
* The sums of the individual SITC product categories are less than the totals due to confidentiality reasons. DG TRADE
** Based on: http://www.wto.org/english/tratop_e/markacc_e/namachairtxt_dec08_e.pdf 21-Mar-12
Source: EUROSTAT (Comext, Statistical regime 4); World excluding Intra-EU trade and European Union: 27 members.