Use of Statistical Process Control to Improve Process Capability
•
2 j'aime•3,101 vues


Recommandé
Contenu connexe
Similaire à Use of Statistical Process Control to Improve Process Capability
Similaire à Use of Statistical Process Control to Improve Process Capability (20)
Plus de Nareshkumar Kannathasan
Plus de Nareshkumar Kannathasan (6)
Dernier
Dernier (20)
Use of Statistical Process Control to Improve Process Capability
- 1. Use of Statistical Process Control to Improve Process Capability Submitted as Continual Assessment report for M6141 Quality Engineering By Chandramohan Narendran (G1102353H) Durairaj Shamugasundaram (G1102355H) Krishnamoorthy Janardhanan (G1100860H) Kannathasan Nareshkumar (G1102357G) Rajamurthy Kubendran (G1100824D) School of Mechanical and Aerospace Engineering Nanyang Technological University
- 2. Introduction Statistical process control provides some tools that help us not only to monitor the performance of a process but also provides a way to measure the effectiveness of the process. Statistical process control can be used to monitor the process status i.e. whether it is in control or out of control. It can also be used to determine the process capability of the system i.e. whether the manufactured product with a given quality characteristic conforms to the specifications. This report discusses the way in which SPC tools can be used as a method to improve overall process capability of a given process. This report is based on the findings of a project conducted in Hyundai Motors India Ltd. The aim of the project of was to reduce salvage PPM (Parts Per Million) and to improve process capability of the transmission (gear box) manufacturing plant at Hyundai motors. It was found that the process capability of transmission shaft manufacturing was reduced due to problems encountered at the assembly stage (process rejection). Hence SPC tools were made use to find the cause of rejection and to rectify it. Problem Definition During the observation period in the transmission shop, the sequence of operations involved in transmission machining line and assembly line was observed. The various processes involved for machining each component and assembling of transmission system and its sub assembly were observed and studied. On visiting Quality Control division and upon consultation with the managers it was identified that the groove turning process as the major problem for process rejection in the output shaft production line. The exact nature of the problem can be described as follows: Output shafts are rejected at assembly due to inability to select a snap ring for the shaft (Snap Ring no-go). Snap rings are components used to close the gaps between the gears and sleeves of a shaft formed during assembly as a result of variations of dimensions of those components. When the finished shaft was used for assembly, the snap ring that should fit on the shaft does not fit and hence that shaft has to be rejected for not conforming to specifications. Losses Incurred Economical Loss Cost of a finished shaft: INR 523/unit Scrap Cost recovered: INR 8/kg Weight of a finished shaft: 1.59 kg Average loss per month: INR 19,518.21 Loss (INR /year): INR 2, 34,218.50 PPM: 3557.147 Refer to Table 1 for a detailed list of losses in each month.
- 3. Month Quantity Parts per Cost of Scrap Cost Loss Rejected million quantity recovered (INR)/month rejected November 40 4236.39 INR 20,920.00 INR 508.80 INR 20,411.20 December 18 2367.79 INR 9,414.00 INR 228.96 INR 9,285.00 January 25 2583.979 INR 13,075.00 INR 318.00 INR 12,757.00 February 70 4296.324 INR 36,610.00 INR 890.40 INR 35,719.00 Total 153 3557.147 INR 80,019.00 INR 1946.16 INR 78,072.84 Table 1 Losses due to rejection Classification of losses 1. Process failure loss: Caused due to Improper butting due to careless loading by operator Inappropriate offset setting Defective raw material 2. Abnormal production loss: Caused due to machining and assembly of defective shaft before snap ring is fitted 3. Quality defect loss: Caused due to Defective groove turning Large number of component rejections 4. Reproducing loss: Caused due to reworking of component (face grinding) due to groove height under spec 5. Measurement and adjustment loss (setup loss): Caused due to frequent measuring of groove height for offset setting and quality assurance 6. Logistics loss: Caused due to transport of defective component between various machining centres and heat treatment 7. Energy loss: Caused due to consumption of power, tool life, compressed air 8. Miscellaneous Losses: Caused due to Loss of 1 taper bearing Loss due to mix up of defective and good components
- 4. Process Layout Basic layout for sequence of operation of machining of output shaft is shown in figure 1. Heat Gear Hobbing Plain Grinding Treatment Face And OD Spline Rolling Gear Shaving Grinding Multispindle Angular Output Shaft Groove Turning Oil Hole Drilling Grinding Sub Assembly Gear Washing Deburring Gun Drilling Super Finishing And Testing Figure 1 Output shaft machining process Assembly Description The components that constitute 1st sub assembly are: 3 – Sleeve 4 - hub for synchronous sleeve 5 – 1st speed gear 6 &8 – Synchro ring 7 – Synchronous sleeve 9 – Snap Ring Figure 2 shows each of the components of the assembly. 1. The sleeve seats itself on the drive gear surface. 2. The 1st gear and needle bearing slide over the sleeve. 3. The hub of synchronous sleeve seats itself directly on the hub. 4. The synchronous sleeve slide over the hub 5. The snap ring comes next to the hub. Therefore the sum of heights of sleeve, hub and snap ring must effectively equal the groove height. Figure 2 Output shaft assembly
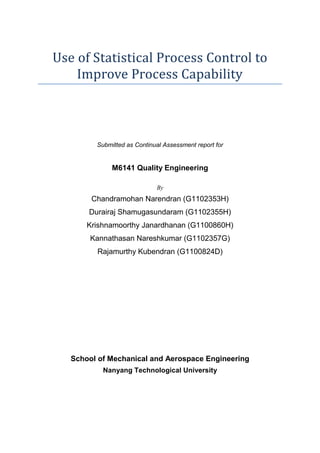
- 5. The height specifications of each of these components are given in table 2 to better understand the nature of the problem. Sleeve Sleeve Size Lower Limit 25.07 Sleeve Size Upper Limit 25.13 Hub Hub Size Lower Limit 24.16 Hub Size Upper Limit 24.24 Total Height Total Lower 49.23 Total Upper 49.37 1 & 2 Groove 1,2 groove Lower 50.87 1,2 Groove Upper 50.93 Range of deviation 1.7 1.5 Available Snap Ring sizes 1.62 1.5 3rd Gear 3rd Gear Upper 38.63 3rd gear Lower 38.57 4th gear 4th gear Upper 28.03 4th gear lower 27.97 5th gear 5th gear Upper 20.04 5th gear Lower 19.96 Assembly Lower 86.5 Assembly Upper 86.7 5th Groove 5th Groove Size Lower 88.26 5th Groove Size Upper 88.34 Range of Deviation 1.84 1.56 Snap Ring Sizes 1.78 1.57 Table 2 Assembly height specifications Analysis of history of rejections The data obtained from QC patrol points towards groove variation as a major cause of snap ring no-go (table 3). Date Cause Qty. Model 04.05.09 Groove distance undersize. 6 PA 05.05.09 Groove distance undersize 3 PA 06.05.09 Groove distance under and oversize 2 PA 16.05.09 Groove distance undersize 4 PA 20.05.09 Output shaft 1st gear sleeve mounting OD oversize & sleeve not 2 PA enter fully. Snap ring not able to select (Gauge does not enter) Table 3 Causes and occurrences The chart below (figure 3) makes it is obvious that the majority of the rejections are caused by variations due to groove size.
- 6. Causes for rejection 16 14 12 10 8 No. of occurrences 6 4 2 0 Groove Height Variation Sleeve Mounting Oversize Figure 3 Causes Observations Height Variations 1. 1, 2 groove height undersize 2. 1, 2 groove height oversize 3. 5th groove height undersize 4. 5th groove height oversize During 3,4,5 gear sub assembly, the dimension of concern for 5th groove height is the distance between 3rd seat and 5th groove rather than the distance of groove from drive gear face as being measured in BHT (Before heat treatment). Comparing drawing specs of output shaft groove heights with drawing specs of gear assembly heights we derive that the tolerance of snap rings available for 5th groove should be 1.56 - 1.84 mm but snap rings above 1.78mm are not available. Similarly for 1, 2 grooves, the sum of specified heights of sleeve and hub along with tolerance is 86.6±0.1. Accounting gear height and groove height, range of snap ring slots required are 1.49 - 1.7 whereas snap rings of height above 1.62 are not available. Therefore snap ring no-go may be caused because of the unavailability of snap ring of certain sizes. It should also be kept in mind that sleeve mounting oversize has also caused process rejection in two cases and should not be ruled out.
- 7. Figure 4 X bar chart for 1, 2 groove variation The above figure (figure 4) shows the ̅ chart for the 1st & 2nd groove turning operation. It can be observed that most of the samples are around the upper control limit level, some of them with 3 points exceeding the upper specification limit. The mean groove as seen above makes it apparent that it was generally maintained in USL. Studying the charts for hub and sleeve yielded the following results. Figure 5 X bar chart for hub height variation Hub height shows a wide range of variations during production (figure 5). But sleeve height remained predominantly in the LSL area as seen below (figure 6).
- 8. Figure 6 X bar chart for Sleeve height variation As expected, the net sub assembly (hub and sleeve assembled together) height also remains the lower specification limit as seen in the ̅ chart below (figure 7). Figure 7 X bar chart for sub-assembly height variation The mean groove height in random samples showed that they were generally maintained in USL. This creates a case where the snap ring slot (gap between groove height and sub assembly height) remains in the USL. If we consider the upper limit of snap ring slot (1.7) and highest available snap ring size (1.62) there is a difference of 80 microns. This causes a snap ring selection problem with free entry of snap ring. Inference The Snap Ring size range needs to be increased in the upper spec to prevent process rejection due to no-go of output shafts with snap ring slots in the range of 1.63 ~ 1.7. Since the processes were mostly in control as seen in the run charts, the rejection cannot be considered as a problem in the process.
- 9. When there is a Snap Ring no-go, the type of no-go (whether No Entry or Free Entry of Snap Ring needs to be recorded). A Snap Ring consumption pattern needs to be generated in the assembly based on data from output shaft sub assembly line. 5th Groove Height as a Factor for Snap Ring No-Go Figure 8 Required dimensions for the output shaft Figure 8 shows an output gear shaft with the required dimensions. Note that the groove height of the 5th groove (the groove on the extreme right of the shaft) should be positioned at 161.28 ± 0.02 mm from the shown reference point. Another requirement is that the groove should be made at 88.35 ± 0.04 from the point shown in the picture. The dimensions are all taken with the reference point located at 28.14±0.04 (reference point is marked with a triangle). CNC machines will be used to make the 5th groove. When the CNC machines are programmed, a definite value for the reference should be used. If 28.14 is the mean value used to program the machine and if a shaft that does not conform to this value, but still lies within the tolerance level, the groove will be machined out of specification. For example, if the machine encounters a shaft with gear height of 28.18, the groove will be made at 161.24, which is out of specification.
- 10. Figure 9 Out of specification case Such a case is shown in figure 9. When there is a shift in the value of gear height taken as reference, there is a subsequent shift in the 5th groove height, which falls below the lower specification limit. This will subsequently cause the snap ring problem due to groove height variation. The fact that 5th groove height will fall out specification cannot be controlled except by reducing tolerance of gear height from ±0.04 to ±0.02. Proposal One of the following measures can be adopted on the basis of feasibility to reduce considerably the process rejection due to groove turning 1. Snap rings to accommodate the following snap ring slots (difference in heights of groove and sub-assemblies) need to be introduced. 1&2 Grooves - 1.63, 1.64, 1.65, 1.66, 1.67, 1.68, 1.69, 1.70 5th Groove - 1.56, 1.79, 1.80, 1.81, 1.82, 1.83, 1.84 2. Tolerance of gear spec. in the raw material drawing should be reduced from 28.14+/-0.04 to 28.14+/-0.02. The process capability study shown in figure 10 shows an experiment wherein raw materials with gear height varying only within 0.04mm were handpicked and groove turned. Process capability of 1.61 was achieved.
- 11. Figure 10 Process capability study for experiment with reduced tolerance Conclusion The above method shows how SPC tools can be used to tackle situations in which there may not be an obvious out of control process but there is still lower process capability. This report also points out the importance of having the correct amount of upper and lower specifications. The snap ring problem effectively shows how components, even though satisfying all tolerance specifications, can still turn out to be non-conforming. Having a proper set of control limits and specification limits are only guidelines, and they need to be continuously monitored, changing as and when required, because the ultimate goal of process control is to maximize the process capability.