SlideShare une entreprise Scribd logo
1  sur  10
Télécharger pour lire hors ligne
Experimental Study on the Use of Human Urine for Selected
        Philippine Vegetable Crops: Assessment of Macronutrient
        Nutrient Content in Philippine Urine and Determination of
        Appropriate Urine Application Rates

        R. Gensch*, A. Miso* and G..S. Itchon**


        * Sustainable Sanitation Center, Xavier University – Ateneo de Cagayan, Masterson Avenue, Manresa Heights,
        Cagayan de Oro, Philippines
        (E-mail: robert.gensch@web.de; annamiso@googlemail.com)
        ** Department of Preventive and Community Medicine, Jose P. Rizal School of Medicine, Xavier University –
        Ateneo de Cagayan, Corrales Avenue, Cagayan de Oro, Philippines
        (E-mail: gsijuly18@yahoo.com)


        Abstract
        To assess agricultural potential of human urine as a liquid fertilizer under Philippine conditions an
        experimental study was conducted to determine the average macronutrient (N,P,K) content of
        human urine and appropriate urine application levels for commonly planted vegetable crops:
        Petchay, Sweet Corn and Eggplant. The study was conducted in 3 study locations representing the
        3 main Philippine regions: Luzon, Visayas. Mindanao.

        In each study area urine was collected from 10 different toilets and the average N,P,K content per
        study site and the countrywide average was determined. A randomized complete block design was
        used for agricultural experiments with 5 different treatments and 4 replications for each crop and
        study site. The 5 treatments include 3 urine application levels (75%, 100%, 125% of calculated
        optimum level that correspond to N-demand of plants), 1 treatment with application of synthetic
        fertilizer, and 1 treatment without urine/synthetic fertilizer application. The experimental variables
        observed were fresh marketable yield and plant height.

        The determined average N,P,K content in Philippine urine is N: 4.35 g/l, P: 0.4 g/l, K: 1.74 g/l. Of
        the 3 investigated urine levels, the 125% treatment showed best results in terms of marketable
        yield and plant height and can be attributed to the fact that the study was conducted during rainy
        season. Urine application with best results in plant height and marketable yield showed
        comparable results to synthetic fertilizer treatment, with either no significant difference or only
        slightly lesser yields. Compared with no fertilizer application the addition of urine significantly
        increased yield by 1.5-5 times, depending on plant type and study location.

        Application of urine as a fertilizer source can be recommended to increase agricultural production
        and may potentially substitute synthetic fertilizers. It is recommended to conduct larger-scale
        follow-up studies in order to consolidate existing data and to investigate potential differences
        during dry season.

        Keywords
        Sustainable Sanitation, Ecological Sanitation, Urine, Agricultural Reuse, Urine Diversion
        Dehydration Toilets, Nutrients


INTRODUCTION
Human urine is a valuable source of nutrients and properly sanitized urine can be considered an
effective liquid fertilizer in agricultural production (RICHERT et al. 2010). Substantial portion of
the soluble elements in urine are essential plant nutrients such as Nitrogen (N), Phosphorus (P) and
Potassium (K). The nutrient amount in human urine is dependent on the local diet and almost all of
the essential plant nutrients (N, P, and K) consumed with the daily food intake leave the human
body unchanged (JOENSSON et al. 2004). Urine contains most of these macronutrients as well as
smaller fractions of micronutrients in a plant available form and is particularly rich in Nitrogen.
Urine can, therefore, be considered a well-balanced nitrogen-rich liquid fertilizer.
Ecological Sanitation (ecosan) recognizes the potential of urine as a vast largely untapped valuable
resource that can help in the mitigation of poverty, malnutrition and food insecurity particularly at a
household level by providing a liquid fertilizer source that is immediately available and free,
regardless of logistic and economical resources. The term ecosan is often associated with the so-
called Urine Diversion Dehydration Toilet (UDDT), which is the most popular and most widely
used ecosan solution in the Philippines. Due to the different properties, urine and faeces are
collected separately in UDDTs and after storage of one month urine can be considered safe for use
in agriculture (WHO 2006).

However, since the nutrient content in human urine is very much dependent on the local diet it can
vary greatly between countries and regions. Up to the present time, there is neither reliable data
available on the nutrient content in human urine in the Philippines nor are there any
recommendations available on appropriate urine application levels for different vegetable crops
under Philippine conditions. While the ecosan community is promoting the re-use of urine in
agriculture, there is no scientific evidence on the response of different crops to different application
levels of urine.

Such information would greatly support the further spread of more sustainable sanitation solutions
like ecosan in the Philippines and would allow for the development of sound guidelines for the
agricultural community on the use of urine as a liquid fertilizer in vegetable crop production under
Philippine conditions and thus, make its agricultural use more attractive to farmers.

In order to address this knowledge gap this study will therefore determine the average amount of
macronutrients (N,P,K) in source-separated and 1-month old, stored human urine coming from 3
different representative areas in the Philippines (La Union, Bayawan, Cagayan de Oro). It will
furthermore determine appropriate urine application rates based on existing recommendations for
synthetic fertilizers for 3 different commonly planted vegetable crops, namely Sweet Corn, Petchay
and Eggplant in the 3 different study areas.

The findings of this study will enter into a national Philippine guideline document on the use of
urine as a liquid fertilizer in agriculture.


METHODS
The study was conducted from February 2010 until January 2011 simultaneously in three (3)
different study sites in the Philippines namely La Union, Bayawan and Cagayan de Oro
representing the three (3) main Philippine regions: Luzon, Visayas and Mindanao.

An amount of around 1000 liters of urine per study area was collected from a minimum of 10
different household and/or school Urine Diversion Dehydration Toilets (UDDT) per study location.
The urine was stored for 1 month in a 1000 liter storage container for hygienization purposes as
recommended by WHO (WHO 2006). Randomly chosen urine samples from five (5) out of the ten
(10) toilets as well as three (3) samples from the homogenously mixed urine were analyzed in terms
of their Nitrogen (N), Phosphorus (P) and Potassium (K) content. Based on the results the average
N, P, K content for each study site as well as the average for all the research areas was determined.

A randomized complete block design was used for the agricultural experiments with five (5)
different treatments and four (4) replications for each of the three (3) planted vegetable crops
(Sweet Corn, Petchay, Eggplant) in each study site. The planting bed size was 5m x 1.5m for
Eggplant and Sweet Corn and 2.5m x 1m for Petchay with 20 plants/bed, planted in 2 rows, to
imitate actual field conditions as far as possible.

The five (5) treatments include three (3) treatments with different urine application levels, one (1)
treatment with application of synthetic fertilizer using existing synthetic fertilizer recommendations
and one (1) control without any urine or synthetic fertilizer application. The three (3) urine
treatments are 75%, 100% and 125% of the theoretically calculated optimum urine application level
that correspond to the N-demand of the plants, based on existing synthetic fertilizer
recommendations from the Philippine Allotment Garden Manual (PUVeP 2008) and initially
determined average N, P, K content in Philippine urine.

Standard operating procedures (PUVEP 2008) for Eggplant, Sweet Corn and Petchay were followed
with basal fertilizer application (at transplanting) for all three (3) vegetable crops and additional
side dressings one (1) week and three (3) weeks after transplanting for Eggplant and side dressings
one (1) week and four (4) weeks after transplanting for Sweet Corn. Prior to application the
identified urine amounts were diluted with water at a 1:1 ratio. In order to draw conclusions for later
interpretation of the data, soil samples were taken from experimental areas and analyzed as regards
N, P, K content.

The research variables used were the fresh weight of the marketable yield at harvest (with one
harvest for Petchay and Sweet Corn and the sum of three (3) consecutive harvests for Eggplant) as
well as the height of the plants for Sweet Corn and Eggplant at transplanting/basal fertilizer
application, at first and second side dressing and at the time of harvest.


RESULTS

Urine analysis
The results from the laboratory analysis determining the N, P, K content of the urine samples from
the different study sites can be found in Table 1. It also included the calculated average N,P,K
content in the urine per study location. The average N, P, K content is based on the results from the
mixed samples in each study location. The only exemption is Bayawan. Here the average P content
is based on the individual collected samples since the P-content of the mixed sample is significantly
lower than those from the individual samples. It is assumed that this is because the urine has not
been mixed properly before samples were taken and that part of the available P in the mixed urine
already settled at the bottom of the 1000-liter container.

Table 1. Nitrogen, Phosphorus and Potassium content (in %) in analysed urine samples and
calculated average per study site
 Location                                                   N (%)      P (%)    K (%)
    CDO sample (Elementary School)                          0.260      0.027    0.251
    CDO sample (Chapel)                                     0.313      0.015    0.260
  Cagayan de Oro


    CDO sample (Elementary School)                          0.284      0.020    0.244
    CDO sample (High School)                                0.339      0.014    0.171
    CDO sample (Hospital)                                   0.305      0.012    0.037
    CDO mixed sample 1                                      0.448      0.048    0.162
    CDO mixed sample 2                                      0.437      0.034    0.180
    CDO mixed sample 3                                      0.437      0.037    0.185
    Cagayan de Oro - Average (based on mixed samples)       0.441      0.039    0.176
     La union sample 1 (Household)                           0.342     0.014    0.154
     La union sample 2 (Household)                           0.522     0.033    0.143
     La union sample 3 (Household)                           0.072     0.006    0.102
La Union


     La union sample 4 (Household)                           0.356     0.014    0.086
     La union sample 5 (Household)                           0.06      0.007    0.058
     La Union mixed sample 1                                 0.469     0.046    0.176
     La Union mixed sample 2                                 0.490     0.066    0.157
     La Union mixed sample 3                                 0.478     0.051    0.180
     La Union - Average (based on mixed samples)             0.479     0.054    0.171
     Bayawan sample 1 (Household)                            0.178     0.013    0.144
Ba
ya


     Bayawan sample 2 (Household)                            0.079     0.023    0.165
Bayawan sample 3 (Household)                                0.207       0.024      0.155
         Bayawan sample 4 (Household)                                0.037       0.026      0.147
         Bayawan sample 5 (Household)                                0.276       0.045      0.028
         Bayawan mixed sample 1                                      0.341       0.008      0.195
         Bayawan mixed sample 2                                      0.344       0.010      0.171
         Bayawan mixed sample 3                                      0.469       0.009      0.160
         Bayawan - Average (of mixed samples, except for P.          0.385       0.026      0.175
         Average P concentration taken from individual samples)


The corresponding average macronutrient (N,P,K) content per study location and the Philippine
average (in g/liter) can be found in Table 2.

Table 2. Calculated average N,P,K content (in g/liter) per study area and Philippine average
Location                        N (g/liter)                P (g/liter)            K (g/liter)
Cagayan de Oro                     4.41                       0.40                   1.76
La Union                           4.79                       0.54                   1.71
Bayawan                            3.85                       0.26                   1.75
Philippine average                 4.35                       0.40                   1.74

The urine application rates for Sweet Corn, Eggplant and Petchay have been determined based on
the average macronutrient content result for each study area above and the existing synthetic
fertilizer recommendations of the Allotment Garden Manual (PUVeP 2008). Since the N content in
human urine is considerably higher than the P and K content and to avoid over-application of urine
the calculations are based on the N-content of the urine (4.41g/liter in Cagayan de Oro, 4.79 g/liter
in La Union, and 3.85 g/liter in Bayawan respectively).

Table 3. Calculated urine application rates for Petchay, Sweet Corn and Eggplant for each of the 3
study areas
 Application Synthetic fertilizer                Treatment (%     Recommended amount of
               recommendations following of assumed               urine to be applied (liter/hill)
               SOP* (corresponding               optimal nutrient CDO       La Union Bayawan
               nutrient content in g/hill)       application)
Sweet Corn
1st                7.0 g/hill Complete 14-14-14          75          0.17       0.15        0.20
Application        (N: 0.98, P: 0.43, K: 0.81)          100          0.22       0.20        0.26
(Basal)
                                                        125          0.27       0.26        0.33
    nd
2                  4.0 g/hill Urea                       75          0.31       0.29        0.36
Application        (N: 1.84)                            100          0.42       0.38        0.48
(1 WAT)
                                                        125          0.52       0.48        0.60
    rd
3                  7.0 g/hill Urea                       75          0.54       0.50        0.63
Application        4.0 g/hill MOP                       100          0.73       0.67        0.84
(4 WAT)            (N: 3.22, K: 1.99)
                                                        125          0.91       0.84        1.05
Eggplant
1st                10.0 g/hill DAP                       75          0.31       0.28        0.35
Application        (N: 1.80, P: 2.02)                   100          0.41       0.38        0.47
(Basal)
                                                        125          0.51       0.47        0.59
    nd
2                  3.9 g/hill Urea                       75          0.31       0.28        0.35
Application     5.8 g/hill MOP                       100           0.41      0.38        0.47
(1 WAT)         (N: 1.79, K: 2.89)                   125           0.51      0.47        0.59
 rd
3               7.9 g/hill Urea                      75            0.62      0.56        0.71
Application     5.8 g/hill MOP                       100           0.82      0.76        0.94
(3 WAT)         (N: 3.63, K: 2.89)
                                                     125           1.02      0.94        1.18
Petchay
1st             10.0 g/hill DAP                      75            0.31      0.28        0.35
Application     (N: 1.80, P: 2.02)                   100           0.41      0.38        0.47
(Basal)
                                                125          0.51     0.47        0.59
(WAT: Weeks after Transplanting, DAP: Diammonium Phosphate, MOP: Muriate of Potash)


Soil analysis

Table 4. N,P,K content in the soil in Cagayan de Oro, La Union & Bayawan
Location                          N (g/liter)            P (g/liter)          K (g/liter)
Cagayan de Oro                        0.05             0.007 (73ppm)        0.04 (406ppm)
La Union                              0.06             0.03 (318ppm)        0.04 (374ppm)
Bayawan                               0.10             0.02 (233ppm)        0.04 (438ppm)


Agricultural experiments
The agricultural field trial with 3 different urine level treatments (75%, 100%, 125% of the
calculated urine application optimum), 1 synthetic fertilizer application treatment and 1 control
(without any urine or synthetic fertilizer application) showed the following results for the
marketable yield of Petchay, Eggplant and Sweet Corn in the respective 3 study locations:

Table 5. Average marketable yield (kg/bed) for Petchay, Sweet Corn and Eggplant in Cagayan de
Oro, La Union & Bayawan
                  T1              T2              T3            C1             C2
                  (urine          (urine          (urine        (control w/o   (control
                  application     application     application   urine/         with
                  with 75% of     with 100% of with 100% of synthetic          synthetic
                  calculated N    calculated N calculated N fertilizer         fertilizer
                  optimum)        optimum)        optimum)      application)   application)
 Petchay
 Cagayan     de 1.830             2.202           2.411         0.511          2.513
 Oro
 La Union         0.611           0.608           0.588         0.261          0.660
 Bayawan          2.375           2.425           2.613         0.925          2.728
 Sweet Corn
 Cagayan     de 8.276             8.341           8.879         5.056          8.839
 Oro
 La Union         3.572           3.641           4.186         2.103          4.679
 Bayawan          6.700           7.125           7.350         5.100          7.775
 Eggplant (after 3rd harvest)
 Cagayan     de 9.186             12.594          18.070        3.506          16.205
 Oro
 La Union         8.261           8.047           8.593         5.634          9.808
 Bayawan          5.250           5.625           6.675         1.425          6.175
Average marketable yield - Petchay                                           Average marketable yield - Petchay                                       Average marketable yield - Petchay
                         (CDO)                                                                      (La Union)                                                               (Bayawan)
                3                                                                           3                                                                     3                                          2.728
                                                              2.513                                                                                                                         2.613
                                          2.411                                                                                                                         2.375      2.425
           2.5                    2.202                                                 2.5                                                                      2.5

                2   1.83                                                                    2                                                                     2


                                                                               kg/bed
  kg/bed


                                                                                                                                                       kg/bed
           1.5                                                                          1.5                                                                      1.5
                                                                                                                                                                                                    0.925
                1                                                                           1                                                                     1
                                                                                                 0.611       0.608   0.588                 0.66
                                                   0.511
           0.5                                                                          0.5                                       0.261                          0.5

                0                                                                           0                                                                     0
                     T1            T2      T3       C1         C2                                 T1           T2     T3           C1       C2                           T1         T2       T3      C1         C2


                Average marketable yield – Sweet                                             Average marketable yield – Sweet                                         Average marketable yield – Sweet
                         Corn (CDO)                                                                  Corn (La Union)                                                          Corn (Bayawan)
           10                                                                           10                                                                       10
                                          8.879               8.839
            9       8.276     8.341                                                      9                                                                        9
                                                                                                                                                                                                             7.775
            8                                                                            8                                                                        8                7.125     7.35
                                                                                                                                                                         6.7
            7                                                                            7                                                                        7
            6                                                                            6                                                                        6


                                                                                                                                                        kg/bed
  kg/bed


                                                                             kg/bed
                                                   5.056                                                                                                                                             5.1
                                                                                                                                           4.679
            5                                                                            5                           4.186                                        5
                                                                                                3.572        3.641
            4                                                                            4                                                                        4
            3                                                                            3                                        2.103                           3
            2                                                                            2                                                                        2
            1                                                                            1                                                                        1
            0                                                                            0                                                                        0
                     T1           T2       T3       C1         C2                                T1           T2      T3           C1       C2                           T1         T2       T3      C1          C2


            Average marketable yield – Eggplant                                         Average marketable yield – Eggplant                                       Average marketable yield – Eggplant
                         (CDO)                                                                     (La Union)                                                                (Bayawan)
           20                             18.07                                       20                                                                         20
           18                                                 16.205                  18                                                                         18
           16                                                                         16                                                                         16
           14                 12.594                                                  14                                                                         14
           12                                                                         12                                                                         12
  kg/bed


                                                                             kg/bed


                                                                                                                                                       kg/bed
                    9.186                                                                                                                 9.808
           10                                                                         10        8.261        8.047   8.593                                       10
            8                                                                           8                                                                         8                         6.675            6.175
                                                                                                                                  5.634                                  5.25     5.625
            6                                                                           6                                                                         6
                                                   3.506
            4                                                                           4                                                                         4
                                                                                                                                                                                                    1.425
            2                                                                           2                                                                         2
            0                                                                           0                                                                         0
                     T1           T2       T3       C1         C2                                T1           T2      T3           C1       C2                           T1         T2       T3      C1          C2


The measured height at different planting stages for Eggplant and Sweet Corn in each of the 3 study
areas is reflected in the following graphs:
                             Average plant height of Eggplant (CDO)                                                                        Average plant height of Sweet Corn (CDO)
           90                                                                                                               250                                                                             C2
                                                                                                                                                                                                            T3
           80                                                                                           C2                                                                                                  T2
                                                                                                        T3                                                                                                  T1
           70                                                                                                               200                                                                             C1
                                                                                                        T1
                                                                                                        T2
           60
                                                                                                        C1
                                                                                                                            150
           50
 cm


                                                                                                                       cm


           40
                                                                                                                            100
           30

           20
                                                                                                                             50

           10

            0                                                                                                                 0
                          basal           1st side dressing    2nd side dressing                harvest                                   basal     1st side dressing           2nd side dressing     harvest
Average plant height of Eggplant (La Union)                                Average plant height of Sweet Corn (La Union)
      70                                                                     120
                                                                   C2                                                                            C2
                                                                   T3                                                                            T3
      60
                                                                             100
                                                                                                                                                 T2
                                                                   T2
                                                                   T1                                                                             T1
      50
                                                                   C1         80
                                                                                                                                                 C1
      40
 cm


                                                                        cm
                                                                              60
      30

                                                                              40
      20


                                                                              20
      10


       0                                                                       0
           basal      1st side dressing   2nd side dressing   harvest                   basal     1st side dressing     2nd side dressing    harvest


           Average plant height of Eggplant (Bayawan)                                   Average plant height of Sweet Corn (Bayawan)
      80                                                                      250                                                                  C2
                                                                  C2
      70                                                                                                                                           T3
                                                                  T3          200                                                                  T2
      60                                                                                                                                           T1
                                                                  T2
                                                                  T1
      50                                                          C1          150
                                                                                                                                                   C1


                                                                         cm
 cm


      40

                                                                              100
      30


      20
                                                                               50

      10


       0                                                                           0
           basal      1st side dressing   2nd side dressing   harvest                    basal      1st side dressing    2nd side dressing    harvest


DISCUSSION

N,P,K content in urine
The results of the study show that Philippine urine contains considerable amounts of N, P and K and
is particularly rich in Nitrogen. For the 3 study areas there are no significant differences in the N
and K content. However for the P content there are significant variations among the 3 study areas.
Since the P content is the only significant deviation this might be explained with the fact that part of
the P content tends to precipitate at the bottom of the urine container and it is assumed that the urine
might not have been mixed properly during the sample taking.

Urine application rates (Cagayan de Oro)
Petchay: Out of the 3 urine treatments the T3 (125% of the calculated urine optimum) treatment
shows the best result with regard to the average marketable yield. The average yield with the 125%
urine treatment is comparable to the use of synthetic fertilizer. T test shows no significant difference
in average marketable yield using 125% urine application and using synthetic fertilizer. Application
of synthetic fertilizer as well as all 3 urine treatments results in significantly higher yields than no
fertilizer application (control). The average yield of the synthetic fertilizer treatment and the 125%
urine treatment is around 5 times as much as the control (C1). Therefore, this study is able to show
that the use of 125% urine is able to produce comparable marketable yield in Petchay as using
synthetic fertilizer.

Sweet Corn: The comparison of average yields of T1, T2, T3 (75%, 100%, and 125% urine,
respectively) shows no significant difference using the t-test. Based on the results obtained, 75%,
100% and 125% urine concentrations are equally effective for use in Sweet Corn. However, based
on the trend seen, 125% urine concentration seems to produce the best result in terms of yield.
Comparing the results of the application of 125% urine treatment (T3) to the use of synthetic
fertilizer also shows no statistically significant difference. This shows that the use of 125% urine
on Sweet Corn is as effective as using synthetic fertilizer. Comparison of C1 and C2, and C1 with
the 3 urine treatments is significant. Application of synthetic fertilizer as well as all 3 urine
treatments results in significantly higher yields than no fertilizer application (control). The average
yield of the synthetic fertilizer treatment as well as the 3 urine treatments is around twice the
amount compared to the control (C1). As for the average plant height at harvest T1, T2, T3 and C2
show very similar results and the results show no statistical difference using the t test. Use of 75%,
100%, or 125% of the calculated urine optimum will produce the same height at harvest as use of
synthetic fertilizer. C1 (control), however, resulted in significantly shorter plants compared to all
the other groups.

Eggplant: Among the urine treatments the best result is shown by T3 (125% urine application),
which is similar to the C2 (synthetic fertilizer) application. The difference between T3 and C2 is not
significant using the t-test, which means that the use of 125% urine treatment will produce
comparable results to the use of synthetic fertilizer. Application of synthetic fertilizer as well as all
3 urine treatments resulted in significantly higher yields than no fertilizer application (control). The
average yield of the synthetic fertilizer treatment and the 125% urine treatment is around 5 times as
much as the control (C1). As for the average plant height the best result is shown by T3 followed by
C2. T3 and C2 results show no statistical difference, meaning that the T3 treatment will produce
comparable results to the use of synthetic fertilizer in terms of average height of plant at harvest.

Urine application rates (La Union)
For Petchay the best result for average yield is exhibited by C2. Among the urine treatment groups,
it is exhibited by T1. There is no significant difference between C2 and T1, between C2 and T2, and
between C2 and T3 results using t-test. Furthermore, there are no significant differences between T1
and T2, T2 and T3, and T1 and T3. There is a slightly significant difference, however, between T3
and C2. C1 (control) compared to all the treatment groups and C2 shows highly significant
differences with a considerably lesser yield than all other treatments. The average yield of the
synthetic fertilizer treatment as well as the 3 urine treatments is around twice the amount compared
to the control (C1).

For Sweet Corn the best result for average yield is shown by C2. Among the urine treatment groups,
it is shown by T3 with no significant difference between T3 and C2. There are significant
differences seen between T1 and T3 and T2 and T3. C1 (control) compared to all treatment groups
and C2 shows highly significant differences with a considerably lesser yield than all other
treatments. The average yield of the synthetic fertilizer treatment as well as the 3 urine treatments is
around twice the amount compared to the control (C1). Best results in plant height are shown by
C2. Among the treatment groups, best plant height result is shown by T3. There are no significant
differences shown comparing C2 to T3, C2 to T2 and C2 to T1. However, the difference is
significant comparing T1 and T2, T1 and T3, and T1 and C2. C1 (control) compared to all the
treatment groups and C2 shows highly significant difference.

For Eggplant T3 shows the best results for the average yield weight. Using t-test, the difference is
not significant compared to mean weight results at harvest of T1, T2, T3 and C2. Results of C1,
however, are highly significant compared to T1, T2, T3 and C2, with considerably lesser average
yields. The average yield of the synthetic fertilizer treatment as well as the 3 urine treatments is
nearly twice the amount compared to the control (C1). Best results in plant growth are exhibited by
T3 in all stages of the study and at harvest. Using t-test, the result for plant height is highly
significant compared to T1, slightly significant compared to T2 and highly significant compared to
C1. T–test further shows there is no significant difference in growth rates between T3 and C2.

Urine application rates (Bayawan)
For Petchay best result for the average yield is shown by C2. Among the urine treatment groups, it
is shown by T3. There is no significant difference shown between C2 and T3. There is a slight
statistically significant difference between C2 and T2, C2 and T1. C1 (control) shows a significant
difference when compared to all treatment groups and C2. Application of synthetic fertilizer as well
as all 3 urine treatments results in significantly higher yields than no fertilizer application (control).
The average yield of the synthetic fertilizer treatment as well as the 3 urine treatments is around
three times the amount compared to the control (C1).
For Sweet Corn the best result for the average yield is shown by C2. Among the urine treatment
groups, T3 shows the best result, followed by T2, and then T1. There is no significant difference
between C2 and T3. However, there are significant differences between C2 and T1, and between
C2 and T2. There are statistically significant differences between C1 (control) and all the urine
treatment groups and between C1 and C2. Application of synthetic fertilizer as well as all 3 urine
treatments results in significantly higher yields than no fertilizer application (control). The average
yield of the synthetic fertilizer treatment as well as the 3 urine treatments is around 1.5 times the
amount compared to the control (C1). Best results in plant height are shown by C2. Among the
treatment groups, best plant height result is shown by T3. There are only slight significant
differences shown comparing C2 to T3, C2 to T2 and C2 to T1. C1 (control) compared to all the
treatment groups and C2 shows highly significant difference.

For Eggplant the best results are shown by C2 in terms of average marketable yield. Among the
urine treatment groups, T3 shows the best result, followed by T2 and then T1. There is no
significant difference between the T3 and C2. However, there are significant statistical differences
between T3 and T1 and T3 and T2. C1 (control) shows a significant difference in comparison to all
the urine treatment groups and in comparison to C2. Application of synthetic fertilizer as well as all
3 urine treatments results in significantly higher yields than no fertilizer application (control). The
average yield of the synthetic fertilizer treatment as well as the 3 urine treatments is around four
times the amount compared to the control (C1).

Summary
Out of the 3 investigated urine treatment groups in the majority of cases T3 (125%) showed the best
results in terms of average marketable yield and plant height in the 3 study areas. One of the
possible reasons might be that due to a delay in the initial urine collection the study was conducted
during the rainy season and a certain amount of the applied urine nutrients might have been washed
out during the rainfall events.

In the majority of cases the urine application with the best results in plant height and marketable
yield showed comparable results to the synthetic fertilizer treatment, with no or only slight
significant difference. It shows that urine can be considered as effective as synthetic fertilizers.
The increase in yield that can be attributed to the application of urine as well as application of the
synthetic fertilizer treatment in comparison to no urine or synthetic fertilizer application (negative
control) is between 2-5 times for Petchay, around twice as much for Sweet Corn, and 1.5-5 times
for Eggplant.

Among the 3 study areas considerable differences in the overall average yield for the 3 planted
vegetable crops have been observed that cannot be fully explained. The analysis of the nutrient
content in the soil from the 3 study areas shows no significant differences (except for the P content
in CDO which is comparatively low, and the N-content in Bayawan which is comparatively high)
and allows no further conclusions that would explain the differences in the overall yield. The
differences in the yield may be attributed the other local site conditions such as available sunlight,
water, and general soil conditions. Despite the differences in the overall yields and plant heights the
general trends and results per treatment, however, remain comparable.


CONCLUSIONS
Due its high macronutrient content, particularly N, urine can be considered a valuable liquid
nutrient source and a potential synthetic fertilizer substitute in agricultural production. The average
N, P, K content in Philippine urine is 4.35 g/l of N, 0.4 g/l of P, and 1.74 g/l of K with a N,P,K ratio
of 11/1/1.5.

The application of urine that corresponds to the actual N requirements of the plants results in similar
yields and plant heights as those grown with synthetic fertilizers. Compared with no fertilizer
application the addition of urine in quantities corresponding to the plant needs can significantly
increase the marketable yield by 1.5 to 5 times, depending on the study location and the crops
planted.

Best fertilizing results with urine were achieved with applying a urine rate that corresponds to 125%
of the calculated optimum N requirements of the plants based on existing synthetic fertilizer
recommendations. However since the study was conducted during the rainy season this slightly
higher amount might be partly attributed to nutrient losses during periodic rainfall events.


RECOMMENDATIONS
From an agricultural point of view the application of urine as a liquid fertilizer source is
recommended to increase agricultural production at only minimal costs. An application of urine
corresponding to around 100% to 125% of the calculated optimum N requirements of the planted
crops is recommended and the amount of urine applied during the rainy season can be slightly
increased since it is assumed that some of the nutrients might be washed out during periodic
rainfalls.

It is furthermore suggested to conduct follow-up studies in the same study locations in order to
further consolidate the existing data and particularly to investigate potential differences with urine
application during the dry season.


References
JOENSSON, H., RICHERT A., VINNERAAS, B., SALOMON, E. (2004): Guidelines on the Use
of Urine and Faeces in Crop Production, Stockholm, Stockholm Environment Institute (SEI),
EcoSanRes Publication Series, Report 2004-2

PUVEP (2008): Philippine Allotment Garden Manual with an Introduction to Ecological Sanitation,
Peri-Urban Vegetable Project, Xavier University College of Agriculture, Cagayan de Oro,
Philippines, http://puvep.xu.edu.ph/publications/AG%20Booklet_final.pdf

RICHERT, A., GENSCH, R., JOENSSON, H., STENSTROEM, T.-A., DAGERSKOG, L. (2010):
Practical Guidance on the Use ofUrine in Crop Production: EcoSanResProgramme, Stockholm
Environment Institute, Stockholm, Sweden

WHO (2006): Guidelines for Safe Use Wastewater, Excreta and Greywater, Volume 4: Excreta and
Greywater Use in Agriculture, Geneva, World Health Organisation

Contenu connexe

Tendances

Report exp 6 and 7 (DNA and RNA)
Report exp 6 and 7 (DNA and RNA)Report exp 6 and 7 (DNA and RNA)
Report exp 6 and 7 (DNA and RNA)Kevin Balda
 
La Solidaridad and the Propaganda Movement
La Solidaridad and the Propaganda MovementLa Solidaridad and the Propaganda Movement
La Solidaridad and the Propaganda Movementallyn joy calcaben
 
History of Philippine Education
History of Philippine EducationHistory of Philippine Education
History of Philippine EducationJbTrongco777
 
Chapter 4 PRESENTATION, ANALYSIS AND INTERPRETATION
Chapter 4 PRESENTATION, ANALYSIS AND INTERPRETATIONChapter 4 PRESENTATION, ANALYSIS AND INTERPRETATION
Chapter 4 PRESENTATION, ANALYSIS AND INTERPRETATIONLJ Villanueva
 
CONCEPTUAL FRAMEWORK
CONCEPTUAL FRAMEWORKCONCEPTUAL FRAMEWORK
CONCEPTUAL FRAMEWORKlendiibanez22
 
Related Literature and Related Studies
Related Literature and Related StudiesRelated Literature and Related Studies
Related Literature and Related StudiesJenny Reyes
 
Kabanata 1 sa pananaliksik (suliranin at kaligiran)
Kabanata 1 sa pananaliksik (suliranin at kaligiran)Kabanata 1 sa pananaliksik (suliranin at kaligiran)
Kabanata 1 sa pananaliksik (suliranin at kaligiran)NicoleGala
 
Laboratory apparatus
Laboratory apparatusLaboratory apparatus
Laboratory apparatusAlyssa Vicera
 
Statistical treatment of data
Statistical treatment of dataStatistical treatment of data
Statistical treatment of datasenseiDelfin
 
introduction to functions grade 11(General Math)
introduction to functions grade 11(General Math)introduction to functions grade 11(General Math)
introduction to functions grade 11(General Math)liza magalso
 
science, technology and society
science, technology and societyscience, technology and society
science, technology and societyMerlyn Denesia
 
Participants of the study
Participants of the studyParticipants of the study
Participants of the studyMayang Colcol
 

Tendances (20)

Report exp 6 and 7 (DNA and RNA)
Report exp 6 and 7 (DNA and RNA)Report exp 6 and 7 (DNA and RNA)
Report exp 6 and 7 (DNA and RNA)
 
La Solidaridad and the Propaganda Movement
La Solidaridad and the Propaganda MovementLa Solidaridad and the Propaganda Movement
La Solidaridad and the Propaganda Movement
 
History of Philippine Education
History of Philippine EducationHistory of Philippine Education
History of Philippine Education
 
Pre calculus Grade 11 Learner's Module Senior High School
Pre calculus Grade 11 Learner's Module Senior High SchoolPre calculus Grade 11 Learner's Module Senior High School
Pre calculus Grade 11 Learner's Module Senior High School
 
Chapter 3
Chapter 3Chapter 3
Chapter 3
 
Famous filipinos in the field of science
Famous filipinos in the field of scienceFamous filipinos in the field of science
Famous filipinos in the field of science
 
Chapter 4 PRESENTATION, ANALYSIS AND INTERPRETATION
Chapter 4 PRESENTATION, ANALYSIS AND INTERPRETATIONChapter 4 PRESENTATION, ANALYSIS AND INTERPRETATION
Chapter 4 PRESENTATION, ANALYSIS AND INTERPRETATION
 
Social classes
Social classesSocial classes
Social classes
 
CONCEPTUAL FRAMEWORK
CONCEPTUAL FRAMEWORKCONCEPTUAL FRAMEWORK
CONCEPTUAL FRAMEWORK
 
Related Literature and Related Studies
Related Literature and Related StudiesRelated Literature and Related Studies
Related Literature and Related Studies
 
Kabanata 1 sa pananaliksik (suliranin at kaligiran)
Kabanata 1 sa pananaliksik (suliranin at kaligiran)Kabanata 1 sa pananaliksik (suliranin at kaligiran)
Kabanata 1 sa pananaliksik (suliranin at kaligiran)
 
Parts and functions of a compound microscope
Parts and functions of a compound microscopeParts and functions of a compound microscope
Parts and functions of a compound microscope
 
Laboratory apparatus
Laboratory apparatusLaboratory apparatus
Laboratory apparatus
 
Statistical treatment of data
Statistical treatment of dataStatistical treatment of data
Statistical treatment of data
 
introduction to functions grade 11(General Math)
introduction to functions grade 11(General Math)introduction to functions grade 11(General Math)
introduction to functions grade 11(General Math)
 
Chapter 2
Chapter 2Chapter 2
Chapter 2
 
science, technology and society
science, technology and societyscience, technology and society
science, technology and society
 
Human acts
Human actsHuman acts
Human acts
 
Participants of the study
Participants of the studyParticipants of the study
Participants of the study
 
Patriotism and nationalism
Patriotism and nationalismPatriotism and nationalism
Patriotism and nationalism
 

Similaire à Experimental Study on the Use of Human Urine for Selected Philippine Vegetable Crops: Assessment of Macronutrient Nutrient Content in Philippine Urine and Determination of Appropriate Urine Application Rates

“Development of Organic Fertilizer Products and Systems to Improve Soil Ferti...
“Development of Organic Fertilizer Products and Systems to Improve Soil Ferti...“Development of Organic Fertilizer Products and Systems to Improve Soil Ferti...
“Development of Organic Fertilizer Products and Systems to Improve Soil Ferti...ShynneGabinete
 
Camarones
CamaronesCamarones
Camarones712894
 
Stable Isotope Analysis as a Tool to Determine Nitrogen Fertilizer Source
Stable Isotope Analysis as a Tool to Determine Nitrogen Fertilizer SourceStable Isotope Analysis as a Tool to Determine Nitrogen Fertilizer Source
Stable Isotope Analysis as a Tool to Determine Nitrogen Fertilizer SourceCrimsonpublishersMCDA
 
Ecosan -there is more to it!
Ecosan -there is more to it!Ecosan -there is more to it!
Ecosan -there is more to it!FRANK Water
 
Enhancing Productivity and Livelihoods among Smallholders Irrigations through...
Enhancing Productivity and Livelihoods among Smallholders Irrigations through...Enhancing Productivity and Livelihoods among Smallholders Irrigations through...
Enhancing Productivity and Livelihoods among Smallholders Irrigations through...Jenkins Macedo
 
Effects of renewal pattern of recycled nutrient solution on the ion balance i...
Effects of renewal pattern of recycled nutrient solution on the ion balance i...Effects of renewal pattern of recycled nutrient solution on the ion balance i...
Effects of renewal pattern of recycled nutrient solution on the ion balance i...gugabione
 
1-s2.0-S2452316X17303332-main.pdf
1-s2.0-S2452316X17303332-main.pdf1-s2.0-S2452316X17303332-main.pdf
1-s2.0-S2452316X17303332-main.pdfFantahun Dugassa
 
553bc6f20cf245bdd76671b2
553bc6f20cf245bdd76671b2553bc6f20cf245bdd76671b2
553bc6f20cf245bdd76671b2Yousaf Riaz
 
notes on agriculture engineering notesss
notes on agriculture engineering notesssnotes on agriculture engineering notesss
notes on agriculture engineering notesssShobhaByadagi
 
Impact of Untreated Brewery Effluent on Bacteriological Characteristic of Agr...
Impact of Untreated Brewery Effluent on Bacteriological Characteristic of Agr...Impact of Untreated Brewery Effluent on Bacteriological Characteristic of Agr...
Impact of Untreated Brewery Effluent on Bacteriological Characteristic of Agr...ijtsrd
 
Increasing the Growth and Product of Red Spinach and Study of it’s Benefits a...
Increasing the Growth and Product of Red Spinach and Study of it’s Benefits a...Increasing the Growth and Product of Red Spinach and Study of it’s Benefits a...
Increasing the Growth and Product of Red Spinach and Study of it’s Benefits a...AI Publications
 
Ecosan advocacy Presentation
Ecosan advocacy PresentationEcosan advocacy Presentation
Ecosan advocacy PresentationFRANK Water
 
Best paper of november 2016, singapore engineering
Best paper of november 2016, singapore  engineeringBest paper of november 2016, singapore  engineering
Best paper of november 2016, singapore engineeringGlobal R & D Services
 
Yield and yield components of pepper (capsicum annuum l.) as influenced by st...
Yield and yield components of pepper (capsicum annuum l.) as influenced by st...Yield and yield components of pepper (capsicum annuum l.) as influenced by st...
Yield and yield components of pepper (capsicum annuum l.) as influenced by st...Alexander Decker
 
Int.-J.-Exp.-Res.-Rev.-Vol.-7-10-17-2016
Int.-J.-Exp.-Res.-Rev.-Vol.-7-10-17-2016Int.-J.-Exp.-Res.-Rev.-Vol.-7-10-17-2016
Int.-J.-Exp.-Res.-Rev.-Vol.-7-10-17-2016Kshitiz Dhakal
 
Makalah Liquid Organics Fertilizer, Mustard Greentech UIN
Makalah Liquid Organics Fertilizer, Mustard Greentech UINMakalah Liquid Organics Fertilizer, Mustard Greentech UIN
Makalah Liquid Organics Fertilizer, Mustard Greentech UINBBPP_Batu
 
Effect of different amino acids on the morphology and bio-chemical attributes...
Effect of different amino acids on the morphology and bio-chemical attributes...Effect of different amino acids on the morphology and bio-chemical attributes...
Effect of different amino acids on the morphology and bio-chemical attributes...Innspub Net
 
Nitrogen and Phosphorus Use EfficiencyinImproved Potato_Hailu Gebru 2017.pdf
Nitrogen and Phosphorus Use EfficiencyinImproved Potato_Hailu Gebru 2017.pdfNitrogen and Phosphorus Use EfficiencyinImproved Potato_Hailu Gebru 2017.pdf
Nitrogen and Phosphorus Use EfficiencyinImproved Potato_Hailu Gebru 2017.pdfAbebeChindi1
 

Similaire à Experimental Study on the Use of Human Urine for Selected Philippine Vegetable Crops: Assessment of Macronutrient Nutrient Content in Philippine Urine and Determination of Appropriate Urine Application Rates (20)

“Development of Organic Fertilizer Products and Systems to Improve Soil Ferti...
“Development of Organic Fertilizer Products and Systems to Improve Soil Ferti...“Development of Organic Fertilizer Products and Systems to Improve Soil Ferti...
“Development of Organic Fertilizer Products and Systems to Improve Soil Ferti...
 
Camarones
CamaronesCamarones
Camarones
 
Stable Isotope Analysis as a Tool to Determine Nitrogen Fertilizer Source
Stable Isotope Analysis as a Tool to Determine Nitrogen Fertilizer SourceStable Isotope Analysis as a Tool to Determine Nitrogen Fertilizer Source
Stable Isotope Analysis as a Tool to Determine Nitrogen Fertilizer Source
 
Ecosan -there is more to it!
Ecosan -there is more to it!Ecosan -there is more to it!
Ecosan -there is more to it!
 
Enhancing Productivity and Livelihoods among Smallholders Irrigations through...
Enhancing Productivity and Livelihoods among Smallholders Irrigations through...Enhancing Productivity and Livelihoods among Smallholders Irrigations through...
Enhancing Productivity and Livelihoods among Smallholders Irrigations through...
 
Effects of renewal pattern of recycled nutrient solution on the ion balance i...
Effects of renewal pattern of recycled nutrient solution on the ion balance i...Effects of renewal pattern of recycled nutrient solution on the ion balance i...
Effects of renewal pattern of recycled nutrient solution on the ion balance i...
 
B034011017
B034011017B034011017
B034011017
 
1-s2.0-S2452316X17303332-main.pdf
1-s2.0-S2452316X17303332-main.pdf1-s2.0-S2452316X17303332-main.pdf
1-s2.0-S2452316X17303332-main.pdf
 
Study the effects of vermicompost prepared by decoction tea powder on abelmos...
Study the effects of vermicompost prepared by decoction tea powder on abelmos...Study the effects of vermicompost prepared by decoction tea powder on abelmos...
Study the effects of vermicompost prepared by decoction tea powder on abelmos...
 
553bc6f20cf245bdd76671b2
553bc6f20cf245bdd76671b2553bc6f20cf245bdd76671b2
553bc6f20cf245bdd76671b2
 
notes on agriculture engineering notesss
notes on agriculture engineering notesssnotes on agriculture engineering notesss
notes on agriculture engineering notesss
 
Impact of Untreated Brewery Effluent on Bacteriological Characteristic of Agr...
Impact of Untreated Brewery Effluent on Bacteriological Characteristic of Agr...Impact of Untreated Brewery Effluent on Bacteriological Characteristic of Agr...
Impact of Untreated Brewery Effluent on Bacteriological Characteristic of Agr...
 
Increasing the Growth and Product of Red Spinach and Study of it’s Benefits a...
Increasing the Growth and Product of Red Spinach and Study of it’s Benefits a...Increasing the Growth and Product of Red Spinach and Study of it’s Benefits a...
Increasing the Growth and Product of Red Spinach and Study of it’s Benefits a...
 
Ecosan advocacy Presentation
Ecosan advocacy PresentationEcosan advocacy Presentation
Ecosan advocacy Presentation
 
Best paper of november 2016, singapore engineering
Best paper of november 2016, singapore  engineeringBest paper of november 2016, singapore  engineering
Best paper of november 2016, singapore engineering
 
Yield and yield components of pepper (capsicum annuum l.) as influenced by st...
Yield and yield components of pepper (capsicum annuum l.) as influenced by st...Yield and yield components of pepper (capsicum annuum l.) as influenced by st...
Yield and yield components of pepper (capsicum annuum l.) as influenced by st...
 
Int.-J.-Exp.-Res.-Rev.-Vol.-7-10-17-2016
Int.-J.-Exp.-Res.-Rev.-Vol.-7-10-17-2016Int.-J.-Exp.-Res.-Rev.-Vol.-7-10-17-2016
Int.-J.-Exp.-Res.-Rev.-Vol.-7-10-17-2016
 
Makalah Liquid Organics Fertilizer, Mustard Greentech UIN
Makalah Liquid Organics Fertilizer, Mustard Greentech UINMakalah Liquid Organics Fertilizer, Mustard Greentech UIN
Makalah Liquid Organics Fertilizer, Mustard Greentech UIN
 
Effect of different amino acids on the morphology and bio-chemical attributes...
Effect of different amino acids on the morphology and bio-chemical attributes...Effect of different amino acids on the morphology and bio-chemical attributes...
Effect of different amino acids on the morphology and bio-chemical attributes...
 
Nitrogen and Phosphorus Use EfficiencyinImproved Potato_Hailu Gebru 2017.pdf
Nitrogen and Phosphorus Use EfficiencyinImproved Potato_Hailu Gebru 2017.pdfNitrogen and Phosphorus Use EfficiencyinImproved Potato_Hailu Gebru 2017.pdf
Nitrogen and Phosphorus Use EfficiencyinImproved Potato_Hailu Gebru 2017.pdf
 

Plus de Oswar Mungkasa

Urun Rembuk. Permukiman dan Ketahanan Pangan
Urun Rembuk. Permukiman dan Ketahanan PanganUrun Rembuk. Permukiman dan Ketahanan Pangan
Urun Rembuk. Permukiman dan Ketahanan PanganOswar Mungkasa
 
Merengkuh kota ramah pejalan kaki dan Pesepeda. Pembelajaran Mancanegara dan ...
Merengkuh kota ramah pejalan kaki dan Pesepeda. Pembelajaran Mancanegara dan ...Merengkuh kota ramah pejalan kaki dan Pesepeda. Pembelajaran Mancanegara dan ...
Merengkuh kota ramah pejalan kaki dan Pesepeda. Pembelajaran Mancanegara dan ...Oswar Mungkasa
 
Tata Kelola Kolaboratif dalam Pengembangan Wilayah Berkelanjutan. Konsep, Pra...
Tata Kelola Kolaboratif dalam Pengembangan Wilayah Berkelanjutan. Konsep, Pra...Tata Kelola Kolaboratif dalam Pengembangan Wilayah Berkelanjutan. Konsep, Pra...
Tata Kelola Kolaboratif dalam Pengembangan Wilayah Berkelanjutan. Konsep, Pra...Oswar Mungkasa
 
Sudah saatnya mempopulerkan upcycling
Sudah saatnya mempopulerkan upcyclingSudah saatnya mempopulerkan upcycling
Sudah saatnya mempopulerkan upcyclingOswar Mungkasa
 
Green infrastructure in jakarta basic understanding and implementation effort...
Green infrastructure in jakarta basic understanding and implementation effort...Green infrastructure in jakarta basic understanding and implementation effort...
Green infrastructure in jakarta basic understanding and implementation effort...Oswar Mungkasa
 
Tata Kelola Kolaboratif dalam Desain Kebijakan Publik. Studi Kasus Pelaksanaa...
Tata Kelola Kolaboratif dalam Desain Kebijakan Publik. Studi Kasus Pelaksanaa...Tata Kelola Kolaboratif dalam Desain Kebijakan Publik. Studi Kasus Pelaksanaa...
Tata Kelola Kolaboratif dalam Desain Kebijakan Publik. Studi Kasus Pelaksanaa...Oswar Mungkasa
 
Fakta, Isu dan SAran Penyempurnaan BP TAPERA
Fakta, Isu dan SAran Penyempurnaan BP TAPERAFakta, Isu dan SAran Penyempurnaan BP TAPERA
Fakta, Isu dan SAran Penyempurnaan BP TAPERAOswar Mungkasa
 
Tata kelola kolaboratif. Menata Kolaborasi Pemangku Kepentingan
Tata kelola kolaboratif. Menata Kolaborasi Pemangku KepentinganTata kelola kolaboratif. Menata Kolaborasi Pemangku Kepentingan
Tata kelola kolaboratif. Menata Kolaborasi Pemangku KepentinganOswar Mungkasa
 
Pedoman kepemimpinan bersama
Pedoman kepemimpinan bersama Pedoman kepemimpinan bersama
Pedoman kepemimpinan bersama Oswar Mungkasa
 
Memudahkan upaya kolaborasi beragam pemangku kepentingan
Memudahkan upaya kolaborasi beragam pemangku kepentinganMemudahkan upaya kolaborasi beragam pemangku kepentingan
Memudahkan upaya kolaborasi beragam pemangku kepentinganOswar Mungkasa
 
MAKALAH. Bekerja dari Rumah (working from home). Menuju Tatanan Baru Era Covi...
MAKALAH. Bekerja dari Rumah (working from home). Menuju Tatanan Baru Era Covi...MAKALAH. Bekerja dari Rumah (working from home). Menuju Tatanan Baru Era Covi...
MAKALAH. Bekerja dari Rumah (working from home). Menuju Tatanan Baru Era Covi...Oswar Mungkasa
 
Bekerja jarak jauh (telecommuting/Working from home/WFH). Konsep-Penerapan-Pe...
Bekerja jarak jauh (telecommuting/Working from home/WFH). Konsep-Penerapan-Pe...Bekerja jarak jauh (telecommuting/Working from home/WFH). Konsep-Penerapan-Pe...
Bekerja jarak jauh (telecommuting/Working from home/WFH). Konsep-Penerapan-Pe...Oswar Mungkasa
 
PRESENTATION. Public Lecture "Jakarta's Response to COVID 19: Strategy-Lesson...
PRESENTATION. Public Lecture "Jakarta's Response to COVID 19: Strategy-Lesson...PRESENTATION. Public Lecture "Jakarta's Response to COVID 19: Strategy-Lesson...
PRESENTATION. Public Lecture "Jakarta's Response to COVID 19: Strategy-Lesson...Oswar Mungkasa
 
Bekerja jarak jauh (telecommuting). Konsep, penerapan dan pembelajaran
Bekerja jarak jauh (telecommuting). Konsep, penerapan dan pembelajaranBekerja jarak jauh (telecommuting). Konsep, penerapan dan pembelajaran
Bekerja jarak jauh (telecommuting). Konsep, penerapan dan pembelajaranOswar Mungkasa
 
LAPORAN. Memori Akhir Jabatan Koordinator Pelaksanaan Program Strategi Ketaha...
LAPORAN. Memori Akhir Jabatan Koordinator Pelaksanaan Program Strategi Ketaha...LAPORAN. Memori Akhir Jabatan Koordinator Pelaksanaan Program Strategi Ketaha...
LAPORAN. Memori Akhir Jabatan Koordinator Pelaksanaan Program Strategi Ketaha...Oswar Mungkasa
 
Laporan. Pelaksanaan Kegiatan Pelaksana Tugas Deputi Gubernur DKI Jakarta bid...
Laporan. Pelaksanaan Kegiatan Pelaksana Tugas Deputi Gubernur DKI Jakarta bid...Laporan. Pelaksanaan Kegiatan Pelaksana Tugas Deputi Gubernur DKI Jakarta bid...
Laporan. Pelaksanaan Kegiatan Pelaksana Tugas Deputi Gubernur DKI Jakarta bid...Oswar Mungkasa
 
Laporan. Pelaksanaan Kegiatan Kedeputian Gubernur DKI Jakarta bidang Tata Rua...
Laporan. Pelaksanaan Kegiatan Kedeputian Gubernur DKI Jakarta bidang Tata Rua...Laporan. Pelaksanaan Kegiatan Kedeputian Gubernur DKI Jakarta bidang Tata Rua...
Laporan. Pelaksanaan Kegiatan Kedeputian Gubernur DKI Jakarta bidang Tata Rua...Oswar Mungkasa
 
Presentation. Collaboration Towards A Resilient Jakarta
Presentation. Collaboration Towards A Resilient JakartaPresentation. Collaboration Towards A Resilient Jakarta
Presentation. Collaboration Towards A Resilient JakartaOswar Mungkasa
 
Pengenalan konsep saleh sosial dalam pembangunan sanitasi
Pengenalan konsep saleh sosial dalam pembangunan sanitasiPengenalan konsep saleh sosial dalam pembangunan sanitasi
Pengenalan konsep saleh sosial dalam pembangunan sanitasiOswar Mungkasa
 
Suplemen HUD Magz Edisi 5 /2015. Kota BATAM Menyongsong MEA 2015
Suplemen HUD Magz Edisi 5 /2015. Kota BATAM Menyongsong MEA 2015Suplemen HUD Magz Edisi 5 /2015. Kota BATAM Menyongsong MEA 2015
Suplemen HUD Magz Edisi 5 /2015. Kota BATAM Menyongsong MEA 2015Oswar Mungkasa
 

Plus de Oswar Mungkasa (20)

Urun Rembuk. Permukiman dan Ketahanan Pangan
Urun Rembuk. Permukiman dan Ketahanan PanganUrun Rembuk. Permukiman dan Ketahanan Pangan
Urun Rembuk. Permukiman dan Ketahanan Pangan
 
Merengkuh kota ramah pejalan kaki dan Pesepeda. Pembelajaran Mancanegara dan ...
Merengkuh kota ramah pejalan kaki dan Pesepeda. Pembelajaran Mancanegara dan ...Merengkuh kota ramah pejalan kaki dan Pesepeda. Pembelajaran Mancanegara dan ...
Merengkuh kota ramah pejalan kaki dan Pesepeda. Pembelajaran Mancanegara dan ...
 
Tata Kelola Kolaboratif dalam Pengembangan Wilayah Berkelanjutan. Konsep, Pra...
Tata Kelola Kolaboratif dalam Pengembangan Wilayah Berkelanjutan. Konsep, Pra...Tata Kelola Kolaboratif dalam Pengembangan Wilayah Berkelanjutan. Konsep, Pra...
Tata Kelola Kolaboratif dalam Pengembangan Wilayah Berkelanjutan. Konsep, Pra...
 
Sudah saatnya mempopulerkan upcycling
Sudah saatnya mempopulerkan upcyclingSudah saatnya mempopulerkan upcycling
Sudah saatnya mempopulerkan upcycling
 
Green infrastructure in jakarta basic understanding and implementation effort...
Green infrastructure in jakarta basic understanding and implementation effort...Green infrastructure in jakarta basic understanding and implementation effort...
Green infrastructure in jakarta basic understanding and implementation effort...
 
Tata Kelola Kolaboratif dalam Desain Kebijakan Publik. Studi Kasus Pelaksanaa...
Tata Kelola Kolaboratif dalam Desain Kebijakan Publik. Studi Kasus Pelaksanaa...Tata Kelola Kolaboratif dalam Desain Kebijakan Publik. Studi Kasus Pelaksanaa...
Tata Kelola Kolaboratif dalam Desain Kebijakan Publik. Studi Kasus Pelaksanaa...
 
Fakta, Isu dan SAran Penyempurnaan BP TAPERA
Fakta, Isu dan SAran Penyempurnaan BP TAPERAFakta, Isu dan SAran Penyempurnaan BP TAPERA
Fakta, Isu dan SAran Penyempurnaan BP TAPERA
 
Tata kelola kolaboratif. Menata Kolaborasi Pemangku Kepentingan
Tata kelola kolaboratif. Menata Kolaborasi Pemangku KepentinganTata kelola kolaboratif. Menata Kolaborasi Pemangku Kepentingan
Tata kelola kolaboratif. Menata Kolaborasi Pemangku Kepentingan
 
Pedoman kepemimpinan bersama
Pedoman kepemimpinan bersama Pedoman kepemimpinan bersama
Pedoman kepemimpinan bersama
 
Memudahkan upaya kolaborasi beragam pemangku kepentingan
Memudahkan upaya kolaborasi beragam pemangku kepentinganMemudahkan upaya kolaborasi beragam pemangku kepentingan
Memudahkan upaya kolaborasi beragam pemangku kepentingan
 
MAKALAH. Bekerja dari Rumah (working from home). Menuju Tatanan Baru Era Covi...
MAKALAH. Bekerja dari Rumah (working from home). Menuju Tatanan Baru Era Covi...MAKALAH. Bekerja dari Rumah (working from home). Menuju Tatanan Baru Era Covi...
MAKALAH. Bekerja dari Rumah (working from home). Menuju Tatanan Baru Era Covi...
 
Bekerja jarak jauh (telecommuting/Working from home/WFH). Konsep-Penerapan-Pe...
Bekerja jarak jauh (telecommuting/Working from home/WFH). Konsep-Penerapan-Pe...Bekerja jarak jauh (telecommuting/Working from home/WFH). Konsep-Penerapan-Pe...
Bekerja jarak jauh (telecommuting/Working from home/WFH). Konsep-Penerapan-Pe...
 
PRESENTATION. Public Lecture "Jakarta's Response to COVID 19: Strategy-Lesson...
PRESENTATION. Public Lecture "Jakarta's Response to COVID 19: Strategy-Lesson...PRESENTATION. Public Lecture "Jakarta's Response to COVID 19: Strategy-Lesson...
PRESENTATION. Public Lecture "Jakarta's Response to COVID 19: Strategy-Lesson...
 
Bekerja jarak jauh (telecommuting). Konsep, penerapan dan pembelajaran
Bekerja jarak jauh (telecommuting). Konsep, penerapan dan pembelajaranBekerja jarak jauh (telecommuting). Konsep, penerapan dan pembelajaran
Bekerja jarak jauh (telecommuting). Konsep, penerapan dan pembelajaran
 
LAPORAN. Memori Akhir Jabatan Koordinator Pelaksanaan Program Strategi Ketaha...
LAPORAN. Memori Akhir Jabatan Koordinator Pelaksanaan Program Strategi Ketaha...LAPORAN. Memori Akhir Jabatan Koordinator Pelaksanaan Program Strategi Ketaha...
LAPORAN. Memori Akhir Jabatan Koordinator Pelaksanaan Program Strategi Ketaha...
 
Laporan. Pelaksanaan Kegiatan Pelaksana Tugas Deputi Gubernur DKI Jakarta bid...
Laporan. Pelaksanaan Kegiatan Pelaksana Tugas Deputi Gubernur DKI Jakarta bid...Laporan. Pelaksanaan Kegiatan Pelaksana Tugas Deputi Gubernur DKI Jakarta bid...
Laporan. Pelaksanaan Kegiatan Pelaksana Tugas Deputi Gubernur DKI Jakarta bid...
 
Laporan. Pelaksanaan Kegiatan Kedeputian Gubernur DKI Jakarta bidang Tata Rua...
Laporan. Pelaksanaan Kegiatan Kedeputian Gubernur DKI Jakarta bidang Tata Rua...Laporan. Pelaksanaan Kegiatan Kedeputian Gubernur DKI Jakarta bidang Tata Rua...
Laporan. Pelaksanaan Kegiatan Kedeputian Gubernur DKI Jakarta bidang Tata Rua...
 
Presentation. Collaboration Towards A Resilient Jakarta
Presentation. Collaboration Towards A Resilient JakartaPresentation. Collaboration Towards A Resilient Jakarta
Presentation. Collaboration Towards A Resilient Jakarta
 
Pengenalan konsep saleh sosial dalam pembangunan sanitasi
Pengenalan konsep saleh sosial dalam pembangunan sanitasiPengenalan konsep saleh sosial dalam pembangunan sanitasi
Pengenalan konsep saleh sosial dalam pembangunan sanitasi
 
Suplemen HUD Magz Edisi 5 /2015. Kota BATAM Menyongsong MEA 2015
Suplemen HUD Magz Edisi 5 /2015. Kota BATAM Menyongsong MEA 2015Suplemen HUD Magz Edisi 5 /2015. Kota BATAM Menyongsong MEA 2015
Suplemen HUD Magz Edisi 5 /2015. Kota BATAM Menyongsong MEA 2015
 

Experimental Study on the Use of Human Urine for Selected Philippine Vegetable Crops: Assessment of Macronutrient Nutrient Content in Philippine Urine and Determination of Appropriate Urine Application Rates

  • 1. Experimental Study on the Use of Human Urine for Selected Philippine Vegetable Crops: Assessment of Macronutrient Nutrient Content in Philippine Urine and Determination of Appropriate Urine Application Rates R. Gensch*, A. Miso* and G..S. Itchon** * Sustainable Sanitation Center, Xavier University – Ateneo de Cagayan, Masterson Avenue, Manresa Heights, Cagayan de Oro, Philippines (E-mail: robert.gensch@web.de; annamiso@googlemail.com) ** Department of Preventive and Community Medicine, Jose P. Rizal School of Medicine, Xavier University – Ateneo de Cagayan, Corrales Avenue, Cagayan de Oro, Philippines (E-mail: gsijuly18@yahoo.com) Abstract To assess agricultural potential of human urine as a liquid fertilizer under Philippine conditions an experimental study was conducted to determine the average macronutrient (N,P,K) content of human urine and appropriate urine application levels for commonly planted vegetable crops: Petchay, Sweet Corn and Eggplant. The study was conducted in 3 study locations representing the 3 main Philippine regions: Luzon, Visayas. Mindanao. In each study area urine was collected from 10 different toilets and the average N,P,K content per study site and the countrywide average was determined. A randomized complete block design was used for agricultural experiments with 5 different treatments and 4 replications for each crop and study site. The 5 treatments include 3 urine application levels (75%, 100%, 125% of calculated optimum level that correspond to N-demand of plants), 1 treatment with application of synthetic fertilizer, and 1 treatment without urine/synthetic fertilizer application. The experimental variables observed were fresh marketable yield and plant height. The determined average N,P,K content in Philippine urine is N: 4.35 g/l, P: 0.4 g/l, K: 1.74 g/l. Of the 3 investigated urine levels, the 125% treatment showed best results in terms of marketable yield and plant height and can be attributed to the fact that the study was conducted during rainy season. Urine application with best results in plant height and marketable yield showed comparable results to synthetic fertilizer treatment, with either no significant difference or only slightly lesser yields. Compared with no fertilizer application the addition of urine significantly increased yield by 1.5-5 times, depending on plant type and study location. Application of urine as a fertilizer source can be recommended to increase agricultural production and may potentially substitute synthetic fertilizers. It is recommended to conduct larger-scale follow-up studies in order to consolidate existing data and to investigate potential differences during dry season. Keywords Sustainable Sanitation, Ecological Sanitation, Urine, Agricultural Reuse, Urine Diversion Dehydration Toilets, Nutrients INTRODUCTION Human urine is a valuable source of nutrients and properly sanitized urine can be considered an effective liquid fertilizer in agricultural production (RICHERT et al. 2010). Substantial portion of the soluble elements in urine are essential plant nutrients such as Nitrogen (N), Phosphorus (P) and Potassium (K). The nutrient amount in human urine is dependent on the local diet and almost all of the essential plant nutrients (N, P, and K) consumed with the daily food intake leave the human body unchanged (JOENSSON et al. 2004). Urine contains most of these macronutrients as well as smaller fractions of micronutrients in a plant available form and is particularly rich in Nitrogen. Urine can, therefore, be considered a well-balanced nitrogen-rich liquid fertilizer. Ecological Sanitation (ecosan) recognizes the potential of urine as a vast largely untapped valuable
  • 2. resource that can help in the mitigation of poverty, malnutrition and food insecurity particularly at a household level by providing a liquid fertilizer source that is immediately available and free, regardless of logistic and economical resources. The term ecosan is often associated with the so- called Urine Diversion Dehydration Toilet (UDDT), which is the most popular and most widely used ecosan solution in the Philippines. Due to the different properties, urine and faeces are collected separately in UDDTs and after storage of one month urine can be considered safe for use in agriculture (WHO 2006). However, since the nutrient content in human urine is very much dependent on the local diet it can vary greatly between countries and regions. Up to the present time, there is neither reliable data available on the nutrient content in human urine in the Philippines nor are there any recommendations available on appropriate urine application levels for different vegetable crops under Philippine conditions. While the ecosan community is promoting the re-use of urine in agriculture, there is no scientific evidence on the response of different crops to different application levels of urine. Such information would greatly support the further spread of more sustainable sanitation solutions like ecosan in the Philippines and would allow for the development of sound guidelines for the agricultural community on the use of urine as a liquid fertilizer in vegetable crop production under Philippine conditions and thus, make its agricultural use more attractive to farmers. In order to address this knowledge gap this study will therefore determine the average amount of macronutrients (N,P,K) in source-separated and 1-month old, stored human urine coming from 3 different representative areas in the Philippines (La Union, Bayawan, Cagayan de Oro). It will furthermore determine appropriate urine application rates based on existing recommendations for synthetic fertilizers for 3 different commonly planted vegetable crops, namely Sweet Corn, Petchay and Eggplant in the 3 different study areas. The findings of this study will enter into a national Philippine guideline document on the use of urine as a liquid fertilizer in agriculture. METHODS The study was conducted from February 2010 until January 2011 simultaneously in three (3) different study sites in the Philippines namely La Union, Bayawan and Cagayan de Oro representing the three (3) main Philippine regions: Luzon, Visayas and Mindanao. An amount of around 1000 liters of urine per study area was collected from a minimum of 10 different household and/or school Urine Diversion Dehydration Toilets (UDDT) per study location. The urine was stored for 1 month in a 1000 liter storage container for hygienization purposes as recommended by WHO (WHO 2006). Randomly chosen urine samples from five (5) out of the ten (10) toilets as well as three (3) samples from the homogenously mixed urine were analyzed in terms of their Nitrogen (N), Phosphorus (P) and Potassium (K) content. Based on the results the average N, P, K content for each study site as well as the average for all the research areas was determined. A randomized complete block design was used for the agricultural experiments with five (5) different treatments and four (4) replications for each of the three (3) planted vegetable crops (Sweet Corn, Petchay, Eggplant) in each study site. The planting bed size was 5m x 1.5m for Eggplant and Sweet Corn and 2.5m x 1m for Petchay with 20 plants/bed, planted in 2 rows, to imitate actual field conditions as far as possible. The five (5) treatments include three (3) treatments with different urine application levels, one (1) treatment with application of synthetic fertilizer using existing synthetic fertilizer recommendations and one (1) control without any urine or synthetic fertilizer application. The three (3) urine treatments are 75%, 100% and 125% of the theoretically calculated optimum urine application level that correspond to the N-demand of the plants, based on existing synthetic fertilizer
  • 3. recommendations from the Philippine Allotment Garden Manual (PUVeP 2008) and initially determined average N, P, K content in Philippine urine. Standard operating procedures (PUVEP 2008) for Eggplant, Sweet Corn and Petchay were followed with basal fertilizer application (at transplanting) for all three (3) vegetable crops and additional side dressings one (1) week and three (3) weeks after transplanting for Eggplant and side dressings one (1) week and four (4) weeks after transplanting for Sweet Corn. Prior to application the identified urine amounts were diluted with water at a 1:1 ratio. In order to draw conclusions for later interpretation of the data, soil samples were taken from experimental areas and analyzed as regards N, P, K content. The research variables used were the fresh weight of the marketable yield at harvest (with one harvest for Petchay and Sweet Corn and the sum of three (3) consecutive harvests for Eggplant) as well as the height of the plants for Sweet Corn and Eggplant at transplanting/basal fertilizer application, at first and second side dressing and at the time of harvest. RESULTS Urine analysis The results from the laboratory analysis determining the N, P, K content of the urine samples from the different study sites can be found in Table 1. It also included the calculated average N,P,K content in the urine per study location. The average N, P, K content is based on the results from the mixed samples in each study location. The only exemption is Bayawan. Here the average P content is based on the individual collected samples since the P-content of the mixed sample is significantly lower than those from the individual samples. It is assumed that this is because the urine has not been mixed properly before samples were taken and that part of the available P in the mixed urine already settled at the bottom of the 1000-liter container. Table 1. Nitrogen, Phosphorus and Potassium content (in %) in analysed urine samples and calculated average per study site Location N (%) P (%) K (%) CDO sample (Elementary School) 0.260 0.027 0.251 CDO sample (Chapel) 0.313 0.015 0.260 Cagayan de Oro CDO sample (Elementary School) 0.284 0.020 0.244 CDO sample (High School) 0.339 0.014 0.171 CDO sample (Hospital) 0.305 0.012 0.037 CDO mixed sample 1 0.448 0.048 0.162 CDO mixed sample 2 0.437 0.034 0.180 CDO mixed sample 3 0.437 0.037 0.185 Cagayan de Oro - Average (based on mixed samples) 0.441 0.039 0.176 La union sample 1 (Household) 0.342 0.014 0.154 La union sample 2 (Household) 0.522 0.033 0.143 La union sample 3 (Household) 0.072 0.006 0.102 La Union La union sample 4 (Household) 0.356 0.014 0.086 La union sample 5 (Household) 0.06 0.007 0.058 La Union mixed sample 1 0.469 0.046 0.176 La Union mixed sample 2 0.490 0.066 0.157 La Union mixed sample 3 0.478 0.051 0.180 La Union - Average (based on mixed samples) 0.479 0.054 0.171 Bayawan sample 1 (Household) 0.178 0.013 0.144 Ba ya Bayawan sample 2 (Household) 0.079 0.023 0.165
  • 4. Bayawan sample 3 (Household) 0.207 0.024 0.155 Bayawan sample 4 (Household) 0.037 0.026 0.147 Bayawan sample 5 (Household) 0.276 0.045 0.028 Bayawan mixed sample 1 0.341 0.008 0.195 Bayawan mixed sample 2 0.344 0.010 0.171 Bayawan mixed sample 3 0.469 0.009 0.160 Bayawan - Average (of mixed samples, except for P. 0.385 0.026 0.175 Average P concentration taken from individual samples) The corresponding average macronutrient (N,P,K) content per study location and the Philippine average (in g/liter) can be found in Table 2. Table 2. Calculated average N,P,K content (in g/liter) per study area and Philippine average Location N (g/liter) P (g/liter) K (g/liter) Cagayan de Oro 4.41 0.40 1.76 La Union 4.79 0.54 1.71 Bayawan 3.85 0.26 1.75 Philippine average 4.35 0.40 1.74 The urine application rates for Sweet Corn, Eggplant and Petchay have been determined based on the average macronutrient content result for each study area above and the existing synthetic fertilizer recommendations of the Allotment Garden Manual (PUVeP 2008). Since the N content in human urine is considerably higher than the P and K content and to avoid over-application of urine the calculations are based on the N-content of the urine (4.41g/liter in Cagayan de Oro, 4.79 g/liter in La Union, and 3.85 g/liter in Bayawan respectively). Table 3. Calculated urine application rates for Petchay, Sweet Corn and Eggplant for each of the 3 study areas Application Synthetic fertilizer Treatment (% Recommended amount of recommendations following of assumed urine to be applied (liter/hill) SOP* (corresponding optimal nutrient CDO La Union Bayawan nutrient content in g/hill) application) Sweet Corn 1st 7.0 g/hill Complete 14-14-14 75 0.17 0.15 0.20 Application (N: 0.98, P: 0.43, K: 0.81) 100 0.22 0.20 0.26 (Basal) 125 0.27 0.26 0.33 nd 2 4.0 g/hill Urea 75 0.31 0.29 0.36 Application (N: 1.84) 100 0.42 0.38 0.48 (1 WAT) 125 0.52 0.48 0.60 rd 3 7.0 g/hill Urea 75 0.54 0.50 0.63 Application 4.0 g/hill MOP 100 0.73 0.67 0.84 (4 WAT) (N: 3.22, K: 1.99) 125 0.91 0.84 1.05 Eggplant 1st 10.0 g/hill DAP 75 0.31 0.28 0.35 Application (N: 1.80, P: 2.02) 100 0.41 0.38 0.47 (Basal) 125 0.51 0.47 0.59 nd 2 3.9 g/hill Urea 75 0.31 0.28 0.35
  • 5. Application 5.8 g/hill MOP 100 0.41 0.38 0.47 (1 WAT) (N: 1.79, K: 2.89) 125 0.51 0.47 0.59 rd 3 7.9 g/hill Urea 75 0.62 0.56 0.71 Application 5.8 g/hill MOP 100 0.82 0.76 0.94 (3 WAT) (N: 3.63, K: 2.89) 125 1.02 0.94 1.18 Petchay 1st 10.0 g/hill DAP 75 0.31 0.28 0.35 Application (N: 1.80, P: 2.02) 100 0.41 0.38 0.47 (Basal) 125 0.51 0.47 0.59 (WAT: Weeks after Transplanting, DAP: Diammonium Phosphate, MOP: Muriate of Potash) Soil analysis Table 4. N,P,K content in the soil in Cagayan de Oro, La Union & Bayawan Location N (g/liter) P (g/liter) K (g/liter) Cagayan de Oro 0.05 0.007 (73ppm) 0.04 (406ppm) La Union 0.06 0.03 (318ppm) 0.04 (374ppm) Bayawan 0.10 0.02 (233ppm) 0.04 (438ppm) Agricultural experiments The agricultural field trial with 3 different urine level treatments (75%, 100%, 125% of the calculated urine application optimum), 1 synthetic fertilizer application treatment and 1 control (without any urine or synthetic fertilizer application) showed the following results for the marketable yield of Petchay, Eggplant and Sweet Corn in the respective 3 study locations: Table 5. Average marketable yield (kg/bed) for Petchay, Sweet Corn and Eggplant in Cagayan de Oro, La Union & Bayawan T1 T2 T3 C1 C2 (urine (urine (urine (control w/o (control application application application urine/ with with 75% of with 100% of with 100% of synthetic synthetic calculated N calculated N calculated N fertilizer fertilizer optimum) optimum) optimum) application) application) Petchay Cagayan de 1.830 2.202 2.411 0.511 2.513 Oro La Union 0.611 0.608 0.588 0.261 0.660 Bayawan 2.375 2.425 2.613 0.925 2.728 Sweet Corn Cagayan de 8.276 8.341 8.879 5.056 8.839 Oro La Union 3.572 3.641 4.186 2.103 4.679 Bayawan 6.700 7.125 7.350 5.100 7.775 Eggplant (after 3rd harvest) Cagayan de 9.186 12.594 18.070 3.506 16.205 Oro La Union 8.261 8.047 8.593 5.634 9.808 Bayawan 5.250 5.625 6.675 1.425 6.175
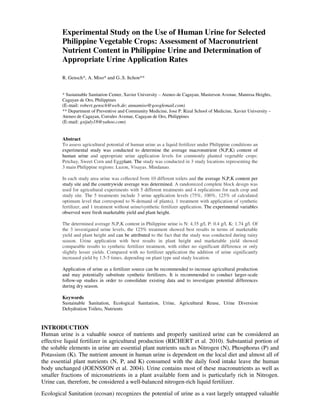
  • 6. Average marketable yield - Petchay Average marketable yield - Petchay Average marketable yield - Petchay (CDO) (La Union) (Bayawan) 3 3 3 2.728 2.513 2.613 2.411 2.375 2.425 2.5 2.202 2.5 2.5 2 1.83 2 2 kg/bed kg/bed kg/bed 1.5 1.5 1.5 0.925 1 1 1 0.611 0.608 0.588 0.66 0.511 0.5 0.5 0.261 0.5 0 0 0 T1 T2 T3 C1 C2 T1 T2 T3 C1 C2 T1 T2 T3 C1 C2 Average marketable yield – Sweet Average marketable yield – Sweet Average marketable yield – Sweet Corn (CDO) Corn (La Union) Corn (Bayawan) 10 10 10 8.879 8.839 9 8.276 8.341 9 9 7.775 8 8 8 7.125 7.35 6.7 7 7 7 6 6 6 kg/bed kg/bed kg/bed 5.056 5.1 4.679 5 5 4.186 5 3.572 3.641 4 4 4 3 3 2.103 3 2 2 2 1 1 1 0 0 0 T1 T2 T3 C1 C2 T1 T2 T3 C1 C2 T1 T2 T3 C1 C2 Average marketable yield – Eggplant Average marketable yield – Eggplant Average marketable yield – Eggplant (CDO) (La Union) (Bayawan) 20 18.07 20 20 18 16.205 18 18 16 16 16 14 12.594 14 14 12 12 12 kg/bed kg/bed kg/bed 9.186 9.808 10 10 8.261 8.047 8.593 10 8 8 8 6.675 6.175 5.634 5.25 5.625 6 6 6 3.506 4 4 4 1.425 2 2 2 0 0 0 T1 T2 T3 C1 C2 T1 T2 T3 C1 C2 T1 T2 T3 C1 C2 The measured height at different planting stages for Eggplant and Sweet Corn in each of the 3 study areas is reflected in the following graphs: Average plant height of Eggplant (CDO) Average plant height of Sweet Corn (CDO) 90 250 C2 T3 80 C2 T2 T3 T1 70 200 C1 T1 T2 60 C1 150 50 cm cm 40 100 30 20 50 10 0 0 basal 1st side dressing 2nd side dressing harvest basal 1st side dressing 2nd side dressing harvest
  • 7. Average plant height of Eggplant (La Union) Average plant height of Sweet Corn (La Union) 70 120 C2 C2 T3 T3 60 100 T2 T2 T1 T1 50 C1 80 C1 40 cm cm 60 30 40 20 20 10 0 0 basal 1st side dressing 2nd side dressing harvest basal 1st side dressing 2nd side dressing harvest Average plant height of Eggplant (Bayawan) Average plant height of Sweet Corn (Bayawan) 80 250 C2 C2 70 T3 T3 200 T2 60 T1 T2 T1 50 C1 150 C1 cm cm 40 100 30 20 50 10 0 0 basal 1st side dressing 2nd side dressing harvest basal 1st side dressing 2nd side dressing harvest DISCUSSION N,P,K content in urine The results of the study show that Philippine urine contains considerable amounts of N, P and K and is particularly rich in Nitrogen. For the 3 study areas there are no significant differences in the N and K content. However for the P content there are significant variations among the 3 study areas. Since the P content is the only significant deviation this might be explained with the fact that part of the P content tends to precipitate at the bottom of the urine container and it is assumed that the urine might not have been mixed properly during the sample taking. Urine application rates (Cagayan de Oro) Petchay: Out of the 3 urine treatments the T3 (125% of the calculated urine optimum) treatment shows the best result with regard to the average marketable yield. The average yield with the 125% urine treatment is comparable to the use of synthetic fertilizer. T test shows no significant difference in average marketable yield using 125% urine application and using synthetic fertilizer. Application of synthetic fertilizer as well as all 3 urine treatments results in significantly higher yields than no fertilizer application (control). The average yield of the synthetic fertilizer treatment and the 125% urine treatment is around 5 times as much as the control (C1). Therefore, this study is able to show that the use of 125% urine is able to produce comparable marketable yield in Petchay as using synthetic fertilizer. Sweet Corn: The comparison of average yields of T1, T2, T3 (75%, 100%, and 125% urine, respectively) shows no significant difference using the t-test. Based on the results obtained, 75%, 100% and 125% urine concentrations are equally effective for use in Sweet Corn. However, based on the trend seen, 125% urine concentration seems to produce the best result in terms of yield. Comparing the results of the application of 125% urine treatment (T3) to the use of synthetic fertilizer also shows no statistically significant difference. This shows that the use of 125% urine on Sweet Corn is as effective as using synthetic fertilizer. Comparison of C1 and C2, and C1 with the 3 urine treatments is significant. Application of synthetic fertilizer as well as all 3 urine treatments results in significantly higher yields than no fertilizer application (control). The average
  • 8. yield of the synthetic fertilizer treatment as well as the 3 urine treatments is around twice the amount compared to the control (C1). As for the average plant height at harvest T1, T2, T3 and C2 show very similar results and the results show no statistical difference using the t test. Use of 75%, 100%, or 125% of the calculated urine optimum will produce the same height at harvest as use of synthetic fertilizer. C1 (control), however, resulted in significantly shorter plants compared to all the other groups. Eggplant: Among the urine treatments the best result is shown by T3 (125% urine application), which is similar to the C2 (synthetic fertilizer) application. The difference between T3 and C2 is not significant using the t-test, which means that the use of 125% urine treatment will produce comparable results to the use of synthetic fertilizer. Application of synthetic fertilizer as well as all 3 urine treatments resulted in significantly higher yields than no fertilizer application (control). The average yield of the synthetic fertilizer treatment and the 125% urine treatment is around 5 times as much as the control (C1). As for the average plant height the best result is shown by T3 followed by C2. T3 and C2 results show no statistical difference, meaning that the T3 treatment will produce comparable results to the use of synthetic fertilizer in terms of average height of plant at harvest. Urine application rates (La Union) For Petchay the best result for average yield is exhibited by C2. Among the urine treatment groups, it is exhibited by T1. There is no significant difference between C2 and T1, between C2 and T2, and between C2 and T3 results using t-test. Furthermore, there are no significant differences between T1 and T2, T2 and T3, and T1 and T3. There is a slightly significant difference, however, between T3 and C2. C1 (control) compared to all the treatment groups and C2 shows highly significant differences with a considerably lesser yield than all other treatments. The average yield of the synthetic fertilizer treatment as well as the 3 urine treatments is around twice the amount compared to the control (C1). For Sweet Corn the best result for average yield is shown by C2. Among the urine treatment groups, it is shown by T3 with no significant difference between T3 and C2. There are significant differences seen between T1 and T3 and T2 and T3. C1 (control) compared to all treatment groups and C2 shows highly significant differences with a considerably lesser yield than all other treatments. The average yield of the synthetic fertilizer treatment as well as the 3 urine treatments is around twice the amount compared to the control (C1). Best results in plant height are shown by C2. Among the treatment groups, best plant height result is shown by T3. There are no significant differences shown comparing C2 to T3, C2 to T2 and C2 to T1. However, the difference is significant comparing T1 and T2, T1 and T3, and T1 and C2. C1 (control) compared to all the treatment groups and C2 shows highly significant difference. For Eggplant T3 shows the best results for the average yield weight. Using t-test, the difference is not significant compared to mean weight results at harvest of T1, T2, T3 and C2. Results of C1, however, are highly significant compared to T1, T2, T3 and C2, with considerably lesser average yields. The average yield of the synthetic fertilizer treatment as well as the 3 urine treatments is nearly twice the amount compared to the control (C1). Best results in plant growth are exhibited by T3 in all stages of the study and at harvest. Using t-test, the result for plant height is highly significant compared to T1, slightly significant compared to T2 and highly significant compared to C1. T–test further shows there is no significant difference in growth rates between T3 and C2. Urine application rates (Bayawan) For Petchay best result for the average yield is shown by C2. Among the urine treatment groups, it is shown by T3. There is no significant difference shown between C2 and T3. There is a slight statistically significant difference between C2 and T2, C2 and T1. C1 (control) shows a significant difference when compared to all treatment groups and C2. Application of synthetic fertilizer as well as all 3 urine treatments results in significantly higher yields than no fertilizer application (control). The average yield of the synthetic fertilizer treatment as well as the 3 urine treatments is around three times the amount compared to the control (C1).
  • 9. For Sweet Corn the best result for the average yield is shown by C2. Among the urine treatment groups, T3 shows the best result, followed by T2, and then T1. There is no significant difference between C2 and T3. However, there are significant differences between C2 and T1, and between C2 and T2. There are statistically significant differences between C1 (control) and all the urine treatment groups and between C1 and C2. Application of synthetic fertilizer as well as all 3 urine treatments results in significantly higher yields than no fertilizer application (control). The average yield of the synthetic fertilizer treatment as well as the 3 urine treatments is around 1.5 times the amount compared to the control (C1). Best results in plant height are shown by C2. Among the treatment groups, best plant height result is shown by T3. There are only slight significant differences shown comparing C2 to T3, C2 to T2 and C2 to T1. C1 (control) compared to all the treatment groups and C2 shows highly significant difference. For Eggplant the best results are shown by C2 in terms of average marketable yield. Among the urine treatment groups, T3 shows the best result, followed by T2 and then T1. There is no significant difference between the T3 and C2. However, there are significant statistical differences between T3 and T1 and T3 and T2. C1 (control) shows a significant difference in comparison to all the urine treatment groups and in comparison to C2. Application of synthetic fertilizer as well as all 3 urine treatments results in significantly higher yields than no fertilizer application (control). The average yield of the synthetic fertilizer treatment as well as the 3 urine treatments is around four times the amount compared to the control (C1). Summary Out of the 3 investigated urine treatment groups in the majority of cases T3 (125%) showed the best results in terms of average marketable yield and plant height in the 3 study areas. One of the possible reasons might be that due to a delay in the initial urine collection the study was conducted during the rainy season and a certain amount of the applied urine nutrients might have been washed out during the rainfall events. In the majority of cases the urine application with the best results in plant height and marketable yield showed comparable results to the synthetic fertilizer treatment, with no or only slight significant difference. It shows that urine can be considered as effective as synthetic fertilizers. The increase in yield that can be attributed to the application of urine as well as application of the synthetic fertilizer treatment in comparison to no urine or synthetic fertilizer application (negative control) is between 2-5 times for Petchay, around twice as much for Sweet Corn, and 1.5-5 times for Eggplant. Among the 3 study areas considerable differences in the overall average yield for the 3 planted vegetable crops have been observed that cannot be fully explained. The analysis of the nutrient content in the soil from the 3 study areas shows no significant differences (except for the P content in CDO which is comparatively low, and the N-content in Bayawan which is comparatively high) and allows no further conclusions that would explain the differences in the overall yield. The differences in the yield may be attributed the other local site conditions such as available sunlight, water, and general soil conditions. Despite the differences in the overall yields and plant heights the general trends and results per treatment, however, remain comparable. CONCLUSIONS Due its high macronutrient content, particularly N, urine can be considered a valuable liquid nutrient source and a potential synthetic fertilizer substitute in agricultural production. The average N, P, K content in Philippine urine is 4.35 g/l of N, 0.4 g/l of P, and 1.74 g/l of K with a N,P,K ratio of 11/1/1.5. The application of urine that corresponds to the actual N requirements of the plants results in similar yields and plant heights as those grown with synthetic fertilizers. Compared with no fertilizer application the addition of urine in quantities corresponding to the plant needs can significantly
  • 10. increase the marketable yield by 1.5 to 5 times, depending on the study location and the crops planted. Best fertilizing results with urine were achieved with applying a urine rate that corresponds to 125% of the calculated optimum N requirements of the plants based on existing synthetic fertilizer recommendations. However since the study was conducted during the rainy season this slightly higher amount might be partly attributed to nutrient losses during periodic rainfall events. RECOMMENDATIONS From an agricultural point of view the application of urine as a liquid fertilizer source is recommended to increase agricultural production at only minimal costs. An application of urine corresponding to around 100% to 125% of the calculated optimum N requirements of the planted crops is recommended and the amount of urine applied during the rainy season can be slightly increased since it is assumed that some of the nutrients might be washed out during periodic rainfalls. It is furthermore suggested to conduct follow-up studies in the same study locations in order to further consolidate the existing data and particularly to investigate potential differences with urine application during the dry season. References JOENSSON, H., RICHERT A., VINNERAAS, B., SALOMON, E. (2004): Guidelines on the Use of Urine and Faeces in Crop Production, Stockholm, Stockholm Environment Institute (SEI), EcoSanRes Publication Series, Report 2004-2 PUVEP (2008): Philippine Allotment Garden Manual with an Introduction to Ecological Sanitation, Peri-Urban Vegetable Project, Xavier University College of Agriculture, Cagayan de Oro, Philippines, http://puvep.xu.edu.ph/publications/AG%20Booklet_final.pdf RICHERT, A., GENSCH, R., JOENSSON, H., STENSTROEM, T.-A., DAGERSKOG, L. (2010): Practical Guidance on the Use ofUrine in Crop Production: EcoSanResProgramme, Stockholm Environment Institute, Stockholm, Sweden WHO (2006): Guidelines for Safe Use Wastewater, Excreta and Greywater, Volume 4: Excreta and Greywater Use in Agriculture, Geneva, World Health Organisation