Mastering MySQL Database Architecture: Deep Dive into MySQL Shell and MySQL R...
Principles of soft matter dynamics
1. Chapter 7
Dynamics at Fluid Solid Interfaces: Porous
Media and Colloidal Particles
Abstract This chapter could be entitled “molecular motions in complex media” as
well. The point is that the systems of interest can be defined by the existence of
fluid–solid interfaces. Surface-related phenomena are therefore of central interest.
There is an endless list of examples belonging to this category in principle.
Emphasis will be laid on porous glasses, fine-particle agglomerates, biopolymer
solutions, lipid bilayers, biological tissue, etc. The predominant purpose of this
chapter is to elaborate a well-classified scheme of the key mechanisms determining
molecular dynamics in the presence of fluid–solid interfaces. This includes adsorp-
tion and exchange kinetics, translational and rotational diffusion, and liquid/vapor
coexistence phenomena. Effects due to fluid–wall interactions on the one hand and,
on the other hand, owing to geometric confinement in mesoscopic pore spaces will
thoroughly be discriminated.
7.1 Survey and Some Definitions
Dynamics in porous media is a multi-faceted field of confusing complexity. Before
treating a number of selected scenarios typical for this application field, let us
therefore begin with a list of fundamental definitions and distinctions.
The dynamic phenomena treated so far were predominantly characterized either
by coherent transport (Chap. 4) or collective relaxation modes (Chaps. 5 and 6).
None of these properties apply to the systems of interest in this chapter. We are rather
dealing with motions of individual molecules of fluids in varying environments and
subjected to interactions with surfaces of pore walls or colloid particles. We thus
arrive at the least concerted type of molecular motions. Unlike the corset effect
on polymer dynamics discussed in Sect. 5.4.8, this implies that we are now restricting
ourselves to small molecules with little or no internal degrees of motional freedom.
The typical medium of interest in the present context is a fluid being either exclu-
sively in the liquid phase or coexisting in liquid and gaseous phases. The question is
how the bulk dynamic properties of the fluid are changed, owing to the presence of
R. Kimmich, Principles of Soft-Matter Dynamics: Basic Theories, Non-invasive
Methods, Mesoscopic Aspects, DOI 10.1007/978-94-007-5536-9_7,
# Springer Science+Business Media Dordrecht 2012
549
2. solid surfaces and a (possibly random) pore space topology. The length scale of
interest is usually specified as “mesoscopic” which ranges from atomistic lengths up
to micrometers.
7.1.1 Characterization of Pore Spaces
Before proceeding, let us first resume the discussion led in Sect. 4.9.1, where a
number of basic parameters for the characterization of pore spaces have been defined
[1]. In the following, we will speak of “pore spaces” irrespective of whether this
refers to a compact porous medium or a bed of particles or particle agglomerates in
general. As the most elementary quantity characterizing confinements, we know
already the porosity, that is, the ratio of the pore-space volume and the volume of
the total system:
P ¼
Vpores
Vtotal
(7.1)
As a characteristic measure of the topological pore-space constraints, the tortuos-
ity has been introduced in Sect. 4.9.1. This quantity is sometimes defined as the mean
ratio of the shortest path length, ‘i; f , and the straight distance between an initial
starting and a finishing point, ri; f (see Fig. 7.1):
t ¼
‘i; f
ri; f
( )
(7.2)
Where ‘i; f is the chemical distance between the starting and finishing points.
Since we will be dealing with diffusion and relaxation problems in the following,
we will prefer another definition which is in frequent use as well: The diffusive
tortuosity
tdiff ¼
D0
Deff
(7.3)
is the quotient of the diffusion coefficients effective in bulk, D0, and under pore-
space confinement, Deff , on a length scale exceeding the correlation length (see
below). This definition is of a more practical nature and should not be confused with
that given in Eq. (7.2).
Another quantity we have encountered before is the correlation length of a
macroscopically isotropic pore space. This parameter characterizes the decay of
the spatial pore-space correlation function. Considering pairs of positions R1 and R2
in the sample, the following correlation function can be defined:
G rð Þ ¼ w R1ð Þw R2ð Þh i ¼ wð0Þw rð Þh i (7.4)
550 7 Dynamics at Fluid Solid Interfaces: Porous Media and Colloidal Particles
3. The position R1 is assumed inside the pore space whereas R2 can be anywhere
within the sample, inside or outside of the pore space. r ¼ R2 À R1 is the distance
vector between the two positions. The function w Rð Þequals 1 if the volume element
around R is located in the pore space and vanishes otherwise. The angle brackets
represent an average over an ensemble of position pairs. On this basis, a correlation
length can be defined by
x ¼ Gð0Þ À G 1ð Þ½ ŠÀ1
ð1
0
GðrÞ À G 1ð Þ½ Šdx
¼ 1 À P½ ŠÀ1
ð1
0
GðrÞ À P½ Šdx ð7:5Þ
(where we formally assume an infinitely extended sample). x is an arbitrary
coordinate and line-integration axis. The direction does not matter since the
medium is assumed to be isotropic in this respect. On length scales much larger
than x, the pore network adopts homogeneous coarse-grain properties.
Note that a somewhat different definition of the correlation length is often used
in the frame of percolation theory as already mentioned in Sect. 4.9.1. Percolation
theory [3] is of a largely mathematical character but models many features of
random pore networks. Percolation clusters can therefore be taken as a paradigm
for random pore spaces especially with respect to transport. We have encountered
this strategy in Chap. 4 at diverse occasions.
Fig. 7.1 Scanning electron micrograph of a typical porous silica glass (product name VitraPor #5,
nominal pore size 1–1.6 mm) (Reproduced from Ref. [2] with kind permission of # Wiley-VCH
2009)
7.1 Survey and Some Definitions 551
4. 7.1.2 Adsorption Versus Restricted-Geometry Effects
Spatial restrictions of fluids and interactions with surfaces give rise to a rich variety
of dynamic phenomena which are absent under bulk conditions. In the following,
adsorption and restricted-geometry effects will be distinguished as the key to the
understanding of molecular dynamics in such systems. Actually, this differentiation
has already been discussed in Sect. 5.4.8.3 in the context of the corset effect on the
dynamics of mesoscopically confined polymers.
Adsorption of fluid molecules matters if the interaction with solid surfaces is
attractive so that molecules tend to reside temporarily in bound (and possibly
ordered) states at the surfaces. The binding energy, that is, the strength of the
adsorption effect, is a matter of the mutual interaction affinity of adsorbate and
surface chemical groups. In the following, we will roughly distinguish polar/polar
and nonpolar/polar interactions as classes with antithetic tendencies in this respect.
Even in the complete absence of adsorption, that is, if the fluid/wall interaction is
inert or repulsive, purely geometrical effects due to pore-space restrictions and
tortuosity are expected. Phenomena of this sort are particularly evident in the
context of translational diffusion.
7.1.3 Categories of Restricted-Geometry Effects
on Translational Diffusion
In cases where fluid/wall interactions are neutral or even repulsive, adsorption will
be irrelevant. Diffusion on a length scale approaching the pore dimension will then
be subject to normal modes as solutions of Fick’s second law, Eq. (2.167), with
reflecting-boundary conditions at the pore walls. The most elementary (and instruc-
tive) example of this sort is one-dimensional diffusion between such barriers [4].
In principle, we have already encountered an application of this category in Sect.
6.8.3: diffusion of structural defects between reflecting barriers [5]. Compare also
the discussion of the different potentials considered for polymer confinement in the
context of Fig. 5.31.
In three-dimensional pore spaces, the shape of the pores becomes important. The
boundary conditions give then rise to characteristic diffraction-like patterns [6] of
the incoherent dynamic structure factor provided that the root mean-square dis-
placement matches the dimensions of the confining medium. Simple pore
geometries such as cubic, spherical, or cylindrical shapes have been evaluated in
this sense. In the case of NMR applications, diffusion modes in porous media must
be analyzed in combination with surface relaxation, that is, absorbing boundary
conditions [7–9]. Note that the root mean-square displacements probed by NMR
diffusometry usually exceed mesoscopic pore dimensions by far, so that diffraction-
like patterns will not arise in this instance.
552 7 Dynamics at Fluid Solid Interfaces: Porous Media and Colloidal Particles
5. On the length scale of the so-called scaling window, that is, between the pore
dimension and the correlation length, transport is characterized by power laws,
provided that the pore space is of a random nature (compare Sects. 2.5.2 and 4.9.3).
If fractal or fractal-like properties can be attributed to the geometry, subdiffusive
mean squared displacement laws
r2
/ tk
(7.6)
are expected in this regime with 0 k 1. The origin of this anomaly is the
tortuosity of the pore space restricting the allowed particle trajectories. The crucial
parameter of Eq. (7.6), the exponent k, in a sense reflects the pore-space structure.
Provided that the pore space can be described as a fractal, this exponent can be
expressed at least approximately in terms of the fractal dimension df according to
the Alexander/Orbach conjecture k ¼ 4 3dfð Þ= [10, 11]. The superdiffusive coun-
terpart of Eq. (7.6), that is, exponents k 1, arises for hydrodynamic dispersion in
random pore spaces. This phenomenon has already been discussed in Sect. 4.9.3.
For the sake of completeness, the corset effect described in Sect. 5.4.8 should be
mentioned as a further category of restricted-geometry effects. It refers to polymers
confined in mesoscopic pores with inert or repulsive walls. Anomalies are attributed
in this case to the finite size of the system in the sense of statistical physics. The
corset effect reveals itself by slowed-down and restricted chain dynamics of
macromolecules.
7.1.4 Rotational Versus Translational Diffusion
As frequently exemplified in the previous chapters and discussed in the introduc-
tion, Chap. 1, molecular dynamics has two principal forms of appearance: transla-
tional and rotational diffusion. Translational displacements of fluid molecules are
affected by obstruction due to any sort of obstacles, trapping in dead ends of the
pore space, adsorption at solid surfaces, and exchange between liquid and vapor
phases. On the other hand, the rotational counterpart, molecular reorientation by
thermal motions, at first sight senses solely fluid/surface interactions, while geo-
metrical restrictions seem to be irrelevant. As will be demonstrated later, this is not
entirely true. As soon as anisotropic adsorption at surfaces plays a significant role,
there will be an intimate interconnection of translations along surfaces of non-
planar topology and reorientations of fluid molecules [12]. The mechanism to
which we are alluding is termed reorientation mediated by translational
displacements (RMTD).1
1
A first application of this process was already mentioned at the end of Sect. 6.8.4 as a mechanism
competing with shape fluctuations of lipid vesicles.
7.1 Survey and Some Definitions 553
6. 7.1.5 Fluid Phases and the Intricacy of the Term “Exchange”
In the presence of solid surfaces of saturated pore spaces, one often subdivides the
confined liquid crudely in two phases, namely, adsorbed and free as illustrated in
Fig. 7.2. Synonymously, the latter is often referred to as bulk-like, a term
anticipating practically the same properties as in bulk as concerns molecular
dynamics (but not necessarily with respect to thermodynamics). Molecular motions
in the adsorbed phase are expected to be slowed done relative to the free phase as a
consequence of topological restrictions and (possibly anisotropic) adsorbate/wall
interactions. An experiment-based distinction of bulk-like and adsorbed fluid
phases is possible with regard to the different freezing temperatures in the two
phases: At that level, the bulk-like phase can be defined by a freezing temperature
significantly above that of the adsorbed phase. Experimentally, this distinction has
been demonstrated in numerous reports [13–15], where frozen and unfrozen phases
can simply be discriminated by the enormous differences of the NMR linewidths or
of the translational diffusivities. The latter criterion will be exemplified in
Sect. 7.4.2.
Molecular exchange between the two phases is a matter of thermal activation.
This gives rise to interesting reaction/diffusion phenomena where the term “reac-
tion” refers to adsorption/desorption processes. A striking example to be described
in detail further down is bulk-mediated surface diffusion (BMSD) [16–19]: Adsor-
bate molecules are effectively displaced along solid surfaces by desorption/
readsorption cycles with intermittent displacements in the bulk-like phase.
Fig. 7.2 Schematic representation of the two-phase model of fluids confined in a saturated solid
matrix. The fluid adsorbed at surfaces is discriminated from the bulk-like phase. Molecular
mobilities within and exchange kinetics between these phases determine the dynamics of fluid
molecules. In unsaturated pore spaces, vapor as a third phase needs to be taken into account
554 7 Dynamics at Fluid Solid Interfaces: Porous Media and Colloidal Particles
7. The fact that the present discussion associates terms like adsorption, desorption,
and reaction with diffusion indicates the intricacy of the designation “exchange”.2
In Sect. 3.4 dealing with exchange NMR spectroscopy, we have anticipated that the
spin-bearing molecules can populate a discrete number or spectroscopically and/or
dynamically differing sites among which they can directly jump by thermal activa-
tion. Actually, in just this sense, exchange was already examined in the early days
of NMR [24]. The more extended phases among which exchange is to occur in the
scenarios under present consideration, need to be differentiated carefully from the
sites then in force.
Sites are characterized by well-defined molecular orientations, interactions, acti-
vation energies, and positions relative to certain chemical environments. On the other
hand, apart from the thermodynamic definition, we specify a phase as a more or less
extended system of molecules homogeneously characterized by certain dynamical
features. For example, different phases distinguish themselves by different degrees of
reorientation anisotropy, different translational-diffusion properties, different thermal
activation energies, etc.
Molecular exchange between phases can only occur at interfaces of coexistence.
Since phases tend to form extended systems, exchange is intimately related with
translational diffusion to and from the interfaces. Instead of the simple exchange
kinetics anticipated in Sect. 3.4 for exchange NMR, diffusion modes must be
implicated as solutions of Fick’s second law with the corresponding boundary
conditions. Fortunately, simplistic but nevertheless successful limits exist where
the transport aspect of exchange can globally be modeled by fixed parameters to be
specified in the following. It is clear that models on this basis can only work
satisfactorily if the extension of the phase regions is small enough. On a mesoscopic
length scale, there are good prospects, while exchange in macroscopic pore spaces
must be left to more demanding concepts.
7.2 Exchange Limits for Two-Phase Systems
In the frame of the two-phase model for porous media, exchange between adsorbed
and bulk-like phases is considered as illustrated in Fig. 7.2. Exchange can be
classified by defining an effective exchange time tex characterizing the exchange
kinetics between the two phases including transport to and from the interfaces. In
2
A short side note: “Exchange” is to refer to molecular exchange if not specified otherwise.
Selective exchange of atoms such as hydrogen in water or in hydroxyl groups of other compounds,
for example, is usually slower and therefore irrelevant in the present context. For example,
hydrogen exchange in water of neutral acidity has an exchange time from molecule to molecule
in the order of 10À3
s [20, 21] compared to exchange times of about 10À5
s for molecular exchange
between adsorbed and bulk-like water phases. The latter order of magnitude is concluded from the
strong frequency dependence of the spin–lattice relaxation time in such systems ranging down to
the kHz regime (see Fig. 7.3).
7.2 Exchange Limits for Two-Phase Systems 555
8. principle, one should distinguish moreover between the mean residence time in the
adsorbed phase, tex;a, and the mean residence time in the bulk-like phase, tex;b. For
the sake of simplicity and for discussion purposes, it suffices to take tex as the mean
of these two residence times.
Whether exchange must be rated as “fast” or “slow” depends on the reference
time scale. In this respect, we distinguish the measuring time scale – which in turn
is determined by the measuring technique – and the correlation time scale referring
to the decay of correlation functions of molecular motions.
7.2.1 Exchange Limits Relative to Measuring Time Scales
7.2.1.1 Diffusion Time Scale
Let us denote the diffusion time, that is, the interval in which diffusive displacements
are probed, by t. In the slow-exchange limit, where the exchange time is much longer
than the diffusion time, tex ) t, experimental measurands, that is, primarily the
incoherent dynamic structure factor, will be characterized by a superposition of two
independent diffusion processes referring to the bulk-like and adsorbed phases. The
respective transport properties may be influenced by restricted-geometry effects
depending on the pore-space topology and the root-mean-square displacement
achieved in t. The diffusion features in the adsorbed phase may moreover be affected
by the adsorption effect. The opposite limit, tex( t, that is, fast exchange, applies for
very long diffusion times as they are often relevant under typical measuring
conditions. A semiempirical formula for this two-phase/fast-exchange diffusion sce-
nario will be given further down.
7.2.1.2 Spin Relaxation Time Scale
In the case of spin relaxation, two different reference time scales must be distin-
guished, the relaxation time scale and the correlation time scale. The former is
defined by the longitudinal and transverse relaxation times T1 and T2, respectively.
The latter characterizes the decay period of the correlation function of the relevant
spin interactions. Under favorable conditions, the correlation time scale can be
characterized by a single well-defined correlation time.
Relative to the spin-relaxation time scale, the fast-exchange limit tex ( T1; T2
manifests itself by monoexponential longitudinal or transverse relaxation curves.
Molecular exchange rates are then much larger than the relaxation rates in either
phase. This is the basis of the two-phase/fast-exchange relaxation scenario. To be
sure that this limit applies, the monoexponential character should be verified over at
least a decade of the decay of the relaxation curves.
The two-phase/fast-exchange relaxation scenario is definitely not suited for
macroscopic systems which are too large for the characterization of exchange
556 7 Dynamics at Fluid Solid Interfaces: Porous Media and Colloidal Particles
9. kinetics by a fixed exchange time. Instead, the analysis must be based on a system
of Bloch equations supplemented by a diffusion term and an interfacial exchange
term. Spin relaxation, translational diffusion, and molecular exchange must then
commonly be assessed [25]. In the opposite limit, slow exchange on the relaxation
time scale, the two phases do not “communicate” with each other on the relevant
time scale. The consequence is that spin-relaxation data represent a superposition of
independent systems.
7.2.2 Exchange Limits Relative to the Time Scale
of Orientation Correlation Functions
By definition, spin–lattice relaxation times are much longer than the correlation
times of the correlation functions on which they are based (see Sect. 3.1.5). The
fast-exchange limit on the relaxation time scale can therefore be further subdivided
in fast- and slow-exchange limits relative to the time scale on which correlation
functions are probed in experiments. This time scale is related to the Fourier
conjugate to of the angular Larmor frequency o, that is, o !
F
to. Exchange limits
can be expressed in terms of either variable as tex ( to; oÀ1
and tex ) to; oÀ1
standing for fast and slow exchange on the correlation time scale, respectively.
In the following, we will focus in particular on the (normalized) intramolecular
orientation correlation functions determining homonuclear spin relaxation due to
dipolar and/or quadrupolar couplings:
GorðtÞ ¼ 4p À1ð Þm
Y2;mð0ÞY2;ÀmðtÞ
ensemble
ðm ¼ 0; 1; 2Þ (7.7)
As before, different orders m need not be distinguished explicitly as discussed in
Sect. 3.1.5.6. Equation (7.7) correlates the spherical harmonics of second degree,
Y2;m ¼ Y2;m #; ’ð Þ, at the beginning and at the end of time intervals t (for simplicity,
we will omit the subscript o from now on with the tacit understanding that t is
predetermined by the angular frequency o chosen in the experiment). The time
dependence enters via the initial and final polar and azimuthal angles #ð0Þ; #ðtÞ and
’ð0Þ; ’ðtÞ, respectively. These angles specify the molecular orientation relative to
the laboratory reference frame.
Four different scenarios can be distinguished for the correlation decay. They are
characterized by the following exclusive probabilities: (a) fa;aðtÞ, fraction of
molecules which happen to be initially as well as finally located in the adsorbed
phase; (b) fa;bðtÞ, fraction of molecules which happen to be initially in the adsorbed
phase and finally in the bulk-like phase; (c) fb;aðtÞ, fraction of molecules which
happen to be initially in the bulk-like phase and finally in the adsorbed phase; and
7.2 Exchange Limits for Two-Phase Systems 557
10. (d) fb;bðtÞ, fraction of molecules which happen to be initially and finally in the bulk-
like phase. Normalization requires
fa;aðtÞ þ fa;bðtÞ þ fb;aðtÞ þ fb;bðtÞ ¼ 1 (7.8)
The subscripts a and b stand for “adsorbed” and “bulk-like”, respectively.
Fast exchange on the relaxation time scale means that spins are subjected to
numerous correlation probe intervals t before relaxation becomes perceptible on
experimental time scales of the order of T1 or T2 . That is, each molecule will
consecutively be subject to all four scenarios many times during the measuring
process. From the statistical point of view, this permits us to subdivide the correla-
tion function Eq. (7.8) into four partial correlation functions for four subensembles
of molecules. The subensembles represent molecules taking part in the diverse
scenarios. The correlation function effective for all molecules in both phases is then
the weighted average
GorðtÞ ¼ f a;aðtÞGa;aðtÞ þ fa;bðtÞGa;bðtÞ þ fb;aðtÞGb;aðtÞ þ fb;bðtÞGb;bðtÞ (7.9)
The partial correlation functions Gi;jðtÞ for i ¼ a; b and j ¼ a; b refer to
subensembles of molecules being initially in phase i and finally in phase j. Their
contributions are weighted by the fractions fi;j.
Cases (a) and (d) imply that the reference molecule will be still or again in the
same phase as initially. That is, cyclic exchange processes in the considered time
interval can (but need not) have taken place. This is in contrast to cases (b) and (c)
where exchange between the phases is implicated necessarily. Let us now consider
the limits of Eq. (7.9) relative to the mean exchange time constant tex.
7.2.2.1 Fast Exchange on the Correlation Time Scale
In this limit, the reference molecule will be exchanged frequently on the time scale
of the correlation decay, that is, tex ( t (recall that t is an experimental parameter
predetermined by the adjusted angular frequency, while tex is specific for the
sample and its temperature). The initial and final probabilities of finding the
reference molecule in a certain phase can therefore be established independently.
The fractions fi;j can be approximated by
fa;aðtÞ % f2
a
fa;bðtÞ % fb;aðtÞ % 1 À fað Þ fa
fb;bðtÞ % 1 À fað Þ2
(7.10)
558 7 Dynamics at Fluid Solid Interfaces: Porous Media and Colloidal Particles
11. where fa and 1 À fað Þ are the (time-independent) populations in the adsorbed and
bulk-like phases, respectively. We thus arrive at
Gor t ) texð Þ % f2
a Ga;aðtÞ þ 1 À fað Þ faGa;bðtÞ þ 1 À fað Þ faGb;aðtÞ
þ 1 À fað Þ2
Gb;bðtÞ (7.11)
as an approach for the correlation function Eq. (7.9).
Molecular motions in the bulk-like phase of ordinary liquids can be assumed to
be isotropic and relatively fast in contrast to the adsorbed phase where reorientations
are restricted and slower by tendency. In terms of molecular dynamics, this is just the
definition of the difference between the two phases. Let tb be the rotational correla-
tion time in the bulk-like phase, so that any orientation correlation vanishes in the
limit t ) tb . As a characteristic of the principally fastest process in the scenarios
under consideration, the correlation time tb can be assumed to be shorter than the
effective exchange time tex : tb ( tex ( t . Provided that the population in the
adsorbed phase, fa , is not too small, the correlation function Eq. (7.11) can then
be approached by
GorðtÞ % f2
a Ga;aðtÞ (7.12)
where Ga;aðtÞ is the only partial correlation function “surviving” on a time scale
t ) tex ) tb. All other terms in Eq. (7.11), that is, Ga;bðtÞ; Gb;aðtÞ; Gb;bðtÞ, will be
subject to extremely fast correlation losses while molecules are in the bulk-like
phase. These contributions therefore decay to negligibly small values:
1 À fað Þ faGa;bðtÞ þ 1 À fað Þ faGb;aðtÞ þ 1 À fað Þ2
Gb;bðtÞ ( f2
a Ga;aðtÞ (7.13)
7.2.2.2 Slow Exchange on the Correlation Time Scale
The effective exchange time is now assumed to be long relative to the time scale of
the correlation decay, that is,tex ) t. Exchange between the adsorbed and bulk-like
phases will therefore be unlikely. The molecules will rather stay in their initial
phases. The fractions fi;j can then be approximated by
fa;aðtÞ % fa
fa;bðtÞ % fb;aðtÞ % 0
fb;bðtÞ % 1 À fað Þ ð7:14Þ
7.2 Exchange Limits for Two-Phase Systems 559
12. The correlation function Eq. (7.9) thus adopts the form
Gor t ( texð Þ % faðtÞGa;aðtÞ þ 1 À fað ÞGb;bðtÞ (7.15)
Referring to times longer than the rotational correlation time in the bulk-like phase
but shorter than the exchange time, tb ( t ( tex; the correlation function
Eq. (7.15) can be reduced further to
GorðtÞ % faGa;aðtÞ (7.16)
(provided that the population of the adsorbed phase, fa, does not scale down this
term too much relative to the second term in Eq. (7.15); that is, 1 À fað ÞGb;bðtÞ
( faGa;aðtÞ).
The remarkable difference between Eqs. (7.12) and (7.16) is that the former
has a quadratic and the latter a linear dependence on the population of the
adsorbed phase. On the other hand, the decay of the effective correlation function
of all particles in both phases will be dominated by the subensemble residing
initially as well as finally in the adsorbed phase. That is, the function Ga;aðtÞ
matters in either case.
7.2.3 Combined Limits for Spin Relaxation
in “Two-Phase/Fast-Exchange Systems”
Since slow exchange on the relaxation time scale (Sect. 7.2.1.2) is of minor
interest in the present context, we restrict ourselves to two-phase/fast-exchange
systems as a paradigm, where the attribute “fast” refers to the relaxation time
scale. As outlined in Sects. 3.1.5.7, 3.1.5.8, and 3.1.5.9, the most important proton
spin-relaxation mechanisms are couplings between like dipoles on the one hand
and interactions with electron-paramagnetic species (referred to as S-spins) on
the other. In the following, we will mainly consider diamagnetic systems for
which the former case is relevant. Quadrupole interactions of quadrupole nuclei
(such as deuterons) can also be assigned to this category because of the formally
equivalent spin-relaxation formulas. Later, in Sect. 7.5.8, we will resume
the discussion of electron-paramagnetic systems as they may be relevant
especially in natural and technical porous media such as rocks and cement,
respectively.
According to Eqs. (3.139) and (3.148) for spin–lattice relaxation and
Eqs. (3.167) and (3.168) for transverse relaxation, the respective intra-molecular
relaxation rates for homonuclear dipolar or quadrupolar spin interactions are
given by
560 7 Dynamics at Fluid Solid Interfaces: Porous Media and Colloidal Particles
13. 1
T1
¼ C1 IðoÞ þ 4Ið2oÞ½ Š
1
T2
¼ C2 3Ið0Þ þ 5IðoÞ þ 2Ið2oÞ½ Š (7.17)
where C1 and C2 are constants specific for the relevant spin couplings. The reduced
spectral densities
IðoÞ ¼
ðþ1
À1
GorðtÞeÀiot
dt (7.18)
are defined as Fourier transforms of the normalized correlation function. Combin-
ing Eq. (7.18) with Eqs. (7.12) and (7.16) gives
IaaðoÞ ¼ f2
a
ðþ1
À1
Ga;aðtÞeÀiot
dt for o ( tÀ1
ex ( tÀ1
b and fa
0
finite0
(7.19)
(fast exchange on the correlation time scale) and
IaaðoÞ ¼ fa
ðþ1
À1
Ga;aðtÞeÀiot
dt for tÀ1
b ) o ) tÀ1
ex and fa
0
finite0
(7.20)
(slow exchange on the correlation time scale). The attribute “finite” means that the
population of the adsorbed phase cannot be neglected relative to that of bulk-like
phase. Spin relaxation will therefore be dominated exclusively by processes inside
the adsorbed phase in both cases. A typical example is the RMTD process men-
tioned above. It will be described in more detail further down.
With the aid of spin–lattice relaxation experiments, a distinction of the two
limits represented by Eqs. (7.12) and (7.16) or (7.19) and (7.20) is possible via the
proportionalities
1
T1
/ f2
a for o ( tÀ1
ex ( tÀ1
b and fa
0
finite0
(7.21)
(fast exchange both on the correlation time scale and on the relaxation time scale)
and
1
T1
/ fa for tÀ1
b ) o ) tÀ1
ex and fa
0
finite0
(7.22)
7.2 Exchange Limits for Two-Phase Systems 561
14. (exchange slow on the correlation time scale but fast on the relaxation time scale).
For transverse relaxation, the situation is a bit more complicated because of the
zero-frequency term Ið0Þ conflicting with the limit tÀ1
b ) o ) tÀ1
ex anticipated for
Eq. (7.20). In the frame of these limits, contributions of the bulk-like phase to the
total spin–lattice relaxation rate are entirely negligible (apart from the correspond-
ingly reduced weighting factor fa).
The population of the adsorbed phase can be varied by variation of the filling
degree of the porous matrix. Small filling degrees correspond to large populations
of the adsorbed phase and vice versa. Such experiments have been reported in Ref.
[26]. Equivalent Monte Carlo simulations are described in Ref. [27]. The experi-
mental scenarios to be discussed in the following sections can predominantly be
attributed to the limit tÀ1
b ) o ) tÀ1
ex (or equivalently tb ( t ( tex ), that is,
exchange slow on the correlation time scale but fast on the relaxation time scale.
7.3 Adsorption Limits
Another category of limiting cases concerns different adsorption properties.
Adsorption of liquid molecules on surfaces of colloid particles or pores in porous
media can be characterized by the following parameters [1, 16]: The retention time
th indicates how long it takes until the initial population of the adsorbed phase is
finally replaced by exchange with the bulk-like phase. This sort of renewal time is
the maximum time scale of the processes of interest in the present context. The
retention time is related to a quantity h called adsorption depth. It is defined by
h ¼
ffiffiffiffiffiffiffi
Dth
p
(7.23)
where D is the bulk diffusivity of the adsorbate. Adsorption and desorption rates are
designated by Qads and Q, respectively. Specifying furthermore the capture range b,
that is, the distance over which an adsorbate molecule can directly be adsorbed on
the surface in a single displacement step, leads to the relation
h ¼ b
Qads
Q
(7.24)
Equation (7.24) reflects the dynamic equilibrium of the one-dimensional reaction–-
diffusion problem as which the adsorption process and translational diffusion to and
from the surface can be interpreted.
On the basis of the parameters th and Q, the weak-adsorption limit is specified by
thQ ( 1 (7.25)
562 7 Dynamics at Fluid Solid Interfaces: Porous Media and Colloidal Particles
15. Fig. 7.3 Distinction of weak and strong adsorption in various systems with polar surfaces. The
respective limits are relevant for nonpolar and polar adsorbate liquids. This is revealed by weak
and strong spin–lattice relaxation dispersions. The different solvents investigated are specified in
the insets. (a) Porous silica glass (nominal pore diameter 30 nm. The solid lines refer to a tentative
analysis reported in Ref. [22]) (Reproduced from Ref. [22] with kind permission of # APS 1995);
(b) ZnO fine particles (diameters 200–500 nm); (c) TiO2 fine particles (diameters 200–800 nm)
(Reproduced from Ref. [23] with kind permission of # AIP 1998)
7.3 Adsorption Limits 563
16. Assuming that the bulk-like phase is much larger than the adsorbed phase, there will
be little chance that adsorbate molecules return on the experimental time scale after
escaping from the surface layer. Rather, they will be dispersed in the large volume
of the bulk-like phase. This is in contrast to the opposite condition, the strong-
adsorption limit
thQ ) 1 (7.26)
Readsorption is likely after desorption. Numerous intermittent desorption/
readsorption cycles may occur in this case before adsorbate molecules finally
escape to the vastness of the bulk-like phase on the experimental time scale.
How intense or weak adsorbate molecules interact with surfaces, can be
demonstrated with field-cycling NMR relaxometry data. Figure 7.3 shows results
for different low-molecular solvents embedded in porous silica glass samples and in
fine-particle beds. All adsorbent materials employed in these experiments are
characterized by polar (hydrophilic) surfaces. The polar and nonpolar nature of
the solvents manifests itself by dramatically different dispersion slopes of the
spin–lattice relaxation times. This finding suggests that polar adsorbate liquids
are subject to strong adsorption on polar surfaces, whereas nonpolar liquids are
only weakly adsorbed on substrates of this sort. The only interpretation is that
Fig. 7.3 (continued)
564 7 Dynamics at Fluid Solid Interfaces: Porous Media and Colloidal Particles
17. reorientational fluctuations of polar adsorbate molecules are slowed down by orders
of magnitude relative to non–polar species in the experimental time/frequency
window.
7.4 Translational Diffusion of Low-Molecular Fluids
Under Confinement
In Chap. 3, a number of techniques suitable for studies of translational diffusion
have been described. The function to be probed in experiments and common to
most of these methods, the incoherent dynamic structure factor, has already been
introduced in Eq. (1.10):
GincðtÞ ¼ exp iq Á rselff gh i (7.27)
rself ¼ rselfðtÞ is the molecular displacement in the diffusion time t. The angle
brackets indicate an ensemble average. The definition of the wave vector q is
specific for the technique employed. The diverse versions are listed in Eq. (3.576).
With field-gradient NMR diffusometry, the technique we will focus on, it is given
by the magnetic field-gradient strength g, the gradient pulse length d, and the
gyromagnetic ratio g of the resonant nuclei:
q ¼ gdg (7.28)
Features of diffusion in porous media will be described preferably on the basis of
the diffusion coefficient D which links the mean square displacement with the
diffusion time via the Einstein relation
r2
self
¼ 6Dt (7.29)
provided that the diffusion process obeys normal conditions (see the discussion in
Sect. 2.5.1).
7.4.1 Fluids in Saturated Mesoscopic Pore Spaces
Confinement in saturated porous media affects diffusion in fluids if (1) the root-
mean-squared displacement is larger than the mean pore diameter and/or (2) if the
population of the adsorbed phase cannot be neglected relative to that of the bulk-
like phase. The latter means that the surface-to-volume ratio is accordingly large.
The former condition implies that a part of the particle trajectories that would be
7.4 Translational Diffusion of Low-Molecular Fluids Under Confinement 565
18. possible in bulk are excluded by pore walls and by the pore-space topology. The
consequences can be the following: reduced diffusivity, anisotropy of the
displacements, trapping, and obstruction effects as already debated in Sect. 2.5.2
in the context of anomalous diffusion. Condition (2) implies that translational
degrees of freedom of the particles can intermittently be restricted to the adsorbed
phase. In this case, trajectories will only be possible in the interfacial layer if
energetically possible at all. The diffusivity effective in the total system is then a
matter of exchange between the two phases.
7.4.1.1 Porous Glasses
Porous silica glasses can be taken as a well-studied and well-characterized para-
digm for mesoscopic porous media with substantially random pore spaces. A
typical electron micrograph is shown in Fig. 7.1. In the following, let us have a
closer look at a number of data sets measured with fluids embedded in such systems.
The self-diffusion coefficient in bulk water at room temperature is known to be
D ¼ 2 Â 10À9
m2
=s. The values of other low-molecular solvents are of the same
order of magnitude. This is to be compared with data measured in porous silica
glasses with nominal pore diameters of 4 and 30 nm. A correlation plot is shown in
Fig. 7.4 [28]. Under such confinements, the effective diffusion coefficients were
found to be reduced by about 83 and 37%, respectively.
The attribute “effective” means that the measurements represent averages over
length scales much longer than the correlation lengths of the pore spaces. In the
aforementioned study, the diffusion time was chosen to be about 10 ms or longer so
that the root-mean-square displacements are in the order of micrometers. This is three
orders of magnitude larger than the pore dimensions not to speak of the width of the
surface layers forming the adsorption phase. The correlation lengths of the pore spaces
are thus exceeded by far, and anomalous diffusion features can be excluded in this case.3
That is, mean square displacements vary linearly with time.
The following proportionalities for the effective diffusion coefficient suggest
themselves for an interpretation: Deff / P (porosity) and Deff / tÀ1
diff (inverse
diffusive tortuosity; see Eq. 7.3), and, assuming the two-phase/fast-exchange
model for diffusion, Deff / faDa þ 1 À fað ÞDb , where fa is the population in the
adsorbed phase. Da and Db are the local diffusivities in the adsorbed and bulk-like
phases, respectively. Taking all three proportionalities together gives
Deff %
P
tdiff
faDa þ 1 À fað ÞDb½ Š (7.30)
for the effective (i.e., long-range) diffusivity.
3
Anomalies are however expected on shorter time scales below the ms regime as they are
accessible with the fringe-field variant of field-gradient diffusometry. In this case, anomalies
have been observed indeed (see Ref. [29]).
566 7 Dynamics at Fluid Solid Interfaces: Porous Media and Colloidal Particles
19. Equation (7.30) can be rewritten in the form
Deff
PDb
%
1
tdiff
fa
Da
Db
þ 1 À fað Þ
!
(7.31)
All quantities on the left-hand side can be measured separately. For the porous
glasses Bioran B30 and Vycor to which the data in Fig. 7.4 refer, the porosities are
P ¼ 0:68 and 0.28, respectively. Accordingly, the respective values of the term on
the left-hand side of Eq. (7.31) are Deff PDbð Þ= ¼ 0:94 Æ 0:09 and 0:61 Æ 0:05. The
populations of the adsorbed phase can further be estimated as fa % 0:06 and 0.4 for
minimum surface coverage assuming that the adsorbed phase consists of monomo-
lecular surface layers.
From Vycor to Bioran, the value of the left-hand side of Eq. (7.31) varies by a
factor of 1.5, whereas the variation of the populations in the adsorbed phase is only
Fig. 7.4 Self-diffusion coefficients of diverse low-molecular liquids in porous silica glasses with
trade names Bioran B30 and Vycor. The respective nominal pore diameters are 30 and 4 nm. The
effective diffusion coefficients Deff measured under confinement are plotted versus the bulk values
Db. The solvent species and the temperatures are specified in the plot by numbers and letters: (1)
acetone at 303 K; (2) toluene at 303 K; (3) water at 303 K; (4) ethanol at 303 K; (5) hexanol at
303 K; (6a-6f) glycerol at temperatures between 305 and 378 K; (7) hexane at 303 K; (8)
cyclohexane at 303 K; (9) tetradecane at 303 K; (10a and b) octacosane at 343 and 373 K,
respectively. The reduction factors of the diffusion coefficients under confinement relative to the
bulk values were found to be 0.63 and 0.17 for Bioran B30 and Vycor, respectively, independent of
the solvent species. The dashed line represents the expectation in the absence of the confinement
effect. All data have been measured with the aid of field-gradient NMR diffusometry. Note that the
results are neither affected by internal field gradients nor by the dipolar correlation effect as
demonstrated in Ref. [23] (Reprinted from Ref. [28] with kind permission of # Elsevier 1996)
7.4 Translational Diffusion of Low-Molecular Fluids Under Confinement 567
20. a factor of 0.15, that is, 10 times less. Since the diffusion coefficient in the adsorbed
phase, Da, and hence the ratio, Da Db= , is expected to be practically the same in both
silica systems, the conclusion can only be that it is essentially the tortuosity that
causes the difference in the effective (long-range) diffusion coefficients between
the two sample systems. Dynamics within the adsorbed phase are obviously of
minor importance in the context of translational diffusion.
This statement is all the more valid for results measured with methods such as
quasi-elastic neutron scattering. The displacement length scale probed is then
smaller than the pore dimension. In this case, the reduction of the diffusion
coefficient under confinement conditions turned out to be minor or even negligible
[30–32].
The discussion so far refers to temperatures near room temperature. Below the
freezing temperatures of the bulk-like phases, quite interesting diffusion properties
arise in so-called nonfreezing surface layers. A discussion follows in Sect. 7.4.2.
7.4.1.2 Aqueous Dispersions and Agglomerates of Fine-Particles
Apart from solid porous matrix materials, suspensions and agglomerates of colloids
or fineparticles4
in a sense also form mesoscopic pore spaces depending on the
particle concentration and diameter. Water diffusion in aqueous particle suspensions
is again determined by tortuosity and obstruction effects due to the presence of
impenetrable surfaces. Moreover, fractal structure properties of agglomerates have
been identified in a wide scaling range [33]. Diffusion anomalies can therefore be
expected analogous to those predicted for fractal percolation clusters [10, 11].
Deviations from Fickian diffusion are actually revealed by experimental studies as
reported in Ref. [34], for example.
With decreasing water content, the population in the adsorbed phase increases so
that the interplay of bulk-like and adsorbed water matters more and more. In cases
where the suspension is not too compact, fine particles retain some degree of
translational freedom. The fine particles together with their adsorption layers will
therefore contribute to water displacements as well and consequently complicate
the analysis of the diffusion behavior. In the following, we will focus on another
sort of “fine particles” with mesoscopic diameters, namely, large globular proteins
which are of considerable interest in life science.
7.4.1.3 Aqueous Solutions of Globular Proteins
Water in aqueous protein solutions and biological tissue is more than just a solvent.
Rather, it may even act as a structure-forming and stabilizing element of
biopolymers. Modeling of water dynamics by a simple two-phase/fast-exchange
concept for diffusion nevertheless turned out to be quite successful despite of its
4
Trade names of frequently studied, more or less monodisperse silica fine particles are Alfasil and
Cab-o-sil with diameters ranging from a few up to several tens of nanometers.
568 7 Dynamics at Fluid Solid Interfaces: Porous Media and Colloidal Particles
21. crudeness. We will therefore restrict ourselves to this approach, keeping in mind
that the adsorbed phase may include structure-forming water molecules and exchange-
able hydrogen atoms intrinsic to the protein structure. The adsorbed phase is thus
considered to represent average properties of the adsorbed water on the one hand and
of all subphases possibly contributed by protein constituents on the other.
A typical globular protein of medium size is bovine serum albumin (BSA). It has
a molecular mass of about 67,000 Dalton and a prolate ellipsoid shape of
dimensions 14 Â 4 Â 4 nm3
. In this sense, the macromolecule can be considered
as a mesoscopic colloid particle. Aqueous solutions (or in colloid terminology
“dispersions”) can be prepared in the whole concentration range from extreme
dilution to practically dry materials.
Figure 7.5 shows the average water diffusion coefficient in aqueous BSA solutions
as a function of the BSA concentration at room temperature [35]. There is a
continuous decrease of the diffusion coefficients with increasing protein concentra-
tion until a sudden cutoff is reached at cp % 85%
This concentration dependence can be interpreted as follows: At relatively low
protein concentrations cp50%, the bulk-like water phase dominates. On length
scales much larger than the nearest neighbor distance of the (quasi-static) protein
molecules, water diffusion will merely be obstructed by macromolecular obstacles
according to the empirical relation [36, 37]
Dw ¼ Db 1 À bfð Þ (7.32)
where Db is the water diffusion coefficient for infinite dilution, f is the volume
fraction of the protein, and b is a numerical factor characterizing the shape of the
protein molecules. Equation (7.32) is an approximate variant of Eq. (7.30) for fa
( 1, tdiff % 1, and P 1 À fð Þ % 1 À bfð Þ.
Strong tortuosity effects are expected to come into play at protein concentrations
aroundcp % 50%where the porosity takes similar values as in the case of the porous
silica glasses considered in Sect. 7.4.1.1. The full version of Eq. (7.30) is applica-
ble. Finally, beginning with a protein concentration of about 65%, the bulk-like
phase vanishes. All water in the system must then be attributed to the adsorbed
phase. At this threshold concentration, the overlapping hydration shells form a
continuous (i.e., percolating) network as will be shown further down.
At still higher concentrations, cp65%, the adsorbed phase shrinks more and
more until the percolating network of the overlap of the hydration shells will be
disrupted. The consequence is that hydration shells become unsaturated. Water
remains merely in the form of finite clusters on the protein surfaces. The size of the
network still accessible for water diffusion falls below a kind of percolation
threshold. Water diffusion is then restricted to displacements within isolated
clusters and can no longer be measured with ordinary field-gradient NMR
diffusometry (see the cutoff in Fig. 7.5). Interestingly, a percolation transition just
of that sort was concluded from dielectric studies of the proton conductivity [38].
7.4 Translational Diffusion of Low-Molecular Fluids Under Confinement 569
22. 7.4.2 Translational Diffusion in the Adsorbed Phase
The findings summarized in the previous section suggest that dispersions of colloid
particles compacted to concentrations where no space is left for the bulk-like phase
permit diffusion studies selectively in the adsorbed phase provided it is still
saturated. The only liquid in the system is then adsorbed.5
Another strategy for
the examination of diffusion in hydration shells is to take advantage of the different
freezing temperatures of the bulk-like and adsorbed phases. It is known that
adsorbed phases tend to freeze at a lower temperature than the corresponding
bulk-like phases [13–15]. In suitable adsorbate/adsorbent combinations, the exper-
imental temperature can be chosen just between the two freezing temperatures, so
that the bulk-like phase will be frozen while the adsorbate phase is still liquid.
Fig. 7.5 Water diffusion coefficient in aqueous bovine serum albumin (BSA) solutions as a
function of the protein concentration by weight, cp [35]. The proton data were recorded at 20
C
with a field-gradient NMR diffusometry technique. The spin-echo technique practically ensures
that the diffusion data refer selectively to the water signal component. The effective diffusion time
is 10 ms so that the root-mean-square displacements are in the order of micrometers and exceed the
correlation length of the system by far. The data therefore represent effective values. At protein
concentrations above 87%, the transverse relaxation time drops below 1 ms, so that no diffusive
echo attenuation could be measured anymore under the instrumental conditions of that study
5
Under such conditions, one must make sure that all remaining pore space is actually filled with
liquid. Otherwise, a third phase, namely, the vapor of the liquid, can contribute or even dominate.
This phenomenon will be discussed in Sect. 7.4.4.
570 7 Dynamics at Fluid Solid Interfaces: Porous Media and Colloidal Particles
23. The different freezing behaviors of the bulk-like and the adsorbed phases can be
demonstrated with the aid of NMR spectroscopy. Figure 7.6 shows deuteron spectra
recorded in partially frozen samples with a series of pulse sequences suitable for the
distinction of liquid and solid phases.
In such partially frozen samples, all perceptible diffusion takes place in the
liquid surface layers forming the adsorbed phase.6
This diffusion-sensitive part of
Fig. 7.6 2
H NMR spectra of heavy water in bulk and confined in a porous silica glass (trade name
Bioran B10; nominal pore diameter 10 nm). The deuteron resonance frequency was 46 MHz. At a
temperature of À30
C, the bulk-like phase of water is already frozen, whereas the adsorbed phase
is still liquid. The so-called nonfreezing surface layers are demonstrated in the spectra as narrow
lines (marked by arrows). Such lines indicate motional narrowing as expected in the liquid state.
The spectra acquired on the basis of Hahn spin echoes are selectively sensitive to liquid phases,
while signals of solid constituents are suppressed. On the other hand, quadrupole echoes generated
in 3 or 5 radio frequency pulse experiments reveal both signals from the solid (i.e., frozen) bulk-
like and the liquid adsorbed phases as demonstrated by the superposition of Pake-like spectra due
to “solid” signals and Lorentzian-like lines produced by “liquid” signals. The interested reader
finds treatments of so-called solid echoes in comparison to spin echoes of the Hahn type in Ref.
[39], for instance (Reprinted from Ref. [23] with kind permission of # AIP 1998)
6
Immaterial diffusion of spins by flip-flop spin transitions in the frozen material, the so-called spin
diffusion mentioned several times before, can be excluded for deuterons but might be effective for
protons in principle. By all means, the influence on the diffusion behavior in the liquid phase will
be entirely negligible, owing to the weak coupling between fluid and solid [23, 40].
7.4 Translational Diffusion of Low-Molecular Fluids Under Confinement 571
24. the pore space is somewhat imprecisely referred to as nonfreezing surface layers.7
(See also the illustration in Fig. 7.16 to which we will get back in the context of
reorientational dynamics at surfaces.)
7.4.2.1 Aqueous Solutions of Globular Proteins
Let us resume the discussion of aqueous solutions of globular proteins started in
Sect. 7.4.1.3. Figure 7.7 represents a diffusion study of water in myoglobin
solutions as a function of the inverse temperature for different water contents [35].
Depending on the water content, freezing of bulk-like water results in a more or
less abrupt decay of the diffusion coefficient to a concentration independent value
below about 270 K. For a water content of 30%, this cross-over is no longer visible.
The only liquid phase is then hydration water on either side of the critical crossover
temperature.
The fact that translational diffusion with root-mean-square displacements in the
order of micrometers can nevertheless be measured in partially frozen samples
indicates that the hydration shells form “infinite” percolation clusters permitting
displacements from hydration shell to hydration shell over numerous protein
molecules as schematically illustrated in Fig. 7.8. Essentially, the character of the
cluster of overlapping hydration shells does not change with the water content. The
diffusion properties of the adsorbed phase of partially frozen samples should
therefore be independent of the water content as long as the hydration shells are
saturated. This is demonstrated in Fig. 7.7 and in Fig. 7.9 for data of the partially
frozen samples up to protein concentrations of about 65%.
At water contents below saturation, that is, below about 35%, no bulk-like phase
exists anymore so that all water remains liquid even if the temperature falls below
the bulk freezing temperature. A description is then possible by a simple Arrhenius
law for the whole temperature range:
Dw ¼ D1 exp À
Ea
RT
'
(7.33)
(compare the data in Fig. 7.7 for a water content of 30% which can be described by
a monoexponential decay). The apparent activation energy for translational diffu-
sion, Ea, evaluated on this basis is 20.8 kJ/mol which is about the same as in bulk
water. Obviously, water diffusion in the adsorbed phase is strikingly fast,
suggesting almost unrestricted translational degrees of freedom on the network of
the nonfreezing surface layers. A similar conclusion was drawn for diffusion in the
interstitial water inherently incorporated in single crystals (!) of sperm whale
7
Incidentally, the peculiar thermodynamic properties of interfacial water at low temperatures have
found much attention especially in the biopolymer community. The ongoing discussion of this
topic is demonstrated by a recent quasi-elastic neutron scattering study reported in Ref. [41] and
other references cited therein.
572 7 Dynamics at Fluid Solid Interfaces: Porous Media and Colloidal Particles
25. Fig. 7.7 Temperature dependence of the water diffusion coefficient in aqueous myoglobin
solutions with different water contents [35]. The proton data were measured with the pulsed
field-gradient NMR diffusometry technique for protons. The root-mean-square displacements
exceed the correlation length of the system by far, so that the data must be considered as effective
ones. The dashed line represents an Arrhenius law according to Eq. (7.33)
Fig. 7.8 Schematic representation of the overlapping network of the liquid hydration layers in
colloidal particle agglomerates. This network permits diffusive displacements of adsorbate
molecules exceeding the particle dimension by far and thus makes experimental studies with
field-gradient NMR diffusometry feasible in the absence of the bulk-like phase
7.4 Translational Diffusion of Low-Molecular Fluids Under Confinement 573
26. myoglobin [43]. Findings of this sort are confirmed by molecular-dynamics
simulations and neutron scattering data as reported in Ref. [44].
Diffusion in the adsorbed phase can also be determined indirectly via spin relaxa-
tion by coupling to electron-paramagnetic centers at the protein surface. In Ref. [45],
bovine serum albumin covalently labeled with (electron-paramagnetic) nitroxide
radicals has been examined in this way. The analysis of the proton spin–lattice
relaxation dispersion generated by dipolar coupling to the paramagnetic relaxation
sinks suggests a local water diffusion coefficient of about 3 Â 10À10
m2
s= within the
first nm from the protein surface. According to Fig. 7.9, this value fits very well to the
data measured in the nonfreezing surface layer after correction for the different
temperatures at which the experiments were carried out and in view of the fact that
the nitroxide label study was performed in the unfrozen, that is, unconstrained system.
It should also be kept in mind that the nitroxide-label-based value reflects rather short
displacements in the order of nanometers, while the 270-K data in Fig. 7.9 refer to
displacements over numerous hydration shells forming a percolation network of
nonfreezing surface layers.
Fig. 7.9 Water diffusion coefficient in aqueous bovine serum albumin (BSA) solutions as a
function of the protein concentration by weight [35]. The temperatures were chosen above and
just below the freezing temperature of the bulk-like phase. The proton data have been measured
with field-gradient NMR diffusometry with a diffusion time of 20 ms. The sharp bend of the curve
for the partially frozen sample at 270 K indicates the saturation water concentration of the
hydration shells cs % 35 %
574 7 Dynamics at Fluid Solid Interfaces: Porous Media and Colloidal Particles
27. 7.4.2.2 Porous Silica Glasses
Diffusion in the adsorbed phase in saturated porous glasses can be studied in the same
way as with the protein systems discussed above. A typical example revealing the
crossover to the partially frozen state of the confined water is demonstrated by the data
in Fig. 7.10. At about –25
C, the bulk-like phase is totally frozen.8
Merely the
interfacial adsorbate layer is still liquid and determines the diffusivity measured in the
system. Actually, the fact that we are really dealing with a liquid phase is best
demonstrated just by this effect, namely, the long-distance translational diffusion of
molecules confined in the interfacial network. The evaluation of the fraction of the
resonance line of the liquid material (see Fig. 7.6) suggests a thickness of the
nonfreezing surface layer of 0.5 nm at À30
C. This corresponds to one to two
molecular monolayers.
According to Fig. 7.10, the water diffusion coefficient measured in the nonfreez-
ing surface layers is a factor of 30 less than the extrapolated value of the unfrozen
Fig. 7.10 Self-diffusion coefficient of water confined in a sample of porous silica glass (product
name Bioran B10, nominal pore size 10 nm) as a function of the reciprocal temperature. The data
have been measured with the aid of field-gradient NMR diffusometry with a diffusion time of
20 ms (Reproduced from Ref. [23] with kind permission of # AIP 1998)
8
Note that – irrespective of the nonfreezing surface layers – the freezing temperature of the bulk-
like phase is reduced slightly according to the Gibbs/Thomson relation which predicts a depression
proportional to the surface-to-volume ratio of the pores [46]. On this basis, NMR techniques have
been suggested for the determination of the pore size and its distribution [47, 48]. With these
methods, the freezing temperature is determined by the more or less abrupt change of the NMR
linewidth at the phase transition.
7.4 Translational Diffusion of Low-Molecular Fluids Under Confinement 575
28. liquid. At first sight, this reduction factor appears to be excessive. However, transla-
tional diffusion takes place in a network of only one to two molecular diameter thick
surface layers. Thus, the porosity is strongly reduced, while the tortuosity is increased
(compare Eq. 7.30). In view of these modified conditions, the reduction by a factor of
30 appears to be quite plausible. It is largely due to the topological-confinement effect
and not to immobilization at adsorption sites.
A further phenomenon characteristic for diffusion in nonfreezing surface layers
is that the self-diffusion coefficient turns out to be time dependent, D ¼ DðtÞ, which
indicates anomalous diffusion properties as expected in the scaling window of
porous media (see Eq. 7.6). The power law evaluated from the data in Fig. 7.11 is
D / tÀ0:3
(7.34)
in a range from 10 to 50 ms. The percolation network formed by the hydration shells
upon freezing of the bulk-like phase appears to approach fractal properties with a
particularly long correlation length [10, 11].
7.4.3 Single-File Diffusion
Even in the percolation network formed by the nonfreezing surface layers of porous
silica samples, the pore dimensions effective for diffusion are large enough to
permit at least topologically two-dimensional displacements of the incorporated
fluid molecules. We now turn to systems that allow only for one-dimensional
Fig. 7.11 Field-gradient NMR diffusometry data for water in the percolation network formed by
the adsorbed phase of a porous silica glass (Bioran B10) at À15
C. The bulk-like water is frozen at
this temperature (Reproduced from Ref. [23] with kind permission of # AIP 1998)
576 7 Dynamics at Fluid Solid Interfaces: Porous Media and Colloidal Particles
29. displacements. Certain zeolites and molecular sieves can have straight pore
channels with diameters not much larger than the incorporated fluid molecules.
The consequence is that molecules cannot pass each other. Displacement steps can
only occur in a single-file manner. As a consequence of this sort of obstruction
effect, subdiffusive displacement features show up. An illustration is shown in
Fig. 2.22.
Single-file diffusion has been demonstrated with the aid of Monte Carlo
simulations for the displacement of particles in an elementary one-dimensional
system with cyclic boundary conditions [49] or under more advanced conditions
with variable channel width [50, 51]. The displacement dynamics of an ensemble of
N particles can be described by superimposed equilibration (or “relaxation”) modes
with relaxation times increasing with the length scale of the system. The longest
relaxation time refers to the total system consisting of N particles. Beyond this time
scale, diffusion becomes normal, and a time-independent diffusion coefficient
D1 / NÀ1
(7.35)
can be defined. In the long-time limit, the particle ensemble is randomly displaced
as a whole. At times shorter than needed for complete equilibration, diffusion tends
to be subdiffusive, and the time dependence of the mean square particle displace-
ment can be described by
z2
/ t1 2=
(7.36)
where z is measured along the one-dimensional pore channel. In this respect, the
attentive reader may remember the analogous behavior of polymers reptating in a
tube (see Eq. 5.241).
The subdiffusive mean square displacement law Eq. (7.36) was experimentally
verified in Refs. [52, 53] using the field-gradient NMR diffusometry technique. The
system studied in Ref. [52] consisted of CF4 molecules (diameter ca. 0.47 nm)
confined in pores of zeolite AlPO4-5 (pore channel diameter ca. 0.73 nm) at 180 K.
The experimental time scale on which Eq. (7.36) was verified was 1–300 ms. It is
needless to say that the pore length considerably exceeded the maximum root-
mean-square displacement probed in the experiments (ca. 3 mm). End effects owing
to exchange with the outside medium did therefore not matter. Furthermore, it was
demonstrated that the obstruction effect increases with the CF4 loading degree of
the pores for obvious reasons.
7.4.4 Diffusion Enhanced by a Coexisting Vapor Phase
If the pore space of porous materials or particle agglomerates is not completely
filled with liquid, the vapor of the liquid inflating the free space will contribute to
diffusion appreciably as a third phase. The diffusivity in the gas phase is four orders
of magnitude larger than in the liquid phase whereas the density is three orders of
7.4 Translational Diffusion of Low-Molecular Fluids Under Confinement 577
30. magnitude smaller. In the case of field-gradient NMR diffusometry, exchange
between the diverse phases on the experimental time scale thus leads to the peculiar
situation that the measured diffusivity is dominated by the vapor while the liquid
phase is responsible for most of the signal. Enhancement factors up to 10 above the
value of the bulk liquid were observed in unsaturated pore spaces just contrary to
the opposite tendency suggested by the pore-space confinement [54–58].
In Ref. [56], the enhancement of translational diffusion by the vapor phase was
directly proven in wet silica fine-particle powders by varying the accessible vol-
ume. The adsorbed water phase at the fine-particle surfaces was first saturated by
exposing the powdery material to a humid atmosphere. In this initial state, the
sample forms a lacunar system containing a considerable volume fraction of free
space available to the vapor phase. The initially loosely packed powder was then
compacted step by step down to 1/7 of the original volume. As a consequence, the
diffusivity initially dominated by the vapor phase was gradually diminished until
the bulk water diffusion coefficient was reached at the strongest densification. This
is revealed by the data in Fig. 7.12: The initially steep spin-echo attenuation curves
indicate a high diffusivity dominated by the vapor phase. The crossover to flat
curves after maximum compaction reflects a much lower diffusivity approaching
that of bulk water in the absence of the vapor phase.
So far, so plausible. However, the situation is a bit more complicated than
expected at first sight. The example described above refers to a polar liquid in a
matrix with polar surfaces. This is to be distinguished from a scenario where a
nonpolar solvent is filled into a polar matrix (or vice versa). As concerns the
effective diffusivity resulting under such circumstances, the tendency can be even
opposite [57]. The second question to be clarified is whether the fast-exchange limit
one intuitively anticipates is warranted. Actually, this is a matter of the pore size as
will be elucidated below [58]. Finally, it must be clarified to what degree diffusion
in the vapor phase is of the ordinary Einstein type (determined by particle–particle
collisions) or of the Knudsen type (limited by particle–wall collisions) [59, 60].
7.4.4.1 Exchange Model for Diffusion in Coexisting Liquid and Vapor Phases
In terms of the exchange concept discussed above, one suspects that translational
diffusion in unsaturated porous media is determined by all three fluid phases,
namely, the adsorbed, bulk-like, and vapor phases. However, as outlined above,
the finding for saturated porous media is that the bulk-like phase dominates
translational diffusion on the time/length scales of typical field-gradient NMR
diffusometry experiments. The decisive factors determining the diffusivity were
shown to be the porosity and the tortuosity, whereas adsorption normally plays a
578 7 Dynamics at Fluid Solid Interfaces: Porous Media and Colloidal Particles
31. minor role. The treatment of diffusion in unsaturated porous media can therefore be
restricted to two phases only, liquid and vapor, forming two interpenetrating
systems of different topology and porosity.9
In the following, the liquid contribution will be labeled by the subscript ‘; and
the vapor phase will be marked by the subscript v. The mass fractions fi in the two
phases are related with the respective mean residence times ti by [61, 62]
fi ¼
ti
t‘ þ tv
i ¼ ‘; vð Þ (7.37)
In terms of the mass densities r‘ and rv, the respective mass fractions read
9
It should be emphasized that this approach is appropriate for translational diffusion at typical
experimental time and length scales. A totally different situation arises for rotational diffusion as
probed by spin relaxation to be discussed further down.
Fig. 7.12 Field-gradient NMR diffusometry data for the incoherent dynamic structure factor
Ginc q; tdiff
À Á
of water in a silica fine-particle sample (product name “Alfasil”; particle diameter
7 nm; specific surface area 400 m2
/g). These room temperature data are plotted as a function of
q2
tdiff, where the wave numberqis proportional to the amplitude and width of the gradient pulses,
and the effective diffusion time tdiff ¼ D À d=3 depends on the timing of the gradient pulses (see
Eq. 3.246). The curves refer to different degrees of compaction: 100% corresponds to the
uncompressed sample with the fine-particle powder just exposed to a humid atmosphere to
reach saturation of the hydration shells. The saturation water content was 38% by weight. The
volume of the sample under strongest compaction was reduced to 16% of the volume of the
uncompressed sample. Steeper decays mean higher effective diffusivities. The diffusivity is thus
reduced upon compaction of the sample (Reproduced from Ref. [56] with kind permission of #
Elsevier 1994)
7.4 Translational Diffusion of Low-Molecular Fluids Under Confinement 579
32. f‘ ¼
1
1 þ ðV0=V‘Þ À 1½ Šðrv=r‘Þ
¼
F
F þ 1 À Fð Þ rv=r‘ð Þ
and fv ¼ 1 À f‘
(7.38)
whereV0 represents the pore-space volume,V‘ is the volume of the liquid phase, and
F ¼
V‘
V0
(7.39)
is the filling factor of liquid in the pore space.
In Sect. 7.4.1.1, diffusive transport in saturated pore spaces was shown to depend
on geometrical restrictions represented by the matrix parameters diffusive tortuosity
tdiff and porosity
P ¼
V0
Vt
(7.40)
(see Eq. 7.30). The total sample volume including matrix and pore space is denoted
by Vt, while V0 is the pore-space volume. In order to link these two parameters, one
can try a tentative ansatz based on Archie’s law [1]. This empirical relation was
originally proposed for the description of the electrical conductivity in saturated
fluid-filled pore spaces. It appears to work satisfactorily with oil well logging
applications. It is not so well established with partially saturated porous media
where substantial deviations from its predictions have been observed [63]. More-
over, in Sects. 4.9.5 and 4.9.6, the comparison of coherent material and electrical
transport properties revealed some intricacies which are not yet entirely understood.
The discrepancies in the transport features may however be less severe if material
transport is incoherent, that is, a matter of self-diffusion. Let us therefore and
nevertheless try the tentative power law
tdiff % PÀe
(7.41)
as an approach with an analytical form analogous to Archie’s law. e is an empirical
exponent. Referring to Eqs. (4.83) and (7.3), the effective (long-range) diffusion
coefficient in the pore space, Deff, is accordingly expected to be reduced by a factor
Pe
relative to its bulk value, D0:
Deff ¼ Pe
D0 (7.42)
In the case of unsaturated porous samples, the situation is more complicated
since we are then dealing with two interpenetrating pore systems of different
effective porosities
580 7 Dynamics at Fluid Solid Interfaces: Porous Media and Colloidal Particles
33. P‘ ¼
V‘
Vt
and Pv ¼
V0 À V‘
Vt
(7.43)
for the liquid and vapor phases, respectively. Employing the ansatz Eq. (7.42)
again, the reduced diffusion coefficient in the liquid phase can be written in the
form [64, 65]
D‘ ¼ Pe‘
‘ D‘;0 ¼ Pe‘
V‘
V0
e‘
D‘;0 ¼ Pe‘
Fe‘
D‘;0 (7.44)
where the exponent e‘ is specific for the liquid phase. D‘;0 is the diffusion coefficient
in the bulk liquid. Equation (7.44) thus links the porosity effective for the liquid
phase, P‘, to the porosity of the whole sample, P ¼ P‘ þ Pv.
The diffusion process in the vapor phase is determined by collisions of molecules
on the one hand with each other and with the pore walls on the other. The term “wall”
may refer both to liquid–vapor interfaces and to inner surfaces of the solid matrix.
The latter mechanism is referred to as Knudsen diffusion. As suggested in Ref. [66],
the diffusion resistance DÀ1
v in the vapor phase is composed of the individual
diffusion resistances according to a “serial connection”
1
Dv
¼
1
DK
þ
1
DE
(7.45)
DÀ1
K is the Knudsen diffusion resistance relevant if molecule/wall collisions would
solely determine the diffusion process. Likewise, DÀ1
E is the Einstein diffusion
resistance which would be pertinent if molecule/molecule collisions would limit the
displacement rate.
Anticipating the power-law ansatz Eq. (7.42) again, the quantities DK and DE can
be represented in terms of diffusive tortuosity factors as before. This permits us to
relate the diffusivities under pore constraints with those under bulk conditions:
DK % Pev;K
v DK;0 ¼ Pev;K
1 À
V‘
V0
ev;K
DK;0 ¼ Pev;K
1 À Fð Þev;K
DK;0 (7.46)
DE % Pev;E
v Dv;0 ¼ Pev;E
1 À
V‘
V0
ev;E
Dv;0 ¼ Pev;E
1 À Fð Þev;E
Dv;0 (7.47)
The exponents ev;K and ev;E account for tortuosity effects under Knudsen and
Einstein conditions, respectively. These quantities can be determined empirically
on the basis of bulk diffusion data [66]. The vapor diffusion coefficient in the
Einstein resistance limit DÀ1
E ) DÀ1
K , when molecule/molecule collisions are rate
limiting, is denoted by Dv;0. As a matter of course, this quantity equals the vapor
diffusion coefficient in bulk.
7.4 Translational Diffusion of Low-Molecular Fluids Under Confinement 581
34. On the other hand, if the diffusion resistance by molecule/wall collisions
prevails, one speaks of the Knudsen limit DÀ1
K ) DÀ1
E . In this case, the vapor
diffusion coefficient will be DK;0 which is specified in Ref. [59] as
DK;0 %
2a
3
ffiffiffiffiffiffiffiffiffiffiffi
8kBT
pm
r
(7.48)
where kB is the Boltzmann constant, T is the absolute temperature, m is the
molecular mass, and a is the mean radius of the vapor-phase domains.
Under wetting conditions, that is, if adhesive forces at the pore walls outbalance
the cohesive tendency, the liquid in partially saturated pores will cover the walls in
the form of a more or less homogeneous layer. Furthermore, approximating the pore
by a hollow cylinder for simplicity, permits us to estimate the diameter of the vapor
phase domain as a function of the liquid filling factor F [55, 66]:
2a % d 1 À Fð Þ1=2
(7.49)
where d represents the mean pore diameter. Combining this with Eq. (7.48) gives
the quantity
DK;0ðFÞ %
d
3
ffiffiffiffiffiffiffiffiffiffiffiffiffiffiffiffiffiffiffiffiffiffiffiffiffi
8kBT 1 À Fð Þ
pm
r
(7.50)
needed for the determination of the Knudsen diffusion resistanceDÀ1
K on the basis of
Eq. (7.46).
7.4.4.2 Formal Treatment for Field-Gradient NMR Diffusometry
As a standard variant of field-gradient NMR diffusometry, we refer to the
stimulated-echo method in the short-gradient pulse limit as described in Sect.
3.2.2.3. The problem is to distinguish partial magnetizations for the two phases
under consideration. Coherence evolution during the encoding interval t1 (see
Fig. 3.25b or d) and the subsequent radio frequency pulse produce longitudinal
magnetization components Mz;‘ðz; tÞ and Mz;vðz; tÞ modulated along the field-
gradient direction (here arbitrarily assumed along the z-axis of the laboratory
frame). In the second radio frequency pulse interval of length t2, these components
evolve under the influence of spin–lattice relaxation, diffusion, and interphase
exchange.
The combined description of these processes is possible on the basis of the
Hahn/Maxwell/McConnell equations for exchange and relaxation, Eq. (3.312),
suitably supplemented by the right-hand term of Fick’s second law for diffusion,
582 7 Dynamics at Fluid Solid Interfaces: Porous Media and Colloidal Particles
35. Eq. (2.167). We are thus dealing with the following set of equations of motions for
the two partial magnetizations:
dMz;‘ z; tð Þ
dt
¼Dl
d2
Mz;‘ z; tð Þ
dz2
À
Mz; ‘ z; tð Þ À M0; ‘
T1;l
À
Mz;‘ z; tð Þ
tl
þ
Mz;v z; tð Þ
tv
;
dMz;v z; tð Þ
dt
¼Dv
d2
Mz;v z; tð Þ
dz2
À
Mz;v z; tð Þ À M0;v
T1;v
À
Mz;v z; tð Þ
tv
þ
Mz;‘ z; tð Þ
tl
: (7.51)
The principle of treatments combining relaxation and diffusion was already devel-
oped in Ref. [67] in the early days of NMR. The above relations will accordingly
be called Hahn/Maxwell/McConnell/Torrey (HMMT) equations [58]. T1; ‘ and T1;v
are the longitudinal relaxation times of nuclear spins in the respective fluid
phases in the absence of exchange. M0;‘ and M0;v are the equilibrium magnetizations
in the liquid and vapor phases, respectively. The respective mean residence
times the adsorbate molecules spend in the liquid and vapor phases are denominated
by t‘ and tv. Analogously, the self-diffusion coefficients in the two fluid phases are
D‘ and Dv.
The first term on the right-hand side of either HMMT equation describes self-
diffusion inside the individual phases. The second term accounts for longitudinal
relaxation in the absence of molecular exchange. The other terms represent
exchange rates between the two phases.
As a relatively rough simplification, the HMMT equations anticipate that both
phases are spread uniformly in the entire pore space. That is, exchange of molecules
between the two phases is assumed to be possible at any position without prior need
that the particles diffuse to a liquid/vapor interface. In other words, the time needed
for diffusive transport to interfaces is considered to be implied in correspondingly
modified exchange rates [58]. Thus, the mean residence times t‘ and tv must be
taken as effective quantities. On the one hand, they are determined by the spatial
extensions of the phase regions, and on the molecular mobilities therein on the
other. In addition, transport barriers at the interfaces may also play a role.
Neglecting diffusion, relaxation, and exchange during the encoding intervalt1 of
the stimulated-echo RF pulse sequences depicted in Fig. 3.25, the solutions for the
longitudinal magnetization components Mz;i z; 0ð Þ immediately after the second
radio frequency pulse are given by
Mz;i z; 0ð Þ ¼ ÀM0;i cos qzð Þ ði ¼ ‘; vÞ (7.52)
with the familiar wave number q ¼ ggd. M0;i is the Curie magnetization of phase i.
The field gradient g is assumed to be aligned along the z direction. d is the width of
the gradient pulses, and g is the gyromagnetic ratio. Equation (7.52) provides the
initial conditions for the differential equation system Eq. (7.51).
The diffusion interval t2 of the stimulated-echo RF pulse sequence is the proper
measuring period in which diffusion and exchange processes are to be probed.
7.4 Translational Diffusion of Low-Molecular Fluids Under Confinement 583
36. The respective diffusion terms, that is, the first terms on the right-hand sides of the
HMMT equations Eq. (7.51), are evaluated as
D‘d2
Mz;‘ z; tð Þ dz2
¼ À D‘q2
Dvd2
Mz;v z; tð Þ dz2
¼ À Dvq2
(7.53)
For the ease of calculation, the two partial magnetizations can be combined to
the two-dimensional magnetization vectors
Mz z; tð Þ ¼
Mz;‘ z; tð Þ
Mz;v z; tð Þ
and M0 ¼
M0;‘
M0;v
(7.54)
In matrix form, the HMMT equation system thus reads (see Sect. 3.4)
dMz z; tð Þ
dt
¼ $
LMz z; tð Þ þ R0 (7.55)
where
$
L ¼
À q2
D‘ þ
1
T1;‘
þ
1
t‘
!
1
tv
1
t‘
À q2
Dv þ
1
T1;v
þ
1
tv
!
0
B
B
@
1
C
C
A and R0 ¼
M0;‘
T1;‘
M0;v
T1;v
0
B
B
@
1
C
C
A
(7.56)
The matrix $
L comprises the rate constants due to diffusion, relaxation, and
exchange, while R0 accounts for longitudinal relaxation. The solution of the linear
differential equation given in Eq. (7.55) is
Mzðz; tÞ ¼ exp $
Lt
n o
Mzðz; 0Þ þ exp $
Lt
n o
À 1
h i
$
LÀ1
R0 (7.57)
$
LÀ1
represents the inverse matrix of L , and Mz z; 0ð Þ is the two-dimensional
magnetization vector at the beginning of the diffusion interval t2.
The first term on the right-hand side of Eq. (7.57) is spatially modulated via
Mz z; 0ð Þ (see Eq. 7.52). Consequently, it will be this term that is transferred by the
third radio frequency pulse into the final signal, the stimulated echo.10
The second
term can be discarded because it does not contribute to the stimulated-echo signal.
The effect of the exponential factor expð$
LtÞ on the two-dimensional magnetiza-
tion vector Mz z; 0ð Þ in Eq. (7.57) can be evaluated by first diagonalizing the matrix
and then applying the power series expansion analogous to the treatment outlined in
Sect. 3.4.2. The result is
10
A detailed analysis of echo formation mechanisms can be found in Ref. [39].
584 7 Dynamics at Fluid Solid Interfaces: Porous Media and Colloidal Particles
37. MzðtÞ ¼ Mz;‘ðtÞ þ Mz;vðtÞ ¼ A1el1t
þ A2el2t
(7.58)
This is the magnetization to which the amplitude of the stimulated echo ast q; tð Þ,
that is, the signal to be measured in this sort of experiment, will finally be
proportional. Under the conditions mentioned above, the diffusion time t can be
equated with the interval t2. The effective rates l1;2 in the exponents are given by
l1;2 ¼ À
1
2
q2
D‘ þ Dvð Þ þ
1
T1;‘
þ
1
T1;v
þ
1
t‘
þ
1
tv
Ç
ffiffiffiffiffiffiffiffiffiffiffiffiffiffiffiffiffiffiffiffiffiffiffiffiffiffiffiffiffiffiffiffiffiffiffiffiffiffiffiffiffiffiffiffiffiffiffiffiffiffiffiffiffiffiffiffiffiffiffiffiffiffiffiffiffiffiffiffiffiffiffiffiffiffiffiffiffiffiffiffiffiffiffiffiffiffiffiffiffiffiffiffiffi
q2 D‘ À Dvð Þ þ
1
T1;‘
À
1
T1;v
þ
1
t‘
À
1
tv
2
þ
4
t‘tv
s #
(7.59)
The amplitude factors are found to be
A1;2 ¼ Æ
tv
l2 À l1
l1;2 þ q2
D‘ þ
1
T1;‘
þ
1
t‘
þ
1
tv
l2;1 þ q2
D‘ þ
1
T1;‘
þ
1
t‘
Mz;‘ð0Þ À
1
tv
Mz;vð0Þ
#
(7.60)
In the limit defined by the conditionsfv ( f‘ % 1,Dv ) D‘; andT1;v ) T1;‘, the
attenuation of the relative stimulated-echo amplitude can be approached by [58, 68]
ast q; t2ð Þ
ast q; 0ð Þ
/ exp Àq2
D‘ þ
fvDv
q2t‘ fvDv þ 1
t2
'
¼ Ginc t ¼ t2ð Þ (7.61)
The proportionality factor refers to attenuation by spin–lattice relaxation which is a
constant contribution, provided that the pulse intervals are kept constant in the
experiment. In this limit, the right-hand side thus turns out to be equal to the
incoherent dynamic structure factor GincðtÞ for the particular diffusion time t ¼ t2
and an effective diffusion coefficient
Deff % D‘ þ fvDv q2
t‘ fvDv þ 1
À ÁÀ1
(7.62)
7.4.4.3 Low Wave-Number Limit (q2
t‘ fvDv ( 1)
For small gradient pulses complying with the low wave-number limitq2
t‘ fvDv ( 1,
the effective diffusivity will be reduced toDeff % D‘ þ fvDv (not to be confused with
the fast-exchange case which will be described further down!). Inserting Eqs. (7.44)
and (7.45) into this expression gives
7.4 Translational Diffusion of Low-Molecular Fluids Under Confinement 585
38. Deff ¼Pe‘
Fe‘
D‘;0 þ fv
DKDE
DK þ DE
¼Pe‘
Fe‘
D‘;0
þ
1 À Fð Þ
r‘=rvð ÞF þ 1 À F½ Š
Pev;K
1 À Fð Þev;K 1
3 d 1 À Fð Þ
1
2
ffiffiffiffiffiffiffiffi
8kBT
pm
q
Pev;E
1 À Fð Þev;E
Dv;0
Pev;K
1 À Fð Þev;K 1
3 d 1 À Fð Þ
1
2
ffiffiffiffiffiffiffiffi
8kBT
pm
q
þ Pev;E
1 À Fð Þev;E
Dv;0
(7.63)
where the parameters f v; DK; DE; DK;0 have been replaced by the relations given in
Eqs. (7.38), (7.46), (7.47), and (7.50). The first term on the right-hand side of
Eq. (7.63) is the contribution of the liquid phase, while the second term refers to the
vapor phase. In the frame of the low-wave-number limit, the effective diffusivity
can then be evaluated by fitting the monoexponential decay function
ast q; t2ð Þ=ast q; 0ð Þ / exp Àq2
Defft2
È É
¼ Ginc t2ð Þ (7.64)
to the initial part of the experimental stimulated-echo attenuation curves. Exem-
plary data are presented in the plots shown in Fig. 7.13a, b.
In the limit of high liquid filling degrees, F ! 1, Eq. (7.63) approaches
Deff F ! 1ð Þ % Pe‘
Dl;0Fe‘
/ Fe‘
(7.65)
Diffusion is then dominated by the contribution of the liquid phase so that
the effective diffusion coefficient increases with increasing filling degree. The
value finally adopted for saturated pore spaces is the bulk value times the factor
Pe‘
, Deff F ¼ 1ð Þ % Pe‘
D‘;0 . In the opposite limit, F ( 1, the effective diffusion
follows a reversed tendency
Deff F ( 1ð Þ /
rv
r‘
1
F
(7.66)
where r‘=rv ) 1 and Fr‘=rv ) 1 (for finite liquid filling degrees). In this case, the
effective diffusivity will be dominated by the vapor phase. Deff consequently
decreases with increasing filling degree. Thus, there are two converse tendencies
competing with each other. One therefore expects a minimum at intermediate liquid
filling degrees.
7.4.4.4 Slow Liquid/VaporExchange (t‘ ) t2 and tv ) t2)
The exchange dynamics is specified by the respective mean residence times in the
liquid and vapor phase,t‘ andtv. The experimental time scale is given by the interval
t2 of the stimulated-echo pulse schemes Figs. 3.25b or d. In the slow-exchange
limit, t‘ ) t2 and tv ) t2, molecular exchange can be neglected during t2:
586 7 Dynamics at Fluid Solid Interfaces: Porous Media and Colloidal Particles
39. The stimulated-echo signal will then be composed of two independent contributions
from the liquid and from the vapor phase. According to Eqs. (7.58) and (7.59),
attenuation by diffusive displacements in either phase thus leads to a weighted
superposition of two exponentials, one for each phase:
ast q; t2ð Þ
ast q; 0ð Þ
% f‘eÀ D‘q2
þT1;‘ð Þt2
þ fveÀ Dvq2
þT1;vð Þt2
(7.67)
Since the number of spins in the vapor phase is usually much smaller than in the
liquid phase, fv ( f‘, the signal will be governed by the liquid component, that is,
by the first term on the right-hand side.
7.4.4.5 Fast Liquid/Vapor Exchange (t‘ ( t2 and tv ( t2)
Fast exchange relative to the experimental time scale t2, that is, t‘ ( t2 and tv ( t2,
means frequent transfers back and forth between the liquid and vapor phases.
Molecules experience displacement rates of both phases weighted according to
the respective number fractions. The consequence is that diffusion can be described
by an effective diffusion coefficient given as the weighted average
Deff % f‘D‘ þ fvDv (7.68)
The coefficients D‘ and Dv are given in Eqs. (7.44) and (7.45), respectively.
Replacing the effective diffusion coefficient in Eq. (7.64) by the expression given
in Eq. (7.68) provides the incoherent dynamic structure factor for the fast-exchange
limit.
7.4.4.6 Applications to Partially Saturated Porous Silica Glasses
The plots in Fig. 7.13 show typical data for the effective diffusion coefficient Deff as
a function of the filling degree F. The data have been measured in cyclohexane and
water in unsaturated porous silica glass. These two solvents are taken as
representatives for nonpolar and polar adsorbate species, respectively. As a conse-
quence of the different adsorption tendencies to polar surfaces, the distribution of
the liquid phases in the pore space varies in a distinguishable way with the imbibing
degree [55, 64, 69] as revealed by the effective diffusion behavior. The vapor
enhancement effect on diffusion is obvious in both cases.
The respective ratios of the densities in the vapor and liquid phases under normal
conditions are rv=r‘½ Šcyclohexane ¼ 5:9 Â 10À4
and rv=r‘½ Šwater ¼ 2:5 Â 10À5
[70], so
that the NMR signal probed in such experiments originates practically entirely from
the liquid phase. The diffusivities in the bulk liquids at 298 K are known to be
Dcyclohexane
‘;0 ¼ 1:4 Â 10À9
m2
=s and Dwater
‘;0 ¼ 2:3 Â 10À9
m2
=s. These values are to
7.4 Translational Diffusion of Low-Molecular Fluids Under Confinement 587
40. be compared with the much larger bulk diffusivities in the vapor under normal
conditions [70]: Dcyclohexane
v;0 ¼ 8:5 Â 10À6
m2
=s and Dwater
v;0 ¼ 2:4 Â 10À5
m2
=s .
Apart from the pore confinement effect, that is, Archie’s law, the resulting diffusion
behavior is then a matter of how far the lower density is compensated by the higher
diffusivity in the vapor phase as a function of the filling degree F.
Fig. 7.13 Effective diffusion coefficients Deff in partially saturated porous silica glasses (trade
name VitraPor #5, nominal pore diameter 1 mm, porosity 43%) as a function of the filling degree F
at room temperature. The data have been measured with the stimulated-echo based field-gradient
NMR diffusometry technique with a diffusion time t % t2 ¼ 200 ms . (a) Effective diffusion
coefficient of cyclohexane as a nonpolar solvent species. (b) Effective diffusion coefficient of
water as a polar counterpart. The effective diffusion coefficients have been evaluated by fits of
Eq. (7.64) to experimental stimulated-echo attenuation curves for low wave numbers. The solid
lines represent fits of Eq. (7.63) to the data. The values of characteristic exponents are given in the
insets (Reproduced from Ref. [58] with kind permission of # AIP 2004)
588 7 Dynamics at Fluid Solid Interfaces: Porous Media and Colloidal Particles
41. The two data sets in Fig. 7.13 show a number of remarkable features and
differences. The data for the nonpolar solvent cyclohexane steadily decrease from
high values at low filling degrees to low values approaching the bulk value when
saturation of the pore space is reached. That is, DeffðFÞ ! Dcyclohexane
‘;0 throughout
and contrary to the pore confinement tendency. That is, the vapor phase contributes
significantly in almost the entire range of the filling degree. The influence is largely
dominated by the limit represented by Eq. (7.66).
This finding is in contrast to the water data. In this case, the effective diffusivities
are below the bulk value in the whole range, DeffðFÞDwater
‘;0 . A pronounced
minimum is reached at F % 0:28 as a result of the competitive actions of the
contributions by the vapor and liquid phases. The flanks of the minimum are
described by Eq. (7.65) (high liquid filling degrees) and Eq. (7.66) (low liquid
filling degrees).
The reason for the different behaviors of the two adsorbate species must mainly
be sought in the different density ratios, rv=r‘½ Šcyclohexane ) rv=r‘½ Šwater (see the
values given above and Eq. 7.66). In the case of cyclohexane, the large value of this
ratio obviously boosts the vapor contribution relative to that of the liquid phase,
while the situation is more balanced for water.
The size of the liquid-phase domains in partially saturated porous media is also a
matter of the mean pore diameter. At a given filling degree, the domains are
expected to increase with the pore size. The mean residence time and hence the
exchange limits will vary with the pore size. This was demonstrated in Refs. [57,
71], where it was shown that exchange is fast in unsaturated silica glass Vycor
(4 nm nominal pore diameter), whereas it is slow in the unsaturated VitraPor #4
(10 mm nominal pore size). This is to be compared with the intermediate scenario
under consideration here for VitraPor #5 (1 mm nominal pore size).
The diffusion time probed in the experiments represented by Fig. 7.13 was
200 ms. On this time scale, the root-mean-square displacement exceeds the corre-
lation length of the medium by far, so that the character of diffusion is normal.
However, at diffusion times ( 1ms, the root-mean-square displacements tend to be
in the scaling window mentioned in Sect. 4.9.3.2. Under such conditions, the
measured diffusivities are expected to depend on the diffusion time as it was indeed
reported in Refs [29, 72].
7.5 Reorientational Dynamics in Surface-Dominated Systems
7.5.1 From Translational to Rotational Diffusion
In the previous sections, we have seen that translational diffusion is substantially
affected by mesoscopic confinement. The range of the confinement effects was
shown to be within about one order of magnitude. Nevertheless, though pro-
nounced, the translational phenomena appear to be moderate if compared with
7.5 Reorientational Dynamics in Surface-Dominated Systems 589
42. the much stronger influence of adsorbate/surface interactions on reorientational
dynamics. Actually, the time constants characterizing rotational diffusion can vary
by many orders of magnitude upon mesoscopic confinement.
Several techniques probing reorientational dynamics have been described in
Chap. 3. In general, the methods detailed there probe orientation correlation
functions of the type
GorðtÞ ¼ 4p À1ð Þm
Yl;mðtÞYl;Àmð0Þ
(7.69)
where the spherical harmonics Yl;mðtÞ are composed of sine and cosine terms of the
polar and azimuthal angles #ðtÞ and ’ðtÞ of a molecular axis relative to an external
field. As the most versatile measuring principle, let us now focus on spin relaxation,
that is, field-cycling and transverse NMR relaxometry. The degree of the relevant
spherical harmonics is then l ¼ 2, while the order can be m ¼ 0; 1; 2. In Sect. 7.2.3,
exchange limits of spin relaxation have already been discussed for the two-phase/
fast-exchange model which we will employ in the following.
The subject of Sects. 7.5.2, 7.5.3, 7.5.4, 7.5.5, 7.5.6, and 7.5.7 will be diamag-
netic systems where spin relaxation is dominated by interactions among like
dipoles. Cases where spin relaxation is affected or even governed by electron-
paramagnetic impurities on the pore surfaces will be referred to afterward in
Sect. 7.5.8.
7.5.2 Spin–Lattice Relaxation in Low-Molecular Solvents
Confined in Inorganic Porous Media
7.5.2.1 Polar Liquids at Polar Surfaces (“strong adsorption”)
The consequence of strong adsorption defined in Sect. 7.3 is that adsorbate
molecules are effectively displaced along polar surfaces on a time scale QÀ1
tth
in a series of desorption/bulk-excursion/readsorption cycles. The intermittent
excursions to the bulk-like phase can be quite large relative to the displacement
steps within the adsorbed phase. The result is bulk mediated surface diffusion
(BMSD) herein before mentioned [16, 17]. Effectively, this is a step-like diffusion
mechanism along surfaces as schematically illustrated in Fig. 7.14. In principle, the
displacement steps on the surface are unrestricted. This process therefore reflects
features of Le´vy walks [73] as analytically demonstrated in Ref. [19].
The plots in Figs. 7.3b and 7.15 show typical data of the spin–lattice relaxation time
for water under mesoscopic confinement in polar media as a function of the Larmor
frequency. Below the megahertz regime, the frequency dispersion T1 ¼ T1 nð Þ
turns out to be remarkably steep while bulk water does not show any frequency
dependence in this particular frequency window. In Sect. 7.3, we have associated
this strong low-frequency dispersion with the strong-adsorption limit. Other polar
590 7 Dynamics at Fluid Solid Interfaces: Porous Media and Colloidal Particles
43. adsorbate species in diamagnetic polar matrices show the same behavior as
exemplified by the diverse data sets in Fig. 7.3a–c. The pronounced frequency
dispersion in polar liquids is in contrast to non-polar adsorbate fluids which will be
discussed in the subsequent Section.
We know that the relationship TÀ1
1 ¼ TÀ1
1 nð Þ directly reflects the Fourier
transform of the orientation correlation function Eq. (7.69). The experimentally
accessible frequency window, 102
Hz n 109
Hz corresponding to 2 Â 103
rad=s
o 2 Â 109
rad=s in terms of angular frequencies, is conjugate to the time range
5 Â 10À10
s t 5 Â 10À4
s. This isthe timescale towhich thefollowingdiscussion
will refer.
The correlation time for molecular reorientations in bulk water at room temper-
ature is of the order tb % 10À12
s. That is, all memory to the initial orientation of a
molecule will be lost after a few picoseconds. This is to be compared with the
reorientation dynamics of water confined in mesoscopic porous media. Since the T1
dispersion in Fig. 7.15 retains a finite slope even down to the kHz regime, finite
orientation correlations must exist on a time scale up to about 10À4
s. This is
remarkable eight (!) orders of magnitude longer than in bulk.
On the other hand, the confinement effect on translational diffusion was shown
in Sect. 7.4.1 to be less than a single order of magnitude in the same sort of systems.
How does that fit together? An explanation of this striking (but anyway apparent)
“discrepancy” will follow below.
Fig. 7.14 Schematic representation of the bulk-mediated surface diffusion (BMSD) mechanism:
A particle starting at point P on the surface of a solid matrix is displaced within the adsorbed phase
along the surface (trajectories drawn as black solid lines). Intermittently, it can be desorbed and
perform excursions to the bulk-like phase (trajectories drawn as gray dotted lines with shades).
After readsorption, it continues to diffuse within the adsorbed phase, and so on until it finally
escapes to the vastness of the bulk-like phase (arrow). The black solid trajectories in combination
with the straight dashed lines between desorption and readsorption points may be termed “surface
diffusion.” The statistics of these effective displacements along surfaces can be described as Le´vy
walks [16, 19]
7.5 Reorientational Dynamics in Surface-Dominated Systems 591
44. An important finding is that the confinement effect on spin–lattice relaxation
vanishes when the frequencies approach the upper end of the accessed range, that is,
n ! 3 Â 108
Hz in the case of the experiments represented by Fig. 7.15. Roughly,
this corresponds to the conjugate time value t ! 5 Â 10À10
s: The spin–lattice
relaxation times or rates coincide then with the values measured in bulk. The
conclusion is that short-scale or “local” motions remain practically unaffected by
mesoscopic confinements as concerns the fluctuation rate.
However, a slight anisotropy of rotational diffusion must nevertheless exist.
Being adsorbed means that the molecule has adopted a certain preferential orienta-
tion relative to the local site on the pore surface and, hence, relative to external field
directions.11
This characteristic anisotropy in the adsorbed phase leaves some
slowly decaying residual correlation which is responsible for the low-frequency
dispersions revealed by the data in Fig. 7.3 and Fig. 7.15. Actually, this is the
system-specific longtime tail of the orientation correlation function mentioned in
Fig. 7.15 Frequency dispersion of the spin–lattice relaxation time in light and heavy water
confined in a porous silica glass (trade name Bioran B30; nominal pore size 30 nm). In order to
account for the different spin coupling constants of the respective resonant nuclei, that is, protons
and deuterons, the data are presented relative to the corresponding bulk values Tbulk
1 . The
coinciding data for proton and deuteron spin–lattice relaxation suggest that all relevant spin
interactions are mainly of an intramolecular nature, so that reorientational dynamics is probed
indeed. The time scale conjugate to the frequency scale of the experiments is indicated as a second
abscissa axis (Reproduced from Ref. [22] with kind permission of # APS 1995)
11
Provided that motional averaging is still incomplete, the preferential orientation of adsorbate
molecules relative to adsorbent surfaces can be demonstrated by dipolar or quadrupolar splitting of
NMR resonance lines [74, 75] or, if such splitting is not resolved, by multiple-quantum filtering
spectroscopy which is based on residual dipolar or quadrupolar couplings [76, 77].
592 7 Dynamics at Fluid Solid Interfaces: Porous Media and Colloidal Particles

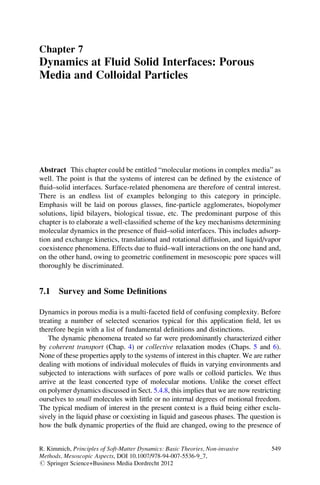
![solid surfaces and a (possibly random) pore space topology. The length scale of
interest is usually specified as “mesoscopic” which ranges from atomistic lengths up
to micrometers.
7.1.1 Characterization of Pore Spaces
Before proceeding, let us first resume the discussion led in Sect. 4.9.1, where a
number of basic parameters for the characterization of pore spaces have been defined
[1]. In the following, we will speak of “pore spaces” irrespective of whether this
refers to a compact porous medium or a bed of particles or particle agglomerates in
general. As the most elementary quantity characterizing confinements, we know
already the porosity, that is, the ratio of the pore-space volume and the volume of
the total system:
P ¼
Vpores
Vtotal
(7.1)
As a characteristic measure of the topological pore-space constraints, the tortuos-
ity has been introduced in Sect. 4.9.1. This quantity is sometimes defined as the mean
ratio of the shortest path length, ‘i; f , and the straight distance between an initial
starting and a finishing point, ri; f (see Fig. 7.1):
t ¼
‘i; f
ri; f
( )
(7.2)
Where ‘i; f is the chemical distance between the starting and finishing points.
Since we will be dealing with diffusion and relaxation problems in the following,
we will prefer another definition which is in frequent use as well: The diffusive
tortuosity
tdiff ¼
D0
Deff
(7.3)
is the quotient of the diffusion coefficients effective in bulk, D0, and under pore-
space confinement, Deff , on a length scale exceeding the correlation length (see
below). This definition is of a more practical nature and should not be confused with
that given in Eq. (7.2).
Another quantity we have encountered before is the correlation length of a
macroscopically isotropic pore space. This parameter characterizes the decay of
the spatial pore-space correlation function. Considering pairs of positions R1 and R2
in the sample, the following correlation function can be defined:
G rð Þ ¼ w R1ð Þw R2ð Þh i ¼ wð0Þw rð Þh i (7.4)
550 7 Dynamics at Fluid Solid Interfaces: Porous Media and Colloidal Particles](data:image/gif;base64,R0lGODlhAQABAIAAAAAAAP///yH5BAEAAAAALAAAAAABAAEAAAIBRAA7)