𓀤Call On 6297143586 𓀤 Sonagachi Call Girls In All Kolkata 24/7 Provide Call W...
Ubisoft Reports Full-Year 2009-2010 Results
1. ®
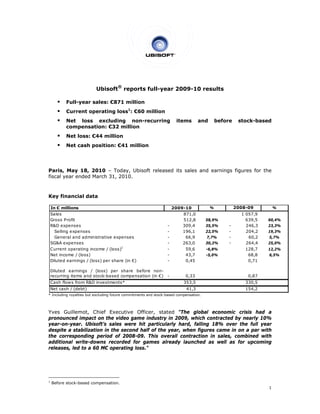
Ubisoft reports full-year 2009-10 results
r 0
Full-year s
sales: €87 million
71
perating lo 1: €60 million
Current op
C oss
Net loss excludinng non-r recurring items and
a befo
ore stock
k-based
compensa
c ation: €32 million
Net loss: €
€44 million
Net cash p
position: €
€41 million
n
Paris, May 18, 22010 – Tooday, Ubiso released its sales and earnin
oft d ngs figures for the
fiscal ye ended March 31, 2
ear M 2010.
Key fin
nancial dat
ta
In € millions 2009-10
2 % 2008-09
9 %
Sales 871,0 1 057
7,9
Gross P rofit 512,8 58,9% 639
9,5 60,4%
%
R&D exp penses - 309,4 35,5% - 246
6,3 23,3%
%
Selling expenses
g - 196,1 22,5% - 204
4,2 19,3%
%
Gener and admin
ral nistrative exp
penses - 66,9 7,7% - 60
0,2 5,7%
%
SG&A ex xpenses - 263,0 30,2% - 264
4,4 25,0%
%
Current operating in ncome / (loss )1 - 59,6 -6,8% 128
8,7 12,2%
%
Net incoome / (loss) - 43,7 -5,0% 68
8,8 6,5%
%
Diluted earnings / (looss) per sha re (in €) - 0,45 0,
,71
Diluted earnings / (loss) per share befo re non-
recurrin g items and stock-based compensatio (in €) -
on 0,33 0,
,87
Cash flo s from R&D investment
ow D ts* 353,5 330
0,5
Net cas h / (debt) 41,3 154
4,2
* Including royalties but e
g excluding future commitments and stock-based compensation
e n.
Yves G Guillemot, Chief Exec cutive Officer, stated "The glo
d obal econoomic crisis had a
s
pronoun nced impac on the vi
ct ideo game industry in 2009, whi
n ich contrac
cted by nearly 10%
year-onn-year. Ubi isoft’s sales were hit particularl hard, falling 18% over the f
s ly full year
despite a stabiliza
ation in the second ha of the ye
alf ear, when f
figures cam in on a p with
me par
the corrresponding period of 2008-09. This overa contract
g f all tion in sale combin
es, ned with
addition write-d
nal downs recorded for games alrea
g ady launch
hed as wel as for up
ll pcoming
releases led to a 60 M€ oper
s, rating loss."
1
Before s
stock-based compensation.
1
2. Sales
Sales for the fourth quarter of 2009-10 came to €210 million, up 1.9% on the
€206 million recorded for the same period of 2008-09 (up 0.5% at constant exchange
rates).
Full-year sales for fiscal 2009-10 totaled €871 million versus €1,058 million for fiscal
2008-09, representing a decrease of 17.7% (down 17.7% also at constant exchange
rates).
Fourth-quarter sales were slightly higher than the guidance of around €200 million issued
when Ubisoft released its sales figures for the third quarter of 2009-10. This performance
reflects the combined impact of:
− The accounting restatement of around €8 million in marketing cooperation
expenses. These costs were previously deducted directly from the top-line sales
figure but are now included in SG&A expenses.
− A strong increase in sales of Just Dance®, which, in the total fiscal year, sold-in
almost 3 million units. This performance was particularly impressive as the game
was only available on a single platform – the Wii™.
− The ongoing exceptional performance delivered by Assassin’s Creed® II which
sold-in nearly 9 million units during the year.
− The launch of Red Steel® 2 for the Wii™, which received very good reviews and
whose performance was in line with recently revised forecasts.
− Sales of Avatar that outstripped the most recent forecasts, notably on Wii™.
During the first four months of calendar 2010, Ubisoft's gained market shares
corresponding to 9.9% in Europe (versus 8.5% one year earlier) and 6.8% in the United
States (against 5.3%).
Main income statement items
Gross profit represented a lower percentage of sales in 2009-10, coming in at 58.9%
(€512.8 million) against 60.5% (€639.5 million) in 2008-09. As previously announced,
this contraction was primarily due to the sharp drop in back-catalog sales from
€220 million (with a gross margin of around 50%) in 2008-09 to €110 million (with a
negative gross margin of nearly 10%) in 2009-10. Back-catalog sales in 2009-10 were
notably weighed down by the impact of excess inventories of DS games which the
Company had to clear or write down in a very competitive environment also marked by
high levels of piracy.
Gross profit also suffered from the low number of games launches for the higher margin
consoles, Xbox 360®, PlayStation®3 and PC. This was particularly the case as gross
margins for Xbox 360® and PlayStation®3 games rose year-on-year. Gross margins
remained stable for Wii™ games.
Ubisoft ended the year with a €59.6 million current operating loss before stock-based
compensation, a higher figure than the previously announced guidance of around
€50 million. This difference was primarily attributable to additional write-downs recorded
both for games launched during the year and for upcoming releases.
The current operating loss figure reflects the following combined factors:
A €126.7 million decrease in gross profit.
2
3. A €63.1 million increase in R&D expenses, which came to €309.4 million,
representing 35.5% of sales, versus €246.3 million (23.3% of sales) in 2008-09.
As previously mentioned, this rise was chiefly attributable to accelerated R&D
depreciation, which amounted to nearly €60 million for the fiscal year.
SG&A expenses on a par with 2008-09 in absolute value terms (€263.0 million
against €264,4 million) but higher as a percentage of sales (30.2% versus
25.0%).
− Variable marketing expenses totaled €143.6 million (16.5% of sales)
compared with €153.3 million (14.4% of sales) in 2008-09.
− Structure costs stood at €119.4 million (13.7% of sales) versus €111.1 million
(10.5% of sales) in 2008-09.
Ubisoft recorded an operating loss of €72.1 million in 2009-10 compared with operating
income of €113.5 million for the previous fiscal year. The 2009-10 figure includes stock-
based compensation of €12.1 million (€16.9 million in 2008-09).
Net financial income came to €4.7 million (compared with net financial expense of
€4.8 million in 2008-09), breaking down as follows:
€0.5 million in financial charges compared with financial income of €0.5 million in
2008-09.
€5.2 million in foreign exchange gains, against €5.3 million in foreign exchange
losses in 2008-09.
Ubisoft ended fiscal 2009-10 with a €43.7 million net loss, representing a diluted loss per
share of €0.45, versus net income of €68.8 million and diluted earnings per share of
€0.71 in 2008-09.
Excluding non-recurring items and before stock based compensation, the net loss figure
would have amounted to €31.6 million, representing a diluted loss per share of €0.33,
versus net income of €84.7 million and earnings per share of €0.87 for 2008-09.
Main cash flow statement and balance sheet items
Cash flows from operating activities came to a negative €90.1 million (versus a positive
€27.8 million in 2008-09), reflecting cash flows from operations of negative €56.7 million
(€26.1 million in 2008-09) and a €33.4 million increase in working capital requirement
(compared with a €1.7 million decrease in 2008-09). This increase was due to a
€74.5 million rise in tax items, which was partly offset by a €29.3 million improvement in
trade receivables, inventory and trade payables.
At March 31, 2010, Ubisoft had a net cash position of €41.3 million versus €154.2 million
at March 31, 2009. The year-on-year change reflects the following main movements in
2009-10:
- The above-mentioned €90.1 million net cash outflow from operating activities.
- €19.1 million in purchases of tangible and intangible assets.
- Acquisitions totaling €9.1 million.
- Proceeds from the issue of capital amounting to €4.8 million following employee
rights issues and the exercise of stock options.
- A €0.6 million effect from exchange rate fluctuations.
3
4. Outlook
Yves Guillemot stated, "We forecast a return to profitable growth in 2010-11 with
positive cash flow generation, driven by a games line-up that is more closely tailored to
growth segments and based on strong franchises. We also expect to see the first
concrete results from our investments in on-line games and services. Lastly, the
upcoming launches of new consoles, including Natal and Sony Move, should enable us to
capitalize on the technology investments that we have undertaken in recent years and
re-energize the casual games segment. At the same time, we will continue to reorganize
our studios and enhance our development teams' productivity. These reorganizational
moves will enable us to release new iterations of our major franchises on a more regular
basis, and guarantee high quality levels. This will allow us to secure a level of highly
profitable recurring sales while continuing to tap the new growth opportunities in our
industry."
Sales for the first quarter of 2010-11
The first three months of 2010-11 will see the following main releases:
- Splinter Cell Conviction™ for Xbox 360® and PC
- Prince of Persia The Forgotten Sands™ for Xbox 360®, PlayStation®3, Wii™, PC,
Nintendo DSi, and PSP™
- Pure Futbol™ for Xbox 360® and PlayStation®3.
The Group expects first-quarter 2010-11 sales to come in at around €145 million,
approximately 75% higher than in the first quarter of 2009-10.
Full-year 2010-11
Ubisoft confirms that it expects to return to profitable growth and positive cash flow from
operating activities in fiscal 2010-11.
Significant events of 2009-10
Market share: In the first four months of calendar 2010, Ubisoft was the number 3
independent publisher in the United States with 6.8% market share (compared with
number 4 and 5.3% one year earlier); number 2 in Europe with 9.9% market share
(compared with number 3 and 8.5%); number 3 in France with 9.7% market share
(compared with number 3 and 8.3%); number 2 in the United Kingdom with 12.1%
market share (compared with number 3 and 9.3%); and number 2 in Germany with
9.4% market share (compared with number 3 and 7.7%).
Opening of a new studio in Toronto: During the year Ubisoft opened a full development
studio in Toronto, Ontario – a first for the company in the province. This is expected to
result in the creation of 800 net new jobs within the province over the next decade. The
government of Ontario plans to invest CA$ 263 million over ten years in the company.
Acquisition of Nadeo: Set up in 2000 in Paris, the Nadeo studio has won acclaim for the
quality of its multiplayer technology which offers one of the best available on-line game
experiences and has already notched up 10 million registered players. Its flagship game
– TrackMania® – has 700,000 unique players a month and is a pioneer in the sharing of
creations (almost 15 million custom tracks created since 2008). It is also the first eSport
franchise for racing games.
Launch of Uplay: In late 2009 Ubisoft launched Uplay – a portal for gamers which is set
to become the on-line hub for Ubisoft games.
4
6. APPENDICES
Breakdown of sales by geographic region
% Sales % Sales % Sales % sales
12 months 12 months
Q4 2009/10 Q4 2008/09 2009/10 2008/09
Europe 52% 46% 49% 54%
North America 40% 47% 43% 40%
Rest of world 8% 8% 8% 6%
TOTAL 100% 100% 100% 100%
Breakdown of sales by platform
12 months 12 months
Q4 2009/10 Q4 2008/09 2009/10 2008/09
Nintendo DS™ 13% 23% 14% 29%
PC 17% 13% 8% 9%
PlayStation®2 1% 2% 1% 2%
PLAYSTATION®3 12% 15% 23% 20%
PSP™ 4% 4% 4% 3%
Wii™ 42% 29% 26% 18%
XBOX 360™ 8% 15% 22% 19%
Other 1% 0% 2% 0%
TOTAL 100% 100% 100% 100%
Breakdown of sales by business line
12 months 12 months
Q4 2009/10 Q4 2008/09 2009/10 2008/09
Development 87% 75% 89% 81%
Publishing 6% 19% 7% 11%
Distribution 7% 7% 4% 8%
TOTAL 100% 100% 100% 100%
6
7. Title Release Schedule
1st Quarter (April – June 2010)
®
BATTLE OF GIANTS : MUTANT INSECTS (US) Nintendo DSiWARE
BLOODY GOOD TIME™ (EMEA) PC, Xbox 360
®
XLA
DANCE ON BROADWAY™ Wii™
GALAXY RACERS™ (EMEA) Nintendo DS™
®
HEROES OF MIGHT & MAGIC (CHINA) WEB-BASED
®
IMAGINE ANIMAL DOCTOR CARE CENTER (US) Nintendo DS™
MASTER ALL CLASSICS (EMEA) PLAYSTATION®3 PSN
MASTER ALL CLASSICS iPhone
®
Xbox 360 XLA ,
MIGHT AND MAGIC CLASH OF HEROES™(EMEA)
PLAYSTATION®3 PSN
MY CHINESE COACH iPad
®
PRINCE OF PERSIA CLASSIC iPhone
®
Xbox 360 ,
PRINCE OF PERSIA THE FORGOTTEN SANDS™ PLAYSTATION®3, Wii™ ,
Nintendo DSi™, PSP™, PC
Xbox 360®,
PURE FUTBOL™
PLAYSTATION®3
SILENT HUNTER® (US) iPhone
SPLINTER CELL CONVICTION™ Xbox 360®, PC
SPORTS COLLECTION (EMEA) Nintendo DS™
TOM CLANCY’S SPLINTER CELL CONVICTION™ Xbox 360®, PC
PLAYSTATION®3 PSN,
VOODOO DICE PSP™ PSN, Xbox 360™
XLA, Wii™WARE, PC
VOODOO DICE (EMEA) iPhone
7
8. Consolidated income statement by function
In thousand of euros 03/31/10 03/31/09
Sales 870 954 1 057 926
Cost of sales -358 118 -418 467
Gross Margin 512 836 639 459
Research and Development costs -309 403 -246 306
Marketing costs -196 115 -204 206
General and Administrative costs -66 894 -60 198
Current operating income -59 576 128 749
Fair value variation -367 0
Other operating income and expenses -53 1 570
Stock-based compensation -12 099 -16 855
Operating income -72 095 113 464
Net borrowing costs -546 929
Net foreign exchange losses 5 246 -5 343
Other financial income and expenses 50 -426
Net financial income 4 750 -4 840
Share of profit of associates 50 15
Income tax 23 624 -39 791
Profit for the period -43 672 68 848
Earnings per share
Basic earnings per share (in €)* -0,46 0,74
Diluted earnings per share (in €)* -0,45 0,71
Weighted average number of shares in issue (*) 94 192 93 362
Diluted weighted average number of shares in issue (*) 96 548 97 159
(*) after stock split
8
9. Consolidated balance sheet
ASSETS Net Net
In thousands of euros 3/31/10 3/31/09
Goodwill 106 498 99 545
Other intangible assets 526 383 480 911
Property, plant and equipment 31 800 27 423
Investments in associates 393 343
Other financial assets 3 613 3 354
Deferred tax assets 65 884 41 378
Non current assets 734 570 652 954
Inventory 47 973 62 294
Trade receivables 68 748 69 534
Other receivables 89 159 72 091
Other current financial assets 33 271 20 610
Current tax assets 25 080 19 039
Cash and cash equivalents 185 316 237 207
Current assets 449 547 480 775
Total assets 1 184 117 1 133 729
LIABILITIES AND EQUITY 3/31/10 3/31/09
In thousand of euros
Capital 7 320 7 274
Premiums 512 444 489 002
Consolidated reserves 285 380 186 632
Consolidated earnings - 43 672 68 848
Equity (Group share) 761 472 751 756
Minority interests
Total equity 761 472 751 756
Provisions 2 215 1 984
Employee benefit 1 710 1 641
Long-term borrowings 22 548 22 682
Deferred tax liabilities 32 921 60 320
Non-current liabilities 59 394 86 627
Short-term borrowings 121 784 61 822
Trade payables 144 499 136 664
Other liabilities 93 617 76 867
Current tax liabilities 3 352 19 993
Current liabilities 363 252 295 346
Total liabilities 422 646 381 973
Total liabilities and equity 1 184 118 1 133 729
9
10. Consolidated cash flow statement for comparison with other industry players
In thousand of euros 31.03.10 31.03.09
Cash flows from operating activities
Consolidated earnings -43 672 68 848
+/- Share of profit of associates -50 -15
+/- Amortization of game software 287 398 219 031
+/- Other amortization 17 428 16 337
+/- Provisions 4 335 2 034
+/- Cost of share-based payments 12 099 16 855
+/- Gains / losses on disposals 170 193
+/- Other income and expenses calculated -2 937 3 272
+/- Costs of internal development and license development
-331 474 -300 445
CASH FLOW FROM OPERATIONS -56 703 26 110
Inventory 12 057 -23 088
Trade receivables 2 440 19 738
Other assets -23 338 35 313
Trade payables 14 851 -33 399
Other liabilities -39 395 3 133
+/-Change in working capital from operating activities
-33 385 1 697
TOTAL CASH FLOW GENERATED BY OPERATING
ACTIVITIES -90 088 27 807
- Payments for the acquisition of property, plant and equipment
and other intangible assets -19 635 -30 229
+ Proceeds from the disposal of intangible assets and property,
plant and equipment 566 93
- Payments for the acquisition of financial assets -16 563 -36 042
+ Repayment of loans and other financial assets 16 472 35 181
+ Proceeds from the disposal of discontinued operations 0 0
(1)
+/- Changes in scope -8 157 -6 248
CASH USED BY INVESTING ACTIVITIES
-27 317 -37 245
Cash flows from financing activities
+ New finance leases 172 36
- Repayment of finance leases -81 -23
- Repayment of borrowings -649 -1 032
+ Proceeds from shareholders in capital increases
5033 12 799
+/- Sales / purchases of own shares -154 -349
CASH GENERATED (USED) BY FINANCING ACTIVITIES 4 321 11 431
Net change in cash and cash equivalents -113 084 1 993
Cash and cash equivalents at the beginning of the fiscal year
176 893 173 181
Impact of translation adjustments 1 169 1 721
Cash and cash equivalents at the end of the fiscal year
64 976 176 893
(1)
Including cash in companies acquired and disposed of
‐399 ‐1938
10
11. Consolidated cash flow statement
In thousand of euros 31.03.10 31.03.09
Cash flows from operating activities
Consolidated earnings -43 672 68 848
+/- Share of profit of associates -50 -15
+/- Depreciation and amortization 304 826 235 369
+/- Provisions 4 335 2 034
+/- Cost of share-based payments 12 099 16 855
+/- Gains / losses on disposals 170 193
+/- Other income and expenses calculated -2 937 2 655
+ Income tax paid - 23 624 39 791
Inventory 12 057 -23 088
Trade receivables 2440 19738
Other assets -18 995 37 580
Trade payables 14 851 -57 361
Other liabilities -8 526 -12 144
+/-Change in working capital from operating activities 1 827 -35 275
TOTAL CASH FLOW GENERATED BY OPERATING 252 973 330 455
ACTIVITIES
- Income tax paid -11 588 -26 195
NET CASH GENERATED BY OPERATING ACTIVITIES 241 386 304 260
- Payments of internal development and licence development
- Payments for the acquisition of intangible assets and property, -331 474 -276 499
plant and equipment
+ Proceeds from the disposal of intangible assets and property, -19 635 -30 214
plant and equipment
- Payments for the acquisition of financial assets 566 93
+/- Other cash flows from investing activities -16 562 -36 042
+ Repayment of loans and other financial assets 16 472 35 181
(1)
+/- Changes in scope -8 157 -6 219
CASH USED BY INVESTING ACTIVITIES -358 792 -313 700
Cash flows from financing activities
+ New finance leases 172 36
+ New borrowings 0 0
- Repayment of finance leases -81 -23
- Repayment of borrowings -649 -1 032
+ Proceeds from shareholders in capital increases 5 033 12 799
+/- Sales / purchases of own shares -154 -349
+/- Other flows 0 0
CASH GENERATED (USED) BY FINANCING ACTIVITIES 4 321 11 431
Net change in cash and cash equivalents -113 083 1 992
Cash and cash equivalents at the beginning of the fiscal year -176 890 -173 181
Impact of translation adjustments 1 169 1 718
Cash and cash equivalents at the end of the fiscal year1 64 976 176 890
(1)
Including cash in companies acquired and disposed of -399 -1938
11