Optimizing to maximum profit
•Télécharger en tant que DOCX, PDF•
1 j'aime•127 vues

In the current economic conditions, marketers are re-evaluating their strategies. Many marketers have gone from maximizing orders subject to a maximum CPA or maximizing revenue at an ROI to maximizing profit. While many marketers think that profit maximization requires a different kind of approach, it is not the case.

Recommandé
Contenu connexe
En vedette
En vedette (7)
Similaire à Optimizing to maximum profit
Similaire à Optimizing to maximum profit (20)
Dernier
Dernier (20)
Optimizing to maximum profit
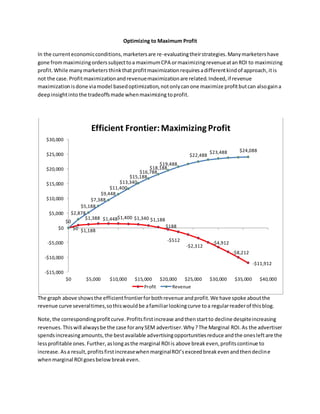
- 1. Optimizing to Maximum Profit In the currenteconomicconditions,marketersare re-evaluatingtheirstrategies.Manymarketershave gone frommaximizingorderssubjecttoa maximumCPA ormaximizingrevenueatanROI to maximizing profit.While manymarketersthinkthatprofitmaximizationrequiresadifferentkindof approach,itis not the case.Profitmaximizationandrevenuemaximizationare related.Indeed,if revenue maximizationisdone viamodel basedoptimization,notonlycanone maximize profitbutcan alsogaina deepinsightinto the tradeoffsmade whenmaximizing toprofit. The graph above showsthe efficientfrontierforbothrevenue andprofit.We have spoke aboutthe revenue curve severaltimes,sothiswouldbe afamiliarlookingcurve toa regularreaderof thisblog. Note,the correspondingprofitcurve.Profitsfirstincrease andthenstartto decline despiteincreasing revenues.Thiswill alwaysbe the case foranySEM advertiser.Why?The Marginal ROI.As the advertiser spendsincreasingamounts,the bestavailable advertisingopportunitiesreduce andthe onesleftare the lessprofitable ones. Further,aslongasthe marginal ROIis above breakeven,profitscontinue to increase. Asa result,profitsfirstincreasewhenmarginalROI’sexceedbreakevenandthendecline whenmarginal ROIgoesbelowbreakeven. $0 $1,188 $1,388 $1,448$1,400 $1,340 $1,188 $188 -$512 -$2,312 -$4,912 -$8,212 -$11,912 $0 $2,878 $5,188 $7,388 $9,448 $11,400 $13,340 $15,188 $16,788 $18,188 $19,488 $22,488 $23,488 $24,088 -$15,000 -$10,000 -$5,000 $0 $5,000 $10,000 $15,000 $20,000 $25,000 $30,000 $0 $5,000 $10,000 $15,000 $20,000 $25,000 $30,000 $35,000 $40,000 Efficient Frontier:MaximizingProfit Profit Revenue
- 2. The most interestingaspectof the profitcurve isitssensitivity.A closerlookatthe numbersbetween $4,000 and $14,000 of spend (Table 1) revealsthatthe pointof maximumprofitisat a spendof $8,000 witha profitof $1,448 and revenuesof $9,448. However,note thatthe difference inprofitatthe $8k spendlevel andthe $14k spendlevel isonly$260 ($1,448-$1,188). On the otherhand,the difference in revenue is ($5,740). Thisinsightbringsustothe crux of the discussion: Wouldyoube willingto forego $260 in profit(18% decrease) foran additional $5,740 in revenue (61% increase)? Cost Revenue Profit $ 4,000 $ 5,188 $ 1,188 $ 6,000 $ 7,388 $ 1,388 $ 8,000 $ 9,448 $ 1,448 $ 10,000 $ 11,400 $ 1,400 $ 12,000 $ 13,340 $ 1,340 $ 14,000 $ 15,188 $ 1,188 Table 1: Spend, Revenue andProfitatvaryingbudgetlevels. There are twootherkeypointsthat I wishtomake before endingthisdiscussion: Don’tget blindsidedbyrules:Theoretically,if Isimplybidbythe rule thatI shouldbideverykeywordto the positionof maximumprofitabilityIwouldbe able toreachthe conclusionasthe modelsbased portfolioapproach; Ishouldspend$8,000 for maximumprofitandwouldget$9,448 in revenue. However, you wouldneverknowaboutthe tradeoffsyouare makingbymakingthis rule andthat in our opinionisthe more importantquestion.I’ll askagain: Wouldyoube willingto forego$260 in profit for an additional $5,740 in revenue ? The discussionalsoassumesyouhave excellentmodelstocome to rightconclusion,whichbrings me tomynextpoint Make sure youhave great keywordmodels:Havingaccurate keywordmodelsiscrucial tooptimize your keywordset.Poormodelswouldleadtowrongbiddingdecisionswhichcouldadverselyaffectyour business.Goodmodelsare importantforrevenue maximizationbutare absolutelycrucial forprofit maximization.Considerforexample,thatthe revenue model atthe $4,000 spendleveloverpredicts 10%. The revenue wouldjumpto$$5,706 and the profitwouldbe estimatedat$1,706, the higestin the curve.If you were profitmaximizingyouwouldpickthisspendlevel andmake $5,188 inrevenue.The correct decisionwouldhave beentopickthe $8,000 spendlevelfor$9,448 in revenue.Thisdecisionjust cost you$4,260 in revenue !