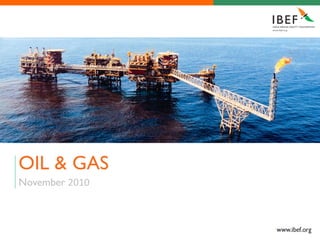
2. OIL & GAS November 2010
Contents
Advantage India
Market overview
Industry Infrastructure
Investments
Policy and regulatory framework
Opportunities
Industry associations
2
3. ADVANTAGE INDIA
Oil & Gas November 2010
Advantage India
Investment worth US$ 563 billion is expected across the oil and gas value chain under the Eleventh Plan (2007–2012).
• India is the third-highest consumer of
• 100 per cent foreign direct
coal (7.5 per cent share of global coal
investment (FDI) is allowed in Huge capital
consumption).
upstream and private sector investment
refining projects. plans • Over the period 2000–2009, oil and gas
consumption grew at a 5 per cent CAGR
• The FDI limit for public sector
to reach 184 million metric tonnes
refining projects has been raised Liberal FDI High demand (MMT). This is projected to reach 368
to 49 per cent. regime potential MMT by 2025.
Advantage
India
• About 130,000 people were
employed in the petroleum Enabling The Government of India (GoI) has
Skilled workforce
industry in 2009-10. regulation enacted various policies (such as new
• The University of Petroleum and and policy exploration licensing policy [NELP]
Energy Studies in Dehradun, and coal bed methane [CBM]) policy
Uttarakhand, is Asia’s first and to encourage investments across the
Substantial capacity industry’s value chain.
only energy university. additions
• Domestic gas supplies are projected to increase from 163 million metric standard cubic meters per day (MMSCMD) in 2009–10 to 285.4
MMSCMD by 2012.
• Refining capacity is projected to increase from 184.4 million metric tonnes per annum (MMTPA) in 2009–10 to 241 MMTPA by 2012.
Source: ―Basic statistics on Indian petroleum & natural gas 2009–10,‖ and ―Report of the Working Group on Petroleum & Natural Gas Sector for
the XI Plan (2007-2012),‖ Ministry of Petroleum & Natural Gas website, http://petroleum.nic.in/, accessed 6 December 2010.
3
4. OIL & GAS November 2010
Contents
Advantage India
Market overview
Industry Infrastructure
Investments
Policy and regulatory framework
Opportunities
Industry associations
4
5. MARKET OVERVIEW
Oil & Gas November 2010
Market overview
• Petroleum products and natural gas together contributed 2.8 per cent (US$ 30.8 billion) to the
country’s total GDP (US$ 1089.3 billion) in 2008–09.
Key segments — upstream, midstream and downstream
• The upstream segment comprises exploration and production (E&P) activities.
• The midstream segment is involved in storage and transportation of crude oil and natural gas.
• The downstream segment is engaged in refining and production of petroleum products, and processing,
storage, marketing and transportation of commodities such as crude oil and natural gas.
Source: ―Basic statistics on Indian petroleum & natural gas 2009–10,‖ Ministry of Petroleum & Natural Gas website, http://petroleum.nic.in/,
accessed 6 December 2010.
5
6. MARKET OVERVIEW
Oil & Gas November 2010
Upstream segment — exploratory and development drilling
2009–10
• The total number of exploratory and Area
development wells and metreage drilled in India Wells Metreage
was 428 and 1019 thousand metres, respectively, Exploratory
in 2009–10. Onshore 110 298
Offshore 34 128
• The national oil companies executed the bulk of Development
the drilling. Onshore 236 470
Offshore 48 123
Source: “Hydrocarbon Exploration and Production Activities India 2009–2010,‖ Directorate General of Hydrocarbons website,
http://dghindia.org/Publication.aspx, accessed 6 December 2010.
6
7. MARKET OVERVIEW
Oil & Gas November 2010
Upstream segment — annual crude oil production … (1/2)
• Total production of crude oil stood at 33.7 MMT Annual crude oil production (MMT) — company-wise details
in 2009–10, 0.6 per cent higher than the
production in 2008-09 (33.5 MMT). 2009-10 24.9 3.6 5.3
2008-09
• In 2009–10, total domestic oil consumption 25.4 3.5 4.7
stood at 160 MMT, a decrease of 0.5 per cent 2007-08 25.9 3.1 5.1
over the previous year.
2006-07 26.1 3.1 4.8
• The Oil & Natural Gas Corporation (ONGC)
and Oil India Ltd (OIL) accounted for 73.8 per 2005-06 24.4 3.2 4.6
cent and 10.6 per cent, respectively, of total
domestic crude oil production in 2009–10.The 0.0 10.0 20.0 30.0 40.0
remaining share is held by private/joint venture ONGC OIL Private/JV
(JV) fields.
ONGC: Oil & Natural Gas Corporation; OIL: Oil India Ltd
Sources: Relevant company annual reports 2008–09 and
2009–10; Ministry of Petroleum & Natural Gas website,
http://petroleum.nic.in/, accessed 6 December 2010.
7
8. MARKET OVERVIEW
Oil & Gas November 2010
Upstream segment — annual crude oil production … (2/2)
• Offshore production accounted for 64.9 per cent Annual crude oil production (MMT) — offshore/onshore
of domestic annual crude oil production for
21.9
2009–10.The remaining share was contributed 2009-10
11.8
by onshore production. 2008-09 22.2
11.3
2007-08 22.9
• During the Eleventh Five Year Plan period (2007– 11.2
2012), production of crude oil is expected to 2006-07
11.3
22.7
increase by 24 per cent over oil production 20.8
2005-06
during the Tenth Five Year Plan period (2002–07). 11.4
0.0 5.0 10.0 15.0 20.0 25.0
Offshore Onshore
Source: Ministry of Petroleum & Natural Gas website,
http://petroleum.nic.in/, accessed 6 December 2010.
8
9. MARKET OVERVIEW
Oil & Gas November 2010
Upstream segment — annual natural gas production … (1/2)
• Total production of natural gas stood at 47.5 Annual natural gas production (BCM) — company-wise details
BCM in 2009-10 — 44.6 per cent more than the
previous year’s production (32.9 BCM). 2009–10 23.1 2.4 22.0
2008–09 22.5 2.3 8.1
• The demand for domestic gas was estimated at
226 MMSCMD in 2009–10, whereas gas supply 2007–08 22.3 2.3 7.7
was 163 MMSCMD.
2006–07 22.4 2.3 7.0
• ONGC accounted for 48.6 per cent (23.1 BCM) 2005–06 22.6 2.3 7.4
of total natural gas production during the year.
0 10 20 30 40 50
• Private/JV fields accounted for 46.3 per cent of ONGC OIL Private/JV
total natural gas production This was mainly due
to commencement of gas production at
Reliance’s KG basin. Source: ―Basic statistics on Indian petroleum & natural
gas 2009–10,‖ Ministry of Petroleum & Natural Gas
website, http://petroleum.nic.in/, accessed 6 December
• Total production of natural gas is expected to 2010.
reach 255.3 BCM by the end of the Eleventh Plan
period.
9
10. MARKET OVERVIEW
Oil & Gas November 2010
Upstream segment — annual natural gas production … (2/2)
• In 2009–10, offshore gas production accounted Annual natural gas production (BCM) — offshore/onshore
for 81.7 per cent of total annual gas production
38.8
in India.The remaining share was contributed by 2009–10
8.7
onshore production. 24.1
2008–09
8.8
• Offshore production grew at the rate of 14.4 per 2007–08
9.1
23.3
cent CAGR over the period 2005–10. 22.5
2006–07
9.3
2005–06 22.6
9.6
0.0 10.0 20.0 30.0 40.0 50.0
Offshore Onshore
Sources: ―Basic statistics on Indian petroleum & natural
gas 2009–10,‖ and ―Report of the Working Group on
Petroleum & Natural Gas Sector for the XI Plan (2007-
2012),‖ Ministry of Petroleum & Natural Gas website,
http://petroleum.nic.in/, accessed 6 December 2010.
10
11. MARKET OVERVIEW
Oil & Gas November 2010
Midstream segment — crude pipeline capacity
• As on 1 April 2010, the total length and Existing crude pipelines in India (as on 1 April 2010)
capacity of the crude oil pipelines stood at Capacity Length
6,235 kms and 92.6 MMTPA respectively. Name of the pipeline
(MMTPA) (km)
OIL - Duliajan-Digboi-Bongaigaon-Barauni 8.4 1,193
• ONGC holds 47.3 per cent of the crude
IOCL - Salaya-Mathura-Panipat Pipeline 21 1,870
pipeline capacity in India with a 673 kms
long pipeline network. IOCL - Haldia-Barauni/Paradip Barauni 11 1,302
IOCL - Mundra-panipat 8.4 1,194
• IOCL holds 43.6 per cent of the crude ONGC-Mumbai High-Uran 15.63 204
pipeline capacity in India with its 4,366 kms ONGC-Heera-Uran 11.5 81
long network of crude pipelines. ONGC-Kalol-Nawagam-Koyali 8.54 129.31
ONGC-MHN-NGM 2.26 77
• Remaining share of the crude pipeline
capacity is held by OIL which owns the ONGC-CTF , Ank to Koyali (AKCL) 2 94.8
1,193 km long Duliajan-Digboi-Bongaigaon- ONGC-Lakwa-Moran 1.5 18
Barauni pipeline having a capacity of 8.4 ONGC-Geleki-Jorhat 1.5 48.47
MMTPA. ONGC-NRM to CPCL 0.74 6
ONGC-KSP-WGGS to TPK refinery 0.08 13.5
ONGC-GMAA EPT to S. Yanam unloading
0.09 4
terminal
Total 92.64 6,235
Sources: ―Basic statistics on Indian petroleum & natural gas 2008–09,‖ Ministry of Petroleum & Natural Gas website, http://petroleum.nic.in/,
accessed 6 December 2010.
11
12. MARKET OVERVIEW
Oil & Gas November 2010
Downstream segment — refining … (1/2)
• India has 20 refineries — 17 in the public sector and Annual refinery crude throughput
three in the private sector.
Refinery crude
Year throughput
• The country’s refining capacity increased to 184.4 (MMT)
MMTPA in April 2010 from 178 MMTPA in the
2009–2010 160.03
previous year.
2008–09 160.77
• Its total refinery crude throughput in 2009–10 was 2007–08 156.10
160 MMT, 0.5 per cent lower than the volume in 2006–07 146.55
2008–09 (160.8 MMT). 2005–06 130.10
2004–05 127.41
Source: ―Basic statistics on Indian petroleum & natural gas 2009–10,‖ Ministry of Petroleum & Natural Gas website,
http://petroleum.nic.in/, accessed 6 December 2010.
12
13. MARKET OVERVIEW
Oil & Gas November 2010
Downstream segment — refining … (2/2)
• The GoI has opened the refining industry to Refining capacity details (as on 1 April 2010)
private sector investment to increase Installed Pro-rata capacity
domestic refining capacity. Public sector capacity utilisation (per
(MMT) cent)
• Reliance Industries has emerged as the Indian Oil Corporation Limited
48.85 102.0
largest domestic refiner and has overtaken (IOCL)
Indian oil Corporation (IOCL) after the Hindustan Petroleum
13.8 121.2
commissioning of the former’s Reliance Corporation Limited (HPCL)
Petroleum Ltd (SEZ) (RPL [SEZ]) refinery in Chennai Petroleum Corporation
10.5 96.2
2008, which has increased the company’s Limited (CPCL)
total refining capacity to 62 MMT. Numaligarh Refinery Limited
3 87.3
(NRL)
ONGC 0.066 70.5
Source: ―Basic statistics on Indian petroleum & natural gas
2008–09,‖ Ministry of Petroleum & Natural Gas website, Mangalore Refinery and
11.82 129
http://petroleum.nic.in/, accessed 6 December 2010. Petrochemicals Limited (MRPL)
Installed Pro-rata capacity
Private sector capacity utilisation (per
(MMTPA) cent)
RIL 62 104.3*
Essar 10.5 128.6
*does not contain the RPL (SEZ) capacity utilisation
13
14. MARKET OVERVIEW
Oil & Gas November 2010
Downstream segment — production of petroleum products
• The production of petroleum products was Production of petroleum products (MMT)
151.9 MMT (including 2.2 MMT of LPG 100.0
production from natural gas) in 2009–10, a 80.3 79.4
decrease of 0.5 per cent over last year’s 80.0
production (152.7 MMT) 60.0
40.2 40.4
40.0
• Petroleum products derived from crude oil 30.0 29.9
include: 20.0
• Light distillates — LPG, mogas, naphtha,
0.0
natural gas liquids (NGL)
2008-09 2009-10
• Middle distillates — kerosene
• Heavy ends — furnace and lube oils, Light distillates Middle distillates Heavy ends
bitumen, petroleum coke, paraffin wax
• Production of petroleum products is expected
to reach 904.8 MMT by the end of the
Eleventh Plan period.
Source: ―Basic statistics on Indian petroleum & natural gas 2009–10,‖ Ministry of Petroleum & Natural Gas website, http://petroleum.nic.in/,
accessed 6 December 2010.
14
15. MARKET OVERVIEW
Oil & Gas November 2010
Downstream segment — marketing, retail and distribution
• Total sales of petroleum products by Existing pipeline network in India (as on 1 April 2010)
companies was 138.2 MMT in 2009–10, which
Capacity
was 3.6 per cent higher than in the previous Length (km) Throughput
(MMTPA)
year (133.4 MMT). Pipeline (as on 1 (MMT)
(as on 1 April
April 2010) (2009–10)
2010)
• IOC had the maximum retail outlets in the
country at 51.1 per cent, followed by HPCL at Product 65.90 10,615.8 52.1
25 per cent and BPCL at 23.8 per cent. The LPG 3.90 2,252 3.5
remaining outlets were owned by private Crude 92.64 6,235.08 72.64
players.
Total 162.44 19,103 128.24
• The total number of retail outlets of public
sector oil marketing companies (OMCs)
increased to 36,462 in April 2010 from 34,948
in 2009.
• The number of LPG distributors in India
totaled 9,686 as on 1 April 2010.
Source: ―Basic statistics on Indian petroleum & natural gas 2009–10,‖ Ministry of Petroleum & Natural Gas website, http://petroleum.nic.in/,
accessed 6 December 2010.
15
16. MARKET OVERVIEW
Oil & Gas November 2010
Consumption pattern — energy consumption mix
• India is largely dependent on coal and oil for its Energy consumption mix in India (2009)
energy needs, and this dependency has been
increasing over the years. Energy source Unit Consumption
Coal MTOE 245.8
• The country’s consumption of coal increased
Oil MMT 148.5
to 245.82 million tonnes of oil equivalent
(MTOE) in 2009, an increase of 6.5 per cent Natural gas MTOE 46.7
over the previous year (230.9 MTOE),
Hydroelectricity MTOE 24
underscoring the importance of coal as a
primary source of energy. Nuclear energy MTOE 3.8
Projected energy consumption mix in India (2030)
Source: ―BP Statistical Review of World Energy June 2010,‖ BP.
Product Unit World India
Oil MTOE 5775 435
Gas MTOE 4125 224
Coal MTOE 3597 816
Source: ―Draft report of the expert committee on Integrated Energy
Policy,‖ Planning Commission 2005.
16
17. MARKET OVERVIEW
Oil & Gas November 2010
EXIM scenario
• The total value of gross crude and Import trend in oil and gas sector
petroleum imports was estimated at 7.0
US$ 87.2 billion (INR 4,184.8 billion) in 2009-10 78.2 1.9
2009–10. 13.4
2008-09 72.6 2.0
• The following are the volumes of 2007-08
12.7
56.8 1.5
imports in 2009–10:
8.6
• Crude oil —159.3 MMT 2006-07 45.6 1.2
• LNG — 8.8 MMT 5.8
2005-06 35.8 0.7
• Petroleum products — 14.7 MMT
Import value (US$ billion) 0.0 20.0 40.0 60.0 80.0 100.0
• India’s primary exports in this sector Crude Oil Petroleum products LNG
include petroleum products.
• The total value of its export of
petroleum products was estimated at
US$ 30 billion (INR 1,440.4 billion) in
2009–10.
Source: ―Basic statistics on Indian petroleum & natural gas 2009–10,‖ Ministry of Petroleum & Natural Gas website, http://petroleum.nic.in/,
accessed 6 December 2010.
17
18. MARKET OVERVIEW
Oil & Gas November 2010
Key players – Indian … (1/2)
Turnover in 2009–10
Company Sector Operations Remarks
US$ billion (INR billion)
Exploration and production
• IOC accounts for a market share of nearly
(E&P), refining, distribution and
46 per cent in domestic petroleum products,
54 (2593.6) marketing through pipelines,
IOC Public 34 per cent of the national refining capacity
downstream petroleum,
and 54 per cent of downstream sector
natural gas marketing, bio-fuels
product pipeline capacity.
and wind power projects
• ONGC has the largest share of hydrocarbon
acreage in India.
E&P and downstream business
• The company operates 15 major fields that
22.1 (1,061.7) (through its subsidiary —
ONGC Public contribute about 60 per cent of India’s oil
Mangalore Refinery and
production.
Petrochemicals [MRPL])
• It also has the maximum number of
exploration licenses.
Refining, aviation fuelling and • HPCL has a strong presence in lubricants in
HPCL Public 23.6 (1,131.6) marketing of petroleum India, and owns brands such as HP Cruise,
products HP Lal Ghoda and HP Racer 4.
• BPCL was the first public sector oil company
to implement enterprise resource planning
Refining, aviation fuelling and
(ERP) solutions in the country.
BPCL Public 27.9 (1,337.5) marketing of petroleum
• The company has set up one of the biggest
products
centres of excellence in Asia to provide
online support to end users.
• OIL is primarily engaged in the development
OIL Public 1.6 (79) E&P
of small and medium-sized fields.
18
19. MARKET OVERVIEW
Oil & Gas November 2010
Key players — Indian … (2/2)
Turnover in
2009–10
Company Sector Operations Remarks
US$ billion
(INR billion)
• GAIL has pioneered the development of India's gas transmission
E&P, gas processing,
GAIL infrastructure and currently owns about 7,850 km of natural gas
transmission,
(India) Public 5.6 (270.4) pipelines. It has transmission capacity of over 150 mmscmd.
distribution, marketing
Limited • The company owns north India’s only gas-based integrated
and petrochemicals
petrochemicals complex.
• RIL is credited with the first discovery of gas in the Krishna-Godavari
(KG) basin in 2008, and is capable of producing 40 per cent of India’s
current oil and gas output.
E&P, petroleum refining • The company made its second discovery in May 2008 and third one in
44.1
RIL Private and marketing and December 2009.
(2,117.3)
petrochemicals • Production of natural gas at the KG basin commenced in June 2009.
• RIL currently has 13 blocks in its international E&P portfolio.
• The company has the largest grassroots refinery in the Asia-Pacific
region at Jamnagar in Gujarat.
Essar Oil E&P, refining and
Private 8.8 (424) • Essar has the largest CBM acreage in India (2,700 sq kms).
Limited marketing
Adani Gas • Adani has set up a gas distribution network at Ahmedabad and
Private 5.4 (258.9) Natural gas distribution
* Vadodara in Gujarat and Faridabad in Haryana
Petronet LNG re-gasification • Petronet has set up India’s first LNG re-gasification terminal at Dahej
Private 2.2 (106)
LNG terminal in Gujarat, which currently has a capacity of 10 MMTPA.
*Revenue figures pertain to parent company revenues
Source: ―Basic statistics on Indian petroleum & natural gas 2009-10.‖ Ministry of Petroleum & Natural Gas website, http://petroleum.nic.in/, accessed 6
December 2010.; relevant company annual reports.
19
20. MARKET OVERVIEW
Oil & Gas November 2010
Key players — international
Turnover
Company Sector (2009–10) Operations Remarks
US$ billion
• Cairn operates the largest producing oil field in the
Indian private sector.
Cairn Exploration,
• The company has drilled about 81 wells (including six
Energy India Private 0.34 production and crude
horizontal and tested wells in 2009 , achieving a
Pty Ltd pipeline
production rate of more than 11,500 barrels of oil
per day (bopd).
Fuel retailing; supply of
crude, petroleum • Shell has an LNG re-gasification terminal at Hazira in
278.2 products and Gujarat, which has a capacity of 3.7 MMTPA.
Shell# Private (year ending chemicals; technology • The company has established Shell Technology India
February 2010) support to oil and gas in Bangalore, for technical support services for Shell’s
companies; lubricant operations in India and worldwide.
and LNG production
• The BG Group has a 65.12 per cent stake in Gujarat
16.1
E&P, transmission and Gas Company Limited, India’s largest private sector
BG Group# Private (year ending
distribution natural gas distribution company, in terms of its sales
December 2009)
volume.
239.3 • Castrol India, a part of the BP Group, is the second-
(year ending Automotive lubricants, largest player in the Indian lubricant industry and the
BP# Private
December 2009) E&P and solar power market leader in the retail automotive lubricant
segment.
#Revenue figures pertain to group revenues
Sources: Relevant company annual reports.
20
21. MARKET OVERVIEW
Oil & Gas November 2010
Key trends — alternative fuels … (1/3)
Coal bed methane (CBM)
• CBM is an eco-friendly natural gas (methane), which is adsorbed in coal and lignite seams. Coal is the main
source of CBM production, which is conducted by simple depressurisation and dewatering processes.
• Exploration and production of CBM activities furthers the quest to reduce the greenhouse effect and earn
carbon credits.
• The GoI approved the CBM Policy in July 1997.
• The first commercial production of CBM was initiated in July 2007 at about 72,000 cubic metres per day.
Four rounds of bidding have been completed till date:
• CBM i (2001) — 7 blocks offered
• CBM ii (2003) — 9 blocks offered
• CBM iii (2006) — 10 blocks offered
• CBM iv (2009) — 10 blocks offered
• India is the fourth-largest coal producer in the world with the third-largest proven coal reserves. With about
4.6 TCM of CBM resources, the country has significant prospects for commercial recovery of CBM.
Source: Directofourth- General of Hydrocarbons website, www.dghindia.org/, accessed 09 November 2010.
21
22. MARKET OVERVIEW
Oil & Gas November 2010
Key trends — alternative fuels … (2/3)
Underground coal gasification (UCG)
• The technique of underground coal gasification converts unminable underground coal or lignite into
combustible gases by gasifying the coal in situ. The technology was first widely used in the US in the
1800s and in India, in Kolkata and Mumbai, in the early 1900s. UCG is currently the only feasible
technology available to harness energy from deep unminable coal seams, both economically and in an
environmentally clean manner. This process reduces capital investment and operating costs as well as
the cost of output gases by 25 to 50 per cent compared to surface gasification.
22
23. MARKET OVERVIEW
Oil & Gas November 2010
Key trends — alternative fuels … (3/3)
Gas hydrates
• The GoI has initiated the National Gas Hydrate Programme (NGHP) to map gas hydrates for use as an
alternate source of energy by extracting methane from solids below the seabed in the deep ocean and
the permafrost regions of the world.
• NGHP is a consortium of national E&P companies and research institutions.
Biofuels
• Biofuels (bioethanol and biodiesel) are fuels that are produced as an alternate source of energy from
domestic renewable resources.
• Biofuels have lower emissions compared to petroleum or diesel.
• In India, biodiesel is produced from plants (renewable resources) such as jatropha and has the potential
to reduce the country’s dependence on oil imports.
• Bioethanol is mainly produced from sugar or starch containing materials such as sugarcane and
cellulosic material.
• The GoI has signed an agreement with the US to develop a joint clean energy research and
development centre with second generation biofuels as one of its priority areas.
Sources: Directorate General of Hydrocarbons 2007–08 annual report, website, www.dghindia.org/CBMRounds.aspx?tab=0, accessed 6
December 2010, ―Status report on underground coal gasification,‖ August 2007, Government of India; ―National Policy on Biofuels,‖ Ministry of
New and Renewable Energy website, www.mnre.gov.in/policy/biofuel-policy.pdf, accessed 17 November 2010.
23
24. MARKET OVERVIEW
Oil & Gas November 2010
Growth drivers … (1/2)
Abundant raw material Industry-wise utilisation of natural gas in India
35,000 32,111
• India has large reserves of coal, crude oil and 30,000
Million cubic metres
natural gas. 25,000 22,191
18,978
20,000
15,135
Growing demand for natural gas 15,000 11,892 10,541
10,000
• Utilisation of natural gas in different industries 5,000
has increased over the years. 0
2007-08 2008-09 2009-10
Energy purposes Non-energy purposes
Source: ―Basic statistics on Indian petroleum & natural gas 2009–
10,‖ http://petroleum.nic.in/, accessed 6 December 2010.
24
25. MARKET OVERVIEW
Oil & Gas November 2010
Growth drivers … (2/2)
• Natural gas is an important input in various industries for the following:
• Energy:
• Power generation
• Industrial and domestic fuel
• Tea plantations
• Captive use or LPG shrinkage
• Non-energy:
• Fertiliser industry
• Petrochemicals
• CNG
25
26. OIL & GAS November 2010
Contents
Advantage India
Market overview
Industry Infrastructure
Investments
Policy and regulatory framework
Opportunities
Industry associations
26
27. INDUSTRY INFRASTRUCTURE
Oil & Gas November 2010
Industry infrastructure
Name of SEZ and Area Developer/
State Sector Details
status (hectares) Promoter
• Dedicated pipeline-cum-road
corridor (proposed)
1.Petrochemicals • Water and power available
ONGC,
Mangalore SEZ Ltd and petroleum • Non-processing zone to have
Karnataka 588 KIADB,
(Notified) 2. Multi-product housing, offices, educational and
IL&FS, KCCI
(proposed) health facilities
• Proposed units — OMPL, ISPRL,
MRPL refinery
• Target companies from upstream
Gujarat
Gujarat and downstream businesses
Hydro-
Hydrocarbons and • Proposed residential
Gujarat 140 Oil and gas carbons and
Power SEZ Ltd accommodation, educational,
Power SEZ
(Formal approval) healthcare and recreational
Ltd
facilities
Nagarjuna Oil
Corporation • Establishment of a 6 MMTPA
Nagarjuna Oil Ltd, petroleum refinery at an estimated
Petrochemicals
Corporation Ltd Tamil Nadu 104.01 Nagarjuna cost of about US$ 1 billion
and petroleum
(Formal approval) Fertilisers & • Project expected to be
Chemicals commissioned by mid-2011
Ltd
Sources: Relevant SEZ official websites
Karnataka Industrial Development Board (KIADB), Karnataka Chamber of Commerce and Industry (KCCI), ONGC Mangalore Petrochemicals Ltd
(OMPL), Indian Strategic Petroleum Reserves Limited (ISPRL)
27
28. OIL & GAS November 2010
Contents
Advantage India
Market overview
Industry Infrastructure
Investments
Policy and regulatory framework
Opportunities
Industry associations
28
29. INVESTMENTS
Oil & Gas November 2010
Investments — FDI
• India’s petroleum and natural gas sectors attracted FDI equity worth US$ 525 million between April 2010
and September 2010.
• Cumulative FDI in the petroleum and natural gas sectors has been estimated at US$ 3.2 billion between
April 2000 and September 2010.
Country-wise FDI (April 2000–September 2010) Cumulative FDI
FDI (total value) Period: April 2000 to September 2010
Country Focus area(s)
(US$ million)
Sector Amount of FDI
Singapore 11,329 Oil refinery and transportation (US$ million)
Petroleum and natural gas 3,191
Mauritius 51,089 Oil refinery and fuel
UK 6,212 Oil refinery, oil exploration and fuel Source: ―Factsheet on FDI,‖ Department of Industrial Policy and
Promotion (DIPP) website, www.dipp.nic.in, accessed 6 December,
2010.
Cyprus 4,314 Oil refinery, oil exploration and fuel
US 9,002 Oil refinery and fuel
Source: ―Basic statistics on Indian petroleum & natural gas 2009–10.‖ Ministry
of Petroleum & Natural Gas website, http://petroleum.nic.in/, accessed 6
December 2010.
29
30. INVESTMENTS
Oil & Gas November 2010
Investments — M&A … (1/2)
• Inbound deals: M&A scenario — details
• ONGC signed a Memorandum of
Period : January 2009 to August 2010
Understanding (MoU) with Arrow Energy
(Australia) for cooperation in CBM Deal type No of deals
Deal value
production in 2009. (US$ million)
Inbound 7 27
• Vedanta Resources signed an agreement to Outbound 4 3,065
buy 51 to 60 per cent of Cairn India’s oil
and gas assets for US$ 9.6 billion.Vedanta Domestic 8 3826
seeks to acquire a 31 to 40 per cent stake
directly and the remaining 20 per cent Sources: Bloomberg, Thomson One Banker; company
websites
through its subsidiary, Sesa Goa.
• Domestic deals:
• 2009: IOCL has bought a 5 per cent stake
in OIL for US$ 232.9 million.
• 2010: Reliance Power Ltd has acquired
Reliance Natural Resources Ltd for US$
1,529 million.
30
31. INVESTMENTS
Oil & Gas November 2010
Investments — M&A … (2/2)
• Outbound deals:
• Reliance Eagleford Upstream LP, a subsidiary of Reliance India Ltd (RIL), has entered a JV with
Pioneer Natural Resources Company. It will acquire a 45 per cent stake in Pioneer’s Eagle Ford
Shale acreage for a consideration of US$ 1.3 billion.
• Reliance Marcellus LLC, a subsidiary of Reliance India Ltd (RIL), has formed a JV with Atlas
Energy, Inc The former has acquired a 40 per cent interest in Atlas’ Marcellus Shale acreage for
US$ 1.7 billion.
• An international consortium, comprising Indian national oil companies, has acquired a 40 per
cent stake in Empresa Mixta in Venezuela. The members and their stakes include ONGC Videsh
Limited (OVL) —11.0 per cent, IOCL — 3.5 per cent, OIL — 3.5 per cent, Repsol YPF — 11
per cent and PETRONAS — 11 per cent. The total project cost is US$ 19 billion.
• Through its subsidiary, Reliance Marcellus II, LLC, Reliance Industries has formed a 60:40 JV with
Carrizo Oil & Gas, Inc of the US. Reliance plans to acquire a 20 per cent interest in Carrizo’s
52,600 net acres in Pennsylvania’s shale acreages for US$ 65 million through the agreement. The
company will also acquire a 100 per cent stake in these acreages from an affiliate of Avista
Capital Partners for US$ 327 million.
31
32. INVESTMENTS
Oil & Gas November 2010
Increasing demand
• Between 2005 and 2010, India’s consumption and *Crude oil — demand-supply trend
import of crude oil increased steadily, while 200.0
production remained largely stagnant due to the 143.6
159.3
148.5
country’s low oil discovery rate. 150.0 132.9 132.8
Value (MMT)
119.6 120.4 121.7
99.4 111.5
100.0
• Imports are currently meeting the high demand
for crude oil as a source of energy. They 50.0 32.2 34.0 34.1 33.5 33.7
accounted for 82.5 per cent of total crude oil
supply in 2009–10. 0.0
2005-06 2006-07 2007-08 2008-09 2009-10
*Demand projections
Production Consumption Imports
Product Unit 2014–15 2019–20 2024–25
Petroleum
MMT 226 288 368
products
Natural gas MMSCMD 329 358 391
*Sources: ―Basic statistics on Indian petroleum & natural gas 2009-10," Ministry of Petroleum & Natural Gas website, http://petroleum.nic.in/,
accessed 6 December 2010; ―BP Statistical Review of World Energy, June 2010,‖ BP; ―India Hydrocarbon Vision 2025,‖ Government of India
32
33. OIL & GAS November 2010
Contents
Advantage India
Market overview
Industry Infrastructure
Investments
Policy and regulatory framework
Opportunities
Industry associations
33
34. POLICY AND REGULATORY FRAMEWORK
Oil & Gas November 2010
Policy and regulatory framework … (1/4)
FDI policy
Sector/Activity FDI Cap/Equity Entry route Other conditions
Subject to the sectoral
regulations of the Ministry
E&P 100% Automatic
of Petroleum & Natural
Gas
49% for public sector undertakings Foreign Investment
(PSUs) without involving any Promotion Board
Refining divestment or dilution of domestic (FIPB) for PSUs and Subject to sectoral policy
equity in existing PSUs; 100% for automatic route for
private companies private companies
Source: ―Petroleum and natural gas sector FDI,‖ Ministry of Petroleum & Natural Gas website, http://petroleum.nic.in/, accessed 6 December 2010.
34
35. POLICY AND REGULATORY FRAMEWORK
Oil & Gas November 2010
Policy and regulatory framework … (2/4)
• Oil Field (Regulation and Development) Act, 1948
• Oil and Natural Gas Commission Act, 1959
• Petroleum and Minerals Pipelines Act, 1962 — acquisition of user’s rights by the GoI on land
demarcated for laying pipelines for the transport of petroleum and other minerals from one area to
another
• Oil Industry (Development) Act, 1974
• Coal Bed Methane Policy, 1997 — to encourage exploration and production of CBM gas as a new
eco-friendly source of energy
35
36. POLICY AND REGULATORY FRAMEWORK
Oil & Gas November 2010
Policy and regulatory framework … (3/4)
• Freight Subsidy (for far-flung areas) Scheme, 2002 — to compensate public sector OMCs on
the freight incurred to distribute subsidized products in far-flung areas
• Auto Fuel Policy 2003 — to provide a roadmap to comply with various vehicular emission norms
and corresponding fuel quality upgrading requirements over a period of time
• National Biofuel Policy, 2002 — to promote biofuel usage, the GoI has provided concessional
excise duty of 16 per cent on bioethanol and exempted biodiesel from excise duty.
• Petroleum and Natural Gas Regulatory Board (PNGRB) Act, 2006 — to regulate refining,
processing, storage, transportation, distribution, marketing and sale of petroleum, petroleum products
and natural gas
• New Exploration Licensing Policy (NELP), 1999 — to provide a contract framework for E&P of
hydrocarbons; licenses for exploration only awarded through a competitive bidding system; eight
rounds of bidding completed so far
Source: Ministry of Petroleum & Natural Gas 2007–08 annual report.
36
37. POLICY AND REGULATORY FRAMEWORK
Oil & Gas November 2010
Policy and regulatory framework … (4/4)
Government of India initiatives
• The Eleventh Plan outlay for the oil and gas sector has been fixed at US$ 47.7 billion (INR 2,290.7
billion), about 121 per cent more than the allocation for the Tenth Plan.
• Thrust areas for E&P in the plan:
• Increasing domestic production by attracting investments in the upstream sector
• Increasing production at ONGC’s assets, including its maturing fields
• Providing exploration coverage of 80 per cent during the period
• Establishing a national knowledge hub during the period
• Improvement of gas availability:
• Intensifying domestic E&P activities
• Exploiting new sources of energy such as CBM
• Conducting underground coal gasification
• Implementing the National Gas Hydrate Programme (NGHP) to evaluate hydrate resources
• The GoI has formulated a regulatory framework for the safe usage of LPG and CNG as an automotive
fuel.
Source: Ministry of Petroleum & Natural Gas 2007–08 annual report.
37
38. POLICY AND REGULATORY FRAMEWORK
Oil & Gas November 2010
New Exploration Licensing Policy (NELP) … (1/2)
• The GoI formulated the NELP in 1997–98 to provide an equal platform to both public and private
sector companies for exploration and production of hydrocarbons.
• The NELP was conceptualised to increase domestic production and to attract inward investments.
• The introduction of this policy has had a catalytic effect on the liberalisation of the oil and gas sector by
opening up the E&P segment for investments.
• Under the NELP, acreages are offered to participating companies through open competitive bidding.
Chronology of events:
• 1998 — 48 exploration blocks offered in the first round
• 2000 — second round of the NELP launched and 25 exploration blocks offered
• 2002 — third round of the NELP launched and 27 exploration blocks offered
• 2003 — fourth round of the NELP launched and 24 exploration blocks offered
38
39. POLICY AND REGULATORY FRAMEWORK
Oil & Gas November 2010
New Exploration Licensing Policy (NELP) … (2/2)
• 2005 — fifth round of the NELP launched and 20 exploration blocks offered
• 2006 — sixth round of the NELP launched and 55 exploration blocks offered
• 2007 — seventh round of the NELP launched and 57 exploration blocks offered
• 2009 — eighth round of the NELP launched and 70 exploration blocks offered
• 2010 — ninth round of the NELP launched on 15 October 2010 — bid closing date 18 March 2011
Sources: ―Chronology of E&P events in India,‖ Directorate General of Hydrocarbons website,
http://www.dghindia.org/EandPGovernanceInIndia.aspx, accessed 5 January 2010; ―Press note on launch of NELP – VIII,‖ 9 April, 2009, Ministry
of Petroleum & Natural Gas website www.petrolrum.nic.in; NELP-IX website, http://www.indianelpix.com/, accessed 15 November 2010;
―India-US Agreement for Setting up Joint Clean Energy Research and Development Centre,‖ 9 November 2010, Press Information Bureau,
Government of India website, http://www.pib.nic.in/newsite/erelease.aspx?relid=0, accessed 16 November 2010.
39
40. POLICY AND REGULATORY FRAMEWORK
Oil & Gas November 2010
Highlights of the CBM Policy
• Blocks are awarded through an open international competitive bidding system.
• The GoI has no participating interest.
• No upfront payment is required.
• Exemption from payment of customs duty on imports is required for CBM operations.
• Companies have the freedom to sell gas in the domestic market.
• Companies are provided a seven-year tax holiday.
Source: Directorate General of Hydrocarbons 2007–08 annual report.
40
41. POLICY AND REGULATORY FRAMEWORK
Oil & Gas November 2010
PNGRB — key functions
For petroleum, petroleum products and natural gas:
• Ensures the availability of resources at all times
• Monitors prices and transportation rates to check restrictive trade practices
• Ensures equitable distribution
• Enforces retail service obligations for retail outlets and marketing service obligations for entities
• Maintains information data bank of activities relating to petroleum, petroleum products and natural gas
• Lays down technical standards for related activities in this sector
Source: ―About PNGRB,‖ PNGRB website, www.pngrb.gov.in, accessed 11 November 2010.
41
42. OIL & GAS November 2010
Contents
Advantage India
Market overview
Industry Infrastructure
Investments
Policy and regulatory framework
Opportunities
Industry associations
42
43. OPPORTUNITIES
Oil & Gas November 2010
Opportunities in the upstream segment … (1/2)
• India has significant potential to discover new oil and gas basins since 78 per cent of the country’s
sedimentary area is yet to be explored. Recent large-scale oil and gas discoveries in the Krishna
Godavari and Rajasthan basins have amply demonstrated this potential.
Exploration and
development of new • The GoI has enacted favourable regulatory policies and provided several fiscal incentives to promote
fields the development of the domestic upstream segment. As a result, the NELP has received an
encouraging response so far. A total of 246 blocks were awarded under the eight bidding rounds
(from 2001 to November 2010) and 68 oil and gas discoveries have been made so far in the NELP
blocks.
• In India, drilling activities are moving towards the deep sea, as most areas nominated under the
NELP are under the deep sea. In the eight rounds of NELP bidding, a total of 80 deep sea blocks
were awarded. Consequently, this has opened up opportunities for global upstream companies to
carry out deepwater exploration, either independently or in partnerships, with domestic players.
• The GoI has also opened up avenues for the exploration and development of CBM fields. Up till
Development of 2010, 31 CBM blocks have been awarded over four rounds of CBM bidding.
unconventional • Methane hydrates are expected to be an important source of energy in the future, especially after
resources the discovery of methane hydrate reserves in the Krishna, Godavari and Andaman basins. India has
recently set up the National Gas Hydrate Program (NGHP) to harness the potential of this source.
• Furthermore, the development of shale gas in the country is likely to gain importance with the
technological advancements taking place. India has signed an MoU with the US for shale gas
cooperation, including resource assessment and technical studies for shale gas exploration in the
country, as well as for training Indian personnel in the shale gas domain.
Sources: Ministry of Petroleum & Natural Gas website, www.petroleum.nic.in; ―India-US MOU on Shale Gas,‖ Ministry of Petroleum & Natural Gas, 8
November 2010, Press Information Bureau, Government of India website, http://www.pib.nic.in/newsite/erelease.aspx?relid=0, accessed 17 November 2010.
43
44. OPPORTUNITIES
Oil & Gas November 2010
Opportunities in the upstream segment … (2/2)
• There are promising opportunities for companies specialising in the deployment of secondary and
Mature oil-
tertiary forms of enhanced oil recovery (EOR) techniques, since the majority of the country’s
producing basins
producing basins have matured or have begun to mature.
• The demand for skilled human resources is set to increase since the segment is witnessing
Increasing demand substantial capacity augmentation across the value chain.
for skilled labour
• This is a ready platform for global petroleum institutes to establish their presence in India.
• E&P spend in the country has doubled from about US$ 2.5 billion in 2004–05 to about US$ 5 billion
in 2007–08. Overall E&P spend is expected to be in the range of US$ 90–110 billion in the next 7–10
Growing demand years.
for oilfield services
(OFS) and • This is will create a sustained demand for OFS, e.g., drilling rigs, offshore support vessels, tubular
equipment goods, and seismic services and equipment for constructing process platforms, pipelines and
collecting stations, as well as other surface facilities for transportation of oil and gas from wells to
delivery points.
Source: Ministry of Petroleum & Natural Gas; ONGC website, www.ongcindia.com, accessed 16 November 2010.
44
45. OPPORTUNITIES
Oil & Gas November 2010
Opportunities in the midstream segment
• The country’s gas pipeline coverage has increased substantially and has significant potential for
further expansion. India currently has a trunk gas pipelines network of 9,900 km with a transmission
capacity of 292 MMSCMD.
• Domestic gas supplies are expected to increase significantly from the new domestic gas fields and
Expansion of gas
LNG capacity. To monetise the increased gas supplies, the GoI is aggressively promoting setting up
transmission
of gas transmission infrastructure across the country by encouraging the participation of players
pipelines
from the private and public sectors. For example, GAIL (India) Ltd is planning to lay 6,663 km of gas
pipelines by 2012–13 at an estimated costs of US$ 6.3 billion (INR 303 billion), which will provide
ample opportunities for gas transmission, engineering, engineering procurement construction (EPC)
and pipeline-manufacturing companies.
• Between 2004 and 2010, LNG imports’ share in the total domestic gas supply of the country has
improved significantly from 1 per cent to 20 per cent due to brownfield and greenfield expansions.
Augmentation of • India is expected to witness significant expansion in its LNG re-gasification capacity in the near to
LNG capacity medium term, which is expected to increase the share of LNG in its domestic gas supply to 32 per
cent in 2015. This is expected to create opportunities for players specialising in operating LNG
terminals, engineering and provision of EPC services.
Source: Ministry of Petroleum & Natural Gas website, www.petroleum.nic.in, accessed 6 December 2010; Welspun Corp website,
www.welspun.com, accessed 17 November 2010.
45
46. OPPORTUNITIES
Oil & Gas November 2010
Opportunities in the downstream segment … (1/2)
• The successful development of CGD networks in Delhi and Mumbai, coupled with the support provided
by the GoI, is likely to give a boost to this segment in the scenario of increasing gas availability. PNGRB
Emphasis on city gas projects may result in CGD coverage growing from 41 cities at present to 250 cities by 2020, which
distribution (CGD) would entail an investment of about US$ 8–9 billion.
networks • Therefore, this segment offers promising opportunities to both global and domestic players in the field of
CGD infrastructure development, including gas distribution pipelines, CNG stations and manufacturing
of CNG kits.
• Domestic refiners are aggressively increasing their refining capacity by expanding their existing facilities
and building new grassroot refineries. Indian refiners are expected to increase their capacity by 62
MMTPA by 2010–2012. With significant capacity additions planned, India is expected to become a global
refining hub.
• Opportunities for players to construct new refineries, either independently or in collaboration, are due
to the following reasons:
Augmentation of • India offers low construction and operation costs to set up new refineries in the country.
refining capacity • The country’s favourable location and vast coastline provides its refiners with a strategic freight
advantage.
• Developed countries are expected to increasingly rely on imported petroleum products as stringent
environmental norms and high capital costs limit refining capacity, construction and/or expansion in
these countries. This presents an opportunity for Indian refiners to increase their exports.
• India has favourable regulatory policies, such as relaxation of FDI limits and tax rebates for new
refineries, to promote capacity enhancement in this segment.
Source: Ministry of Petroleum & Natural Gas website, www.petroleum.nic.in, accessed 6 December 2010; PNGRB website, www.pngrb.gov.in,
accessed 11 November 2010.
46
47. OPPORTUNITIES
Oil & Gas November 2010
Opportunities in the downstream segment … (2/2)
• The demand for transportation and cooking fuel is expected to increase significantly in the future.
This is expected to drive the demand for new transportation fuels and LPG marketing stations.
• The GoI has projected an investment of US$ 12.7 billion (INR 608 billion) for the development of
marketing infrastructure for petroleum products for 2007–2012. Consequently, this creates
opportunity for the following:
Expansion of • Enhanced role of private players in domestic distribution of petroleum products
petroleum product
• Manufacturing and distribution of LPG cylinders, kits, valves, regulators, etc., as well as
distribution
manufacturing of new LPG pipelines, tankers and bottling facilities
networks
• Collaboration between private and foreign players with domestic oil marketing companies in
areas including the expansion of retail networks and logistics support
• International experience could be leveraged in building non fuel retailing business (convenience
stores) and brand building activities such as quality assurance, loyalty cards, conducting surveys
and soliciting customer feedbacks.
Source: Ministry of Petroleum & Natural Gas website, www.petroleum.nic.in, accessed 6 December 2010
47
48. OIL & GAS November 2010
Contents
Advantage India
Market overview
Industry Infrastructure
Investments
Policy and regulatory framework
Opportunities
Industry associations
48
49. INDUSTRY ASSOCIATIONS
Oil & Gas November 2010
Industry associations
Name Address Contact person Telephone E-mail
Mr T S
91-11-
Oil Industry Balasubramanian,
301, World Trade Centre, Babar 23413298
Development Board Financial Adviser oidb@hotmail.com
Road, New Delhi –110001 91-11-
(OIDB) and Chief Accounts
23414692
Officer
Petroleum 91-11-
Sanrakshan Bhavan, 10 Bhikaji Cama Mr Arun Kumar,
Conservation Research 26198799 pcra@pcra.org
Place, New Delhi – 110066 ED
Association (PCRA) Ext.301
Ministry of Power, 4th floor, SEWA 91-11-
Bureau of Energy Dr Ajay Mathur, dg-bee@nic.in,
Bhawan, RK Puram, New Delhi – 26178316, 91-
Efficiency (BEE) Director General amathur@beenet.in
110066 11- 26179699
Ministry of Petroleum & Natural Gas,
Oil Industry Safety 7th floor, ―New Delhi House‖, 27 91-11-
Mr J B Verma, ED verma.jb@gov.in
Directorate Barakhamba Road, New Delhi – 23316798
110001
Ministry of Petroleum & Natural Gas,
91-11-
Petroleum Planning and 2nd floor, Core-8, SCOPE Complex, 7 Dr Basudev
24362501, 91- -
Analysis Cell (PPAC) Institutional Area, Lodhi Road, New Mohanty, Director
11- 24361380
Delhi – 110003
Directorate General of Ministry of Petroleum & Natural Gas, Mr S K Srivastava, 0120 -
dg@dghindia.org
Hydrocarbons C-139, Sector 63, Noida – 201301 Director General 4029401
49
50. NOTE
Oil & Gas November 2010
Note
Wherever applicable, numbers in the report have been rounded off to the nearest whole number.
Exchange rate used: US$ 1= INR 48
50
51. OIL & GAS November 2010
DISCLAIMER
India Brand Equity Foundation (―IBEF‖) engaged Ernst & presentation to ensure that the information is accurate to
Young Pvt Ltd to prepare this presentation and the same the best of Ernst & Young and IBEF’s knowledge and belief,
has been prepared by Ernst & Young in consultation with the content is not to be construed in any manner
IBEF. whatsoever as a substitute for professional advice.
All rights reserved. All copyright in this presentation and Ernst & Young and IBEF neither recommend nor endorse
related works is solely and exclusively owned by IBEF. The any specific products or services that may have been
same may not be reproduced, wholly or in part in any mentioned in this presentation and nor do they assume
material form (including photocopying or storing it in any any liability or responsibility for the outcome of decisions
medium by electronic means and whether or not taken as a result of any reliance placed on this
transiently or incidentally to some other use of this presentation.
presentation), modified or in any manner communicated
to any third party except with the written approval of Neither Ernst & Young nor IBEF shall be liable for any
IBEF. direct or indirect damages that may arise due to any act
or omission on the part of the user due to any reliance
This presentation is for information purposes only. While placed or guidance taken from any portion of this
due care has been taken during the compilation of this presentation.
51